***Last / Change / Volume data in this table is the closing quote data***
Symbol/Exchange
Company Name
Industry Group |
PRICE |
CHANGE
(%Change) |
Day High |
Volume
(% DAV)
(% 50 day avg vol) |
52 Wk Hi
% From Hi |
Featured
Date |
Price
Featured |
Pivot Featured |
|
Max Buy |
BIDU
-
NASDAQ
Baidu Inc Ads
INTERNET - Internet Information Providers
|
$126.80
|
-1.74
-1.35% |
$128.99
|
5,131,685
68.52% of 50 DAV
50 DAV is 7,489,100
|
$131.63
-3.67%
|
2/1/2011
|
$117.74
|
PP = $112.08
|
|
MB = $117.68
|
 Most Recent Note - 2/18/2011 4:20:44 PM
G - Hovering near all-time highs with average or light volume while few investors appear to be heading for the exit. Prior highs in the $112-115 area define initial chart support to watch above its 50 DMA line.
>>> The latest Featured Stock Update with an annotated graph appeared on 2/2/2011. Click here.
View all notes |
Alert me of new notes |
CANSLIM.net Company Profile |
SEC |
Zacks Reports |
StockTalk |
News |
Chart |
Request a new note
C
A N
S L
I M


|
CMG
-
NYSE
Chipotle Mexican Grill
LEISURE - Restaurants
|
$260.15
|
-5.39
-2.03% |
$266.81
|
1,234,431
120.27% of 50 DAV
50 DAV is 1,026,400
|
$275.00
-5.40%
|
2/11/2011
|
$271.15
|
PP = $262.87
|
|
MB = $276.01
|
Most Recent Note - 2/18/2011 4:25:30 PM
Y - Losses on higher volume this week were signs of distributional pressure, and it finished Friday near the session low and below its pivot point, raising some concerns. Recently reported strong earnings and technically rallied "straight up from the bottom" from an 11-week cup shaped base without a handle.
>>> The latest Featured Stock Update with an annotated graph appeared on 2/11/2011. Click here.
View all notes |
Alert me of new notes |
CANSLIM.net Company Profile |
SEC |
Zacks Reports |
StockTalk |
News |
Chart |
Request a new note
C
A N
S L
I M
|
CRUS
-
NASDAQ
Cirrus Logic Inc
ELECTRONICS - Semiconductor - Specialized
|
$24.58
|
-0.57
-2.27% |
$25.24
|
2,491,466
76.01% of 50 DAV
50 DAV is 3,277,800
|
$25.48
-3.53%
|
1/28/2011
|
$20.69
|
PP = $19.17
|
|
MB = $20.13
|
Most Recent Note - 2/18/2011 4:43:05 PM
G - Volume totals have been cooling while it has been holding its ground in a tight range, extended from its latest sound base pattern. Patience may allow for secondary buy points to develop. Prior highs define chart support levels to watch on pullbacks.
>>> The latest Featured Stock Update with an annotated graph appeared on 1/28/2011. Click here.
View all notes |
Alert me of new notes |
CANSLIM.net Company Profile |
SEC |
Zacks Reports |
StockTalk |
News |
Chart |
Request a new note
C
A N
S L
I M
|
CTSH
-
NASDAQ
Cognizant Tech Sol Cl A
COMPUTER SOFTWARE and SERVICES - Business Software and Services
|
$77.73
|
+0.85
1.11% |
$77.74
|
2,636,270
120.65% of 50 DAV
50 DAV is 2,185,100
|
$77.26
0.61%
|
2/7/2011
|
$75.09
|
PP = $76.46
|
|
MB = $80.28
|
Most Recent Note - 2/18/2011 4:47:23 PM
Y - Closed near the session high with 20% above average volume behind today's 7th consecutive small gain for a new 52-week high. Found support at its 50 DMA line recently, and it faces no resistance due to overhead supply.
>>> The latest Featured Stock Update with an annotated graph appeared on 2/8/2011. Click here.
View all notes |
Alert me of new notes |
CANSLIM.net Company Profile |
SEC |
Zacks Reports |
StockTalk |
News |
Chart |
Request a new note
C
A N
S L
I M
|
DECK
-
NASDAQ
Deckers Outdoor Corp
CONSUMER NON-DURABLES - Textile - Apparel Footwear
|
$90.03
|
-0.54
-0.60% |
$92.67
|
1,704,404
108.50% of 50 DAV
50 DAV is 1,570,900
|
$90.75
-0.79%
|
2/3/2011
|
$79.61
|
PP = $82.67
|
|
MB = $86.80
|
Most Recent Note - 2/18/2011 4:51:46 PM
Y - Held its ground at an all-time high today. Technically, it managed a powerful positive reversal on 2/17/11 and clinched a late buy signal based on the previously noted "double bottom" base pattern. The recent consolidation was too short to be considered a proper "handle" on a cup-with-handle pattern, however one may also consider it to be rising from a 9-week flat base (no new pivot point is being cited). The stock is free of all resistance due to overhead supply.
>>> The latest Featured Stock Update with an annotated graph appeared on 1/26/2011. Click here.
View all notes |
Alert me of new notes |
CANSLIM.net Company Profile |
SEC |
Zacks Reports |
StockTalk |
News |
Chart |
Request a new note
C
A N
S L
I M
|
Symbol/Exchange
Company Name
Industry Group |
PRICE |
CHANGE
(%Change) |
Day High |
Volume
(% DAV)
(% 50 day avg vol) |
52 Wk Hi
% From Hi |
Featured
Date |
Price
Featured |
Pivot Featured |
|
Max Buy |
EZCH
-
NASDAQ
Ezchip Semiconductor Ltd
ELECTRONICS - Semiconductor - Specialized
|
$30.01
|
-0.29
-0.96% |
$30.33
|
366,265
97.28% of 50 DAV
50 DAV is 376,500
|
$33.48
-10.36%
|
12/2/2010
|
$27.53
|
PP = $26.00
|
|
MB = $27.30
|
Most Recent Note - 2/18/2011 4:54:51 PM
G - Sputtering near its 50 DMA line for the past week. On 2/10/11 it reported earnings +41% on +33% sales revenues for the quarter ended December 31, 2010, and gapped down undercutting its 50 DMA line and prior chart highs in the $29 area then rebounded to close well above both. As previously noted - "Volume and volatility often increase near corporate earnings news."
>>> The latest Featured Stock Update with an annotated graph appeared on 1/21/2011. Click here.
View all notes |
Alert me of new notes |
CANSLIM.net Company Profile |
SEC |
Zacks Reports |
StockTalk |
News |
Chart |
Request a new note
C
A N
S L
I M
|
EZPW
-
NASDAQ
Ezcorp Inc Cl A
SPECIALTY RETAIL - Specialty Retail, Other
|
$27.94
|
-0.19
-0.68% |
$28.45
|
390,710
99.85% of 50 DAV
50 DAV is 391,300
|
$29.94
-6.68%
|
2/18/2011
|
$27.94
|
PP = $30.04
|
|
MB = $31.54
|
Most Recent Note - 2/18/2011 5:01:15 PM
Y - Staying near its 50 DMA line and showing resilience in recent weeks. Color code is changed to yellow with new pivot point cited based on its 1/17/11 high plus ten cents after a short flat base. Subsequent gains with heavy volume with a rally above its pivot point may trigger a new (or add-on) technical buy signal. Recent low ($25.56 on 1/25/11) defines an important support level now.
>>> The latest Featured Stock Update with an annotated graph appeared on 2/3/2011. Click here.
View all notes |
Alert me of new notes |
CANSLIM.net Company Profile |
SEC |
Zacks Reports |
StockTalk |
News |
Chart |
Request a new note
C
A N
S L
I M
|
FOSL
-
NASDAQ
Fossil Inc
CONSUMER DURABLES - Recreational Goods, Other
|
$78.89
|
+0.47
0.60% |
$79.65
|
740,862
96.79% of 50 DAV
50 DAV is 765,400
|
$83.68
-5.72%
|
2/1/2011
|
$73.30
|
PP = $74.44
|
|
MB = $78.16
|
Most Recent Note - 2/18/2011 5:03:40 PM
G - This week it held its ground following a gap down on 2/15/11 after 8 consecutive gains into new high territory. Reported earnings +42% on +33% sales revenues. Prior resistance in the $74 area defines initial chart support above its 50 DMA line.
>>> The latest Featured Stock Update with an annotated graph appeared on 1/12/2011. Click here.
View all notes |
Alert me of new notes |
CANSLIM.net Company Profile |
SEC |
Zacks Reports |
StockTalk |
News |
Chart |
Request a new note
C
A N
S L
I M
|
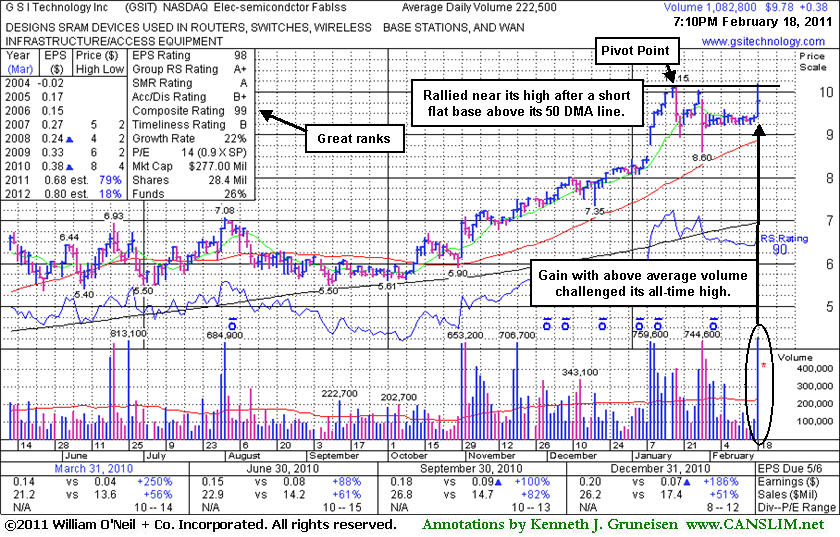
GSIT
-
NASDAQ
G S I Technology Inc
ELECTRONICS - Semiconductor - Broad Line
|
$9.78
|
+0.38
4.04% |
$10.20
|
1,084,162
482.49% of 50 DAV
50 DAV is 224,700
|
$10.15
-3.65%
|
2/18/2011
|
$10.08
|
PP = $10.25
|
|
MB = $10.76
|
Most Recent Note - 2/18/2011 5:07:48 PM
Y - Closed in the middle of its intra-day range with a solid gain backed by more than 4 times average volume. On the right side of an orderly flat base near minimum length. Reported earnings +186% on +51% sales revenues for the quarter ended December 31, 2010 versus the year ago period. Volume and volatility often increase near earnings news. Color code was changed to yellow with a pivot point cited based on its 1/18/11 high plus 10 cents. A convincing volume-driven close above its pivot point may trigger a technical buy signal. Prior mid-day reports noted - "Leadership (L criteria) in the Semiconductor group is also reassuring. Caution is called for, as the investment system guidelines discourage buying low-priced stocks."
>>> The latest Featured Stock Update with an annotated graph appeared on 2/18/2011. Click here.
View all notes |
Alert me of new notes |
CANSLIM.net Company Profile |
SEC |
Zacks Reports |
StockTalk |
News |
Chart |
Request a new note
C
A N
S L
I M
|
HMSY
-
NASDAQ
H M S Holdings Corp
COMPUTER SOFTWARE and SERVICES - Healthcare Information Service
|
$73.92
|
+1.96
2.72% |
$74.28
|
278,323
190.50% of 50 DAV
50 DAV is 146,100
|
$72.48
1.99%
|
11/19/2010
|
$61.89
|
PP = $63.01
|
|
MB = $66.16
|
Most Recent Note - 2/18/2011 1:06:56 PM
G - Prior highs near $67 define initial support to watch on pullbacks. Hit yet another new 52-week high today with its 14th consecutive gain with ever-increasing volume since it found support at its 50 DMA line. It quietly rose from an orderly base-on-base type pattern. Relative Strength rank (now 76) was noted as a concern and has only gradually improved.
>>> The latest Featured Stock Update with an annotated graph appeared on 2/16/2011. Click here.
View all notes |
Alert me of new notes |
CANSLIM.net Company Profile |
SEC |
Zacks Reports |
StockTalk |
News |
Chart |
Request a new note
C
A N
S L
I M
|
Symbol/Exchange
Company Name
Industry Group |
PRICE |
CHANGE
(%Change) |
Day High |
Volume
(% DAV)
(% 50 day avg vol) |
52 Wk Hi
% From Hi |
Featured
Date |
Price
Featured |
Pivot Featured |
|
Max Buy |
JOBS
-
NASDAQ
Fifty One Job Inc Ads
DIVERSIFIED SERVICES - Staffing and; Outsourcing Service
|
$59.95
|
+0.28
0.47% |
$61.99
|
108,579
80.31% of 50 DAV
50 DAV is 135,200
|
$61.28
-2.17%
|
2/7/2011
|
$59.23
|
PP = $61.38
|
|
MB = $64.45
|
Most Recent Note - 2/18/2011 5:09:37 PM
Y - Touched a new 52-week high today but lacked the volume conviction to produce a powerful breakout. Its 50 DMA line and recent low ($52.58 on 1/28/11) define important support where violations would raise concerns and trigger technical sell signals. After a long ascending base pattern, subsequent volume-driven gains above its pivot point may trigger a new (or add-on) technical buy signal.
>>> The latest Featured Stock Update with an annotated graph appeared on 2/7/2011. Click here.
View all notes |
Alert me of new notes |
CANSLIM.net Company Profile |
SEC |
Zacks Reports |
StockTalk |
News |
Chart |
Request a new note
C
A N
S L
I M
|
LULU
-
NASDAQ
Lululemon Athletica
MANUFACTURING - Textile Manufacturing
|
$82.12
|
-0.32
-0.39% |
$83.24
|
993,183
42.57% of 50 DAV
50 DAV is 2,332,800
|
$85.28
-3.71%
|
1/26/2011
|
$68.11
|
PP = $74.70
|
|
MB = $78.44
|
Most Recent Note - 2/18/2011 5:10:37 PM
G - Quietly hovering in a tight range near its 52-week high after a recent streak of 7 consecutive gains with higher volume. Extended from its latest sound base, its prior highs near $74 define chart support to watch now.
>>> The latest Featured Stock Update with an annotated graph appeared on 1/14/2011. Click here.
View all notes |
Alert me of new notes |
CANSLIM.net Company Profile |
SEC |
Zacks Reports |
StockTalk |
News |
Chart |
Request a new note
C
A N
S L
I M
|
MWIV
-
NASDAQ
M W I Veterinary Supply
HEALTH SERVICES - Medical Instruments and; Supplies
|
$68.37
|
+0.57
0.84% |
$68.43
|
108,605
170.49% of 50 DAV
50 DAV is 63,700
|
$72.27
-5.40%
|
11/4/2010
|
$61.79
|
PP = $59.60
|
|
MB = $62.58
|
Most Recent Note - 2/18/2011 5:13:09 PM
G - Held its ground today after an analyst downgrade and gap down on the prior session from its all-time high. It has not built a sound new base pattern. Prior highs in the $67 area define initial chart support to watch. Sales revenues acceleration (bigger percentage increases sequentially, +34%, +41%, +45% and +55% in the Mar, Jun, Sep, and Dec '10 quarterly comparisons versus the year earlier) is a very reassuring sign.
>>> The latest Featured Stock Update with an annotated graph appeared on 2/2/2011. Click here.
View all notes |
Alert me of new notes |
CANSLIM.net Company Profile |
SEC |
Zacks Reports |
StockTalk |
News |
Chart |
Request a new note
C
A N
S L
I M
|
NFLX
-
NASDAQ
Netflix Inc
SPECIALTY RETAIL - Music and Video Stores
|
$235.51
|
-0.12
-0.05% |
$238.37
|
4,589,459
82.47% of 50 DAV
50 DAV is 5,565,300
|
$247.55
-4.86%
|
1/10/2011
|
$187.88
|
PP = $209.34
|
|
MB = $219.81
|
Most Recent Note - 2/18/2011 5:14:15 PM
G - Hovering near its all-time high, extended from any sound base. Prior high ($209) defines support to watch above its 50 DMA line.
>>> The latest Featured Stock Update with an annotated graph appeared on 1/10/2011. Click here.
View all notes |
Alert me of new notes |
CANSLIM.net Company Profile |
SEC |
Zacks Reports |
StockTalk |
News |
Chart |
Request a new note
C
A N
S L
I M
|
NTAP
-
NASDAQ
Netapp Inc
COMPUTER HARDWARE - Data Storage Devices
|
$53.05
|
-1.72
-3.14% |
$55.25
|
11,238,065
255.25% of 50 DAV
50 DAV is 4,402,800
|
$61.02
-13.06%
|
1/6/2011
|
$57.49
|
PP = $58.06
|
|
MB = $60.96
|
Most Recent Note - 2/18/2011 5:56:23 PM
G - It slumped below the prior chart low ($53.14) previously noted as an important support level after violating its 50 DMA line on the prior session, raising concerns and triggering technical sell signals. Reported earnings +30% on +25% sales revenues for the quarter ended January 31, 2011 versus the year ago period.
>>> The latest Featured Stock Update with an annotated graph appeared on 2/4/2011. Click here.
View all notes |
Alert me of new notes |
CANSLIM.net Company Profile |
SEC |
Zacks Reports |
StockTalk |
News |
Chart |
Request a new note
C
A N
S L
I M
|
Symbol/Exchange
Company Name
Industry Group |
PRICE |
CHANGE
(%Change) |
Day High |
Volume
(% DAV)
(% 50 day avg vol) |
52 Wk Hi
% From Hi |
Featured
Date |
Price
Featured |
Pivot Featured |
|
Max Buy |
OPEN
-
NASDAQ
Opentable Inc
INTERNET - Internet Software and Services
|
$90.04
|
-2.85
-3.07% |
$93.15
|
1,172,772
126.99% of 50 DAV
50 DAV is 923,500
|
$95.97
-6.18%
|
1/5/2011
|
$74.05
|
PP = $76.79
|
|
MB = $80.63
|
Most Recent Note - 2/18/2011 5:21:25 PM
G - Down today with higher volume while consolidating this week following a streak of volume-driven gains for new all-time highs. Extended from a sound base pattern, meanwhile prior highs define support above its 50 DMA line. See the latest FSU summary for more details and an annotated graph.
>>> The latest Featured Stock Update with an annotated graph appeared on 2/15/2011. Click here.
View all notes |
Alert me of new notes |
CANSLIM.net Company Profile |
SEC |
Zacks Reports |
StockTalk |
News |
Chart |
Request a new note
C
A N
S L
I M
|
ORCL
-
NASDAQ
Oracle Corp
COMPUTER SOFTWARE and SERVICES - Application Software
|
$33.68
|
+0.67
2.03% |
$33.71
|
25,539,769
97.79% of 50 DAV
50 DAV is 26,118,000
|
$33.59
0.27%
|
1/20/2011
|
$32.31
|
PP = $32.37
|
|
MB = $33.99
|
Most Recent Note - 2/18/2011 5:25:01 PM
Y - Volume total picked up to near average as it rallied to a new 52-week high today. Recently volume had been cooling while hovering below its "max buy" level. Near-term support to watch is its 50 DMA line.
>>> The latest Featured Stock Update with an annotated graph appeared on 1/7/2011. Click here.
View all notes |
Alert me of new notes |
CANSLIM.net Company Profile |
SEC |
Zacks Reports |
StockTalk |
News |
Chart |
Request a new note
C
A N
S L
I M
|
PAY
-
NYSE
Verifone Systems Inc
COMPUTER HARDWARE - Transaction Automation Systems
|
$46.86
|
-2.55
-5.16% |
$49.67
|
2,270,077
156.38% of 50 DAV
50 DAV is 1,451,600
|
$49.91
-6.11%
|
1/27/2011
|
$41.77
|
PP = $44.97
|
|
MB = $47.22
|
Most Recent Note - 2/18/2011 5:31:05 PM
Y - Down today with above average volume, pulling back from its 52-week high. Slumped to a close back below its "max buy" level, and its color code is changed to yellow. Technically, it triggered a new (or add-on) technical buy signal with its 2/14/11 gain and quickly got extended.
>>> The latest Featured Stock Update with an annotated graph appeared on 1/27/2011. Click here.
View all notes |
Alert me of new notes |
CANSLIM.net Company Profile |
SEC |
Zacks Reports |
StockTalk |
News |
Chart |
Request a new note
C
A N
S L
I M
|
PCLN
-
NASDAQ
Priceline.Com Inc
INTERNET - Internet Software and Services
|
$448.93
|
-6.34
-1.39% |
$457.58
|
968,479
104.43% of 50 DAV
50 DAV is 927,400
|
$464.47
-3.35%
|
1/3/2011
|
$399.55
|
PP = $428.20
|
|
MB = $449.61
|
Most Recent Note - 2/18/2011 5:32:55 PM
Y - Color code is changed to yellow after consolidating back below its "max buy" level as it closed out the week. Prior highs and its 50 DMA line define support to watch.
>>> The latest Featured Stock Update with an annotated graph appeared on 2/14/2011. Click here.
View all notes |
Alert me of new notes |
CANSLIM.net Company Profile |
SEC |
Zacks Reports |
StockTalk |
News |
Chart |
Request a new note
C
A N
S L
I M
|
RAX
-
NYSE
Rackspace Hosting Inc
INTERNET - Internet Software and; Services
|
$38.45
|
-0.44
-1.13% |
$38.90
|
1,214,700
64.60% of 50 DAV
50 DAV is 1,880,400
|
$40.62
-5.34%
|
1/10/2011
|
$22.84
|
PP = $32.76
|
|
MB = $34.40
|
Most Recent Note - 2/18/2011 5:36:18 PM
G - Perched near all-time highs today it is extended from any sound base, consolidating following a considerable gap up gain on 2/11/11 with heavy volume after reporting earnings +29% on +27% sales revenues for the quarter ended December 31, 2010 versus the year ago period. Recent highs near $35 define support to watch above its 50 DMA line.
>>> The latest Featured Stock Update with an annotated graph appeared on 2/9/2011. Click here.
View all notes |
Alert me of new notes |
CANSLIM.net Company Profile |
SEC |
Zacks Reports |
StockTalk |
News |
Chart |
Request a new note
C
A N
S L
I M
|
Symbol/Exchange
Company Name
Industry Group |
PRICE |
CHANGE
(%Change) |
Day High |
Volume
(% DAV)
(% 50 day avg vol) |
52 Wk Hi
% From Hi |
Featured
Date |
Price
Featured |
Pivot Featured |
|
Max Buy |
ROVI
-
NASDAQ
Rovi Corp
COMPUTER SOFTWARE andamp; SERVICES - Security Software andamp; Services
|
$57.85
|
-2.28
-3.79% |
$60.11
|
5,228,093
277.88% of 50 DAV
50 DAV is 1,881,400
|
$69.50
-16.76%
|
10/29/2010
|
$49.99
|
PP = $53.10
|
|
MB = $55.76
|
Most Recent Note - 2/18/2011
G - Down today for a 4th consecutive loss with above average volume, slumping further below the previously noted 1/31/11 low ($60.15) defining near-term chart support. Weaker fundamentals and technical action raised concerns after it reported earnings +8% on +2% sales for the quarter ended December 31, 2010 versus the year-ago period. It failed to rebound after violating its 50 DMA line when a largest ever 1-day point loss on 2/16/11 with more than 4 times average volume triggered a worrisome technical sell signal. Based on the above mentioned concerns it will be dropped from the Featured Stocks list tonight.
>>> The latest Featured Stock Update with an annotated graph appeared on 1/25/2011. Click here.
View all notes |
Alert me of new notes |
CANSLIM.net Company Profile |
SEC |
Zacks Reports |
StockTalk |
News |
Chart |
Request a new note
C
A N
S L
I M
|
TIBX
-
NASDAQ
Tibco Software Inc
COMPUTER SOFTWARE and SERVICES - Business Software and Services
|
$25.56
|
+0.09
0.35% |
$25.67
|
1,145,665
42.15% of 50 DAV
50 DAV is 2,718,200
|
$25.94
-1.46%
|
2/1/2011
|
$24.35
|
PP = $22.18
|
|
MB = $23.29
|
Most Recent Note - 2/18/2011 5:43:06 PM
G - Perched near its 52-week high after wedging higher with gains on lighter volume. Extended from its latest sound base, its prior highs in the $22 area define support.
>>> The latest Featured Stock Update with an annotated graph appeared on 2/10/2011. Click here.
View all notes |
Alert me of new notes |
CANSLIM.net Company Profile |
SEC |
Zacks Reports |
StockTalk |
News |
Chart |
Request a new note
C
A N
S L
I M
|
UA
-
NYSE
Under Armour Inc Cl A
CONSUMER NON-DURABLES - Textile - Apparel Clothing
|
$67.84
|
+0.31
0.46% |
$68.20
|
390,122
49.29% of 50 DAV
50 DAV is 791,500
|
$70.43
-3.68%
|
1/27/2011
|
$58.31
|
PP = $56.99
|
|
MB = $59.84
|
Most Recent Note - 2/18/2011 5:44:06 PM
G - Quietly hovering near its 52-week high, holding its ground following a recent spurt of gains with above average volume. Prior resistance in the $60 area defines initial support to watch above its 50 DMA line.
>>> The latest Featured Stock Update with an annotated graph appeared on 2/1/2011. Click here.
View all notes |
Alert me of new notes |
CANSLIM.net Company Profile |
SEC |
Zacks Reports |
StockTalk |
News |
Chart |
Request a new note
C
A N
S L
I M
|
ULTA
-
NASDAQ
Ulta Salon Cosm & Frag
SPECIALTY RETAIL - Specialty Retail, Other
|
$43.46
|
+0.14
0.32% |
$44.06
|
441,188
80.91% of 50 DAV
50 DAV is 545,300
|
$43.90
-1.00%
|
1/6/2011
|
$36.12
|
PP = $37.34
|
|
MB = $39.21
|
Most Recent Note - 2/18/2011 5:45:22 PM
G - Inched higher for new all-time highs with small gains on average or light volume in recent weeks. It is extended from a sound base pattern, and prior highs in the $37-38 area define chart support to watch above its 50 DMA line.
>>> The latest Featured Stock Update with an annotated graph appeared on 2/17/2011. Click here.
View all notes |
Alert me of new notes |
CANSLIM.net Company Profile |
SEC |
Zacks Reports |
StockTalk |
News |
Chart |
Request a new note
C
A N
S L
I M
|