You are not logged in.
This means you
CAN ONLY VIEW reports that were published prior to Monday, April 14, 2025.
You
MUST UPGRADE YOUR MEMBERSHIP if you want to see any current reports.
AFTER MARKET UPDATE - MONDAY, FEBRUARY 22ND, 2010
Previous After Market Report Next After Market Report >>>
|
|
|
|
DOW |
-18.97 |
10,383.38 |
-0.18% |
|
Volume |
944,014,460 |
-16% |
|
Volume |
1,971,489,250 |
-8% |
|
NASDAQ |
-1.84 |
2,242.03 |
-0.08% |
|
Advancers |
1,513 |
48% |
|
Advancers |
1,435 |
51% |
|
S&P 500 |
-1.16 |
1,108.01 |
-0.10% |
|
Decliners |
1,535 |
49% |
|
Decliners |
1,271 |
45% |
|
Russell 2000 |
+0.63 |
632.25 |
+0.10% |
|
52 Wk Highs |
213 |
|
|
52 Wk Highs |
134 |
|
|
S&P 600 |
+0.53 |
336.10 |
+0.16% |
|
52 Wk Lows |
4 |
|
|
52 Wk Lows |
9 |
|
|
 |
Major Indices Drift Lower On Lighter Volume
Adam Sarhan, Contributing Writer,
The major indices ended lower as volume totals were lower than Friday's levels on the 11th day of the current rally attempt. Advancers led decliners by a small margin on the Nasdaq exchange, while there was closer to an even mix but a slightly negative bias on the NYSE. New 52-week highs outnumbered new lows on both exchanges and new lows were in the single digits on each exchange. There were 24 high-ranked companies from the CANSLIM.net Leaders List that made a new 52-week high and appeared on the CANSLIM.net BreakOuts Page, lower than the 31 issues that appeared on the prior session.
Stocks did much of nothing on the first trading day of this week even after the latest round of M&A news was released and several high profile earnings announcement topped analyst estimates. Barring some unforeseen event, the average company in the S&P 500 is on track to snap a record nine quarter earnings slump as earnings season slows down. It is important to note that even though over +70% of S&P 500 companies have topped the Street's Q4 estimates, 2010 earnings forecasts have fallen from the beginning of the season. Analysts believe that earnings will grow by +26.3% in 2010 which is down from the +30.6% projected in early January. In addition, the S&P 500 is trading below where it closed when earnings season began in early January.
Turning to the housing front, the latest data shows that the rate of delinquencies and new foreclosures fell in the fourth quarter while a new record was set in the number of home loans which are behind on payments. The Mortgage Bankers Association said that the percentage of loans that were in foreclosure or behind at least one payment surged to +15.02% which is the highest since the MBA's records began in 1972. Many analysts believe that foreclosures will likely stay high for the rest of the year as the economy and the jobs market continue to recover from the worst recession since WWII.
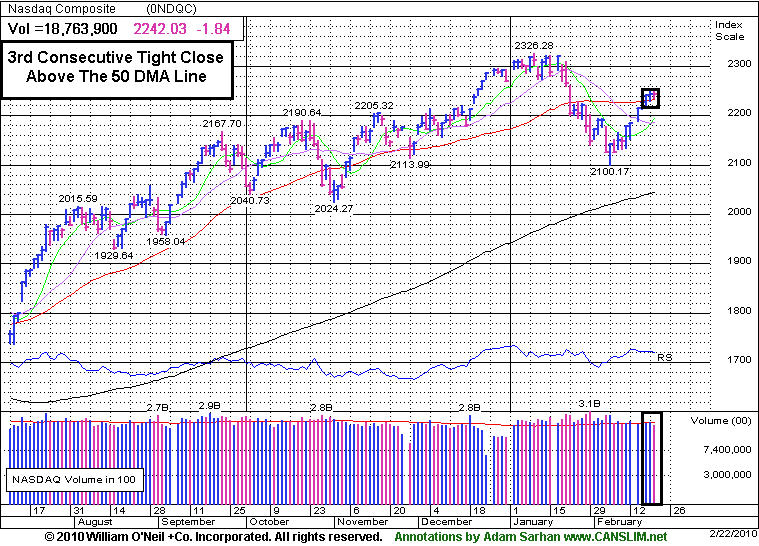
Looking at the market, Monday marked Day 11 of a new rally attempt which means that as long as the February 5th lows are not breached the window remains open for a new follow-through day (FTD) to emerge. A new follow-through day will confirm the current rally attempt and will be produced when one of the major averages rallies at least +1.7% on higher volume than the prior session as a new batch of leaders break out of fresh bases. However, if the February 5, 2010 lows are breached then the day count will be reset and a steeper correction may unfold. So far, the market’s reaction has been tepid at best to the latest round of economic and earnings data which remains a concern. Remember that the market remains in a correction until a new new follow-through day emerges. Until then, patience is paramount.
Professional Money Management Services - A Winning System - Inquire today!
Our skilled team of portfolio managers knows how to follow the rules of this fact-based investment system. We do not follow opinion or the "conviction list" of some large Wall Street institution which would have us fully invested even during horrific bear markets. Instead, we remain fluid and only buy the best stocks when they are triggering proper technical buy signals. If you are not completely satisfied with the way your portfolio is being managed, Click here to get connected with one of our portfolio managers. *Accounts over $250,000 please. ** Serious inquires only, please.
PICTURED: The Nasdaq Composite Index is consolidating above its 50-day moving average (DMA) line on light volume.
|
|
|
 |
Bank Index Rising Near Recovery Highs
Kenneth J. Gruneisen - Passed the CAN SLIM® Master's Exam
The Healthcare Index ($HMO +1.69%) and Biotechnology Index ($BTK +1.01%) posted gains while most other groups failed to make progress. The Broker/Dealer Index ($XBD -0.15%) edged lower and the Retail Index ($RLX +0.00%) ended flat. While the Internet Index ($IIX -0.60%) and Semiconductor Index ($SOX -0.29%) ended modestly lower, the Networking Index ($NWX +0.76%) posted a gain. Commodity-linked groups were laggards as the Gold & Silver Index ($XAU -1.48%), Integrated Oil Index ($XOI -0.90%), and Oil Services Index ($OSX -0.25%) lost ground.
Charts courtesy www.stockcharts.com
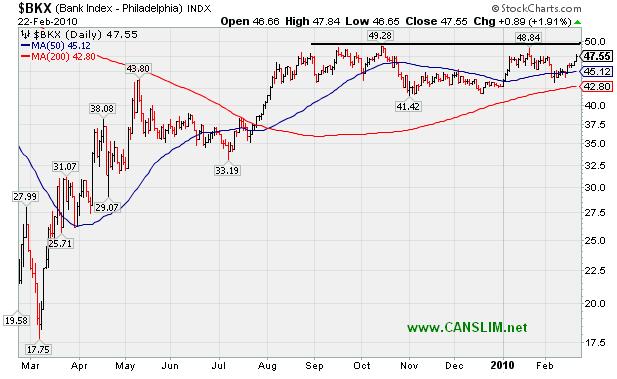
PICTURED: The Bank Index ($BKX +1.91%) posted an encouraging gain to start the week, and recent strength in this influential financial group has helped to underpin the latest rally effort. At Monday's close the BKX was only -3.5% off its recovery high.
| Oil Services |
$OSX |
204.77 |
-0.52 |
-0.25% |
+5.05% |
| Healthcare |
$HMO |
1,410.85 |
+23.39 |
+1.69% |
-4.22% |
| Integrated Oil |
$XOI |
1,034.49 |
-9.43 |
-0.90% |
-3.16% |
| Semiconductor |
$SOX |
342.55 |
-0.99 |
-0.29% |
-4.82% |
| Networking |
$NWX |
238.31 |
+1.80 |
+0.76% |
+3.14% |
| Internet |
$IIX |
229.41 |
-1.39 |
-0.60% |
-1.90% |
| Broker/Dealer |
$XBD |
114.75 |
-0.17 |
-0.15% |
-0.26% |
| Retail |
$RLX |
413.61 |
+0.00 |
+0.00% |
+0.61% |
| Gold & Silver |
$XAU |
162.00 |
-2.44 |
-1.48% |
-3.71% |
| Bank |
$BKX |
47.55 |
+0.89 |
+1.91% |
+11.33% |
| Biotech |
$BTK |
1,035.53 |
+10.33 |
+1.01% |
+9.91% |
|
|
|
 |
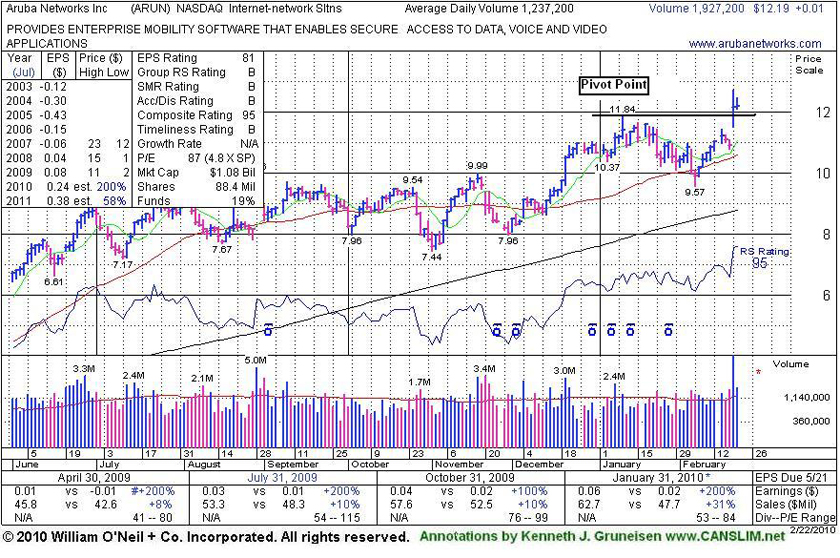
Held Ground After Prior Gap Up With 8 Times Average Volume
Kenneth J. Gruneisen - Passed the CAN SLIM® Master's Exam
Aruba Networks Inc. (ARUN +$0.01 or +0.08% to $12.19) held its ground today. It gapped up 2/19/10 and was featured in the mid-day report (read here) as a considerable gain for a new 52 week high on more than 8 times average volume helped it break out from a flat base-on-base pattern above its 50-day moving average line. A gap up gain with 8 times average volume is an indication of heavy institutional (I criteria) buying demand.
Quarterly earnings increases (excluding items - click here to read about "Q2 Loss" in the Business Journal) have been strong and sales revenues in the latest quarter ended Jan 31, 2010 showed impressive acceleration. The strong technical action was an immediate response to its improving fundamentals. Its current quarterly earnings (C criteria) increases have been above the +25% minimum guideline and earnings in recent years followed prior annual losses.
|
|
|
Color Codes Explained :
Y - Better candidates highlighted by our
staff of experts.
G - Previously featured
in past reports as yellow but may no longer be buyable under the
guidelines.
***Last / Change / Volume quote data in this table corresponds with the timestamp on the note***
Symbol/Exchange
Company Name
Industry Group |
Last |
Chg. |
Vol
% DAV |
Date Featured |
Price Featured |
Latest Pivot Point
Featured |
Status |
| Latest Max Buy Price |
ARST
-
|
$27.10
|
-0.40
|
113,117
27% DAV
416,900
|
12/22/2009
(Date
Featured) |
$25.94
(Price
Featured) |
PP = $27.20 |
G |
| MB = $28.56 |
Most Recent Note - 2/22/2010 4:39:16 PM
G - Second consecutive small loss today on lighter volume after a previous streak 7 consecutive gains. Important support to watch now is its recent low ($22.58) and prior chart lows in the $22 area. ARST was first featured in yellow at $19.91 in the 9/01/09 mid-day report with an annotated daily graph (read here).
>>> The latest Featured Stock Update with an annotated graph appeared on 2/17/2010. click here.
|
|
C
A
S
I |
News |
Chart |
SEC
View all notes Alert
me of new notes
Company
Profile
|
ARUN
- NASDAQ
Aruba Networks Inc
COMPUTER HARDWARE - Networking & Communication Dev
|
$12.19
|
+0.01
|
1,962,939
159% DAV
1,237,200
|
2/19/2010
(Date
Featured) |
$12.71
(Price
Featured) |
PP = $11.94 |
Y |
| MB = $12.54 |
Most Recent Note - 2/22/2010 5:08:47 PM
Y - Held its ground today. Gapped up 2/19/10 and was featured in the mid-day report (read here) as a considerable gain for a new 52 week high on more than 8 times average volume helped it break out from a flat base-on-base pattern above its 50-day moving average line. Quarterly earnings increases (excluding items - click here to read about "Q2 Loss" in the Business Journal) have been strong and sales revenues in the latest quarter ended Jan 31, 2010 showed impressive acceleration. The strong technical action was an immediate response to its improving fundamentals.
>>> The latest Featured Stock Update with an annotated graph appeared on 2/22/2010. click here.
|
|
C
A
S
I |
News |
Chart |
SEC
View all notes Alert
me of new notes
Company
Profile
|
BIDU
- NASDAQ
Baidu Inc Ads
INTERNET - Internet Information Providers
|
$507.15
|
+7.00
|
1,639,230
85% DAV
1,926,700
|
1/13/2010
(Date
Featured) |
$431.25
(Price
Featured) |
PP = $426.75 |
G |
| MB = $448.09 |
Most Recent Note - 2/22/2010 5:10:49 PM
G - Volume was light again behind today's 3rd consecutive gain for a new all-time high. It is getting extended above its mid-January high, and it did not form a recent sound base. Gapped up on 2/10/10 for a considerable gain with volume more than 3 times average.
>>> The latest Featured Stock Update with an annotated graph appeared on 2/11/2010. click here.
|
|
C
A
S
I |
News |
Chart |
SEC
View all notes Alert
me of new notes
Company
Profile
|
BRLI
- NASDAQ
Bio Reference Labs Inc
HEALTH SERVICES - Medical Laboratories & Researc
|
$39.44
|
-0.38
|
64,943
75% DAV
86,800
|
2/12/2010
(Date
Featured) |
$39.02
(Price
Featured) |
PP = $40.97 |
Y |
| MB = $43.02 |
Most Recent Note - 2/22/2010 5:13:01 PM
Y - Quietly perched only -3.5% from its 52-week high, very near its pivot point. Its Up/Down Volume Ratio of 2.3 is a bullish indicator while consolidating for nearly 7-weeks above support at its 50 DMA line. This high-ranked Medical-Dental - Services firm has not triggered a technical buy signal since it was featured in yellow in the 2/12/10 mid-day report (read here). Very little resistance remains due to overhead supply. Earnings growth and sales revenues growth has accelerated, better than the +25% minimum guideline in recent quarters. Fundamentals are favorable with respect to the C and A criteria.
>>> The latest Featured Stock Update with an annotated graph appeared on 2/12/2010. click here.
|
|
C
A
S
I |
News |
Chart |
SEC
View all notes Alert
me of new notes
Company
Profile
|
CACC
- NASDAQ
Credit Acceptance Corp
FINANCIAL SERVICES - Credit Services
|
$40.15
|
-0.21
|
20,175
32% DAV
62,800
|
9/29/2009
(Date
Featured) |
$33.48
(Price
Featured) |
PP = $37.10 |
G |
| MB = $38.96 |
Most Recent Note - 2/22/2010 5:15:18 PM
G - Volume has been drying up while consolidating in a tight trading range for more than a week, holding its ground well above prior chart highs in the $37 area. This Financial firm's outlook is questionable until it trades back above its 50 DMA line.
>>> The latest Featured Stock Update with an annotated graph appeared on 2/9/2010. click here.
|
|
C
A
S
I |
News |
Chart |
SEC
View all notes Alert
me of new notes
Company
Profile
|
CRM
- NYSE
Salesforce.com Inc
INTERNET - Internet Software & Services
|
$69.04
|
+0.12
|
1,280,448
66% DAV
1,935,900
|
12/18/2009
(Date
Featured) |
$67.32
(Price
Featured) |
PP = $67.82 |
G |
| MB = $71.21 |
Most Recent Note - 2/22/2010 5:17:17 PM
G - Today's gain on light volume was its 5th consecutive gain. Its rally back above its 50 DMA line technically helped its outlook. Recent chart low ($60.30 on 2/05/10) is an important support level to watch.
>>> The latest Featured Stock Update with an annotated graph appeared on 2/10/2010. click here.
|
|
C
A
S
I |
News |
Chart |
SEC
View all notes Alert
me of new notes
Company
Profile
|
EZPW
- NASDAQ
Ezcorp Inc Cl A
SPECIALTY RETAIL - Specialty Retail, Other
|
$19.60
|
+0.92
|
835,126
201% DAV
415,800
|
2/19/2010
(Date
Featured) |
$19.03
(Price
Featured) |
PP = $18.80 |
Y |
| MB = $19.74 |
Most Recent Note - 2/22/2010 5:26:15 PM
Y - Considerable gain today with twice average volume helped it rally to a new 52-week high, triggering a technical buy signal while closing near its "max buy" level noted when featured in yellow in the 2/19/10 mid-day report (read here). This previously featured Finance - Consumer/Commercial Loans firm was dropped from the Featured Stocks list on 10/09/08, yet it continued to show solid growth (solid fundamentals). Earnings per share increases have shown acceleration along with greater than +25% sales revenues increases in the latest quarterly comparisons (good C criteria) versus the year earlier, and a great annual earnings history (good A criteria).
>>> The latest Featured Stock Update with an annotated graph appeared on 2/19/2010. click here.
|
|
C
A
S
I |
News |
Chart |
SEC
View all notes Alert
me of new notes
Company
Profile
|
GMCR
- NASDAQ
Green Mtn Coffee Roastrs
FOOD & BEVERAGE - Processed & Packaged Goods
|
$82.60
|
-0.81
|
635,897
44% DAV
1,455,900
|
12/28/2009
(Date
Featured) |
$77.49
(Price
Featured) |
PP = $76.50 |
G |
| MB = $80.33 |
Most Recent Note - 2/22/2010 5:30:40 PM
G - High-ranked leader continues consolidating in a very tight trading range with volume drying up, base building above its 50 DMA line and within close striking range of its 52-week high. Important initial support level to watch is recent lows in the $78 area.
>>> The latest Featured Stock Update with an annotated graph appeared on 2/2/2010. click here.
|
|
C
A
S
I |
News |
Chart |
SEC
View all notes Alert
me of new notes
Company
Profile
|
ISRG
- NASDAQ
Intuitive Surgical Inc
HEALTH SERVICES - Medical Appliances & Equipment
|
$346.99
|
+0.47
|
383,362
74% DAV
519,400
|
1/22/2010
(Date
Featured) |
$340.40
(Price
Featured) |
PP = $314.00 |
G |
| MB = $329.70 |
Most Recent Note - 2/22/2010 5:32:59 PM
G - Hovering at its 52-week high today while posting a 7th consecutive gain. Its 50 DMA line and recent chart lows in the $315 area define important technical support. ISRG was featured again most recently in the 1/22/10 mid-day report (read here).
>>> The latest Featured Stock Update with an annotated graph appeared on 2/5/2010. click here.
|
|
C
A
S
I |
News |
Chart |
SEC
View all notes Alert
me of new notes
Company
Profile
|
PCLN
- NASDAQ
Priceline.com Inc
INTERNET - Internet Software & Services
|
$399.55
|
-4.72
|
584,812
N/A
|
11/1/2002
(Date
Featured) |
$399.55
(Price
Featured) |
PP = $428.20 |
Y |
| MB = $449.61 |
Most Recent Note - 1/2/2011
Y - Returns to Featured Stocks list with its appearance in the January 2011 CANSLIM.net News including detailed analysis and annotated daily and weekly graphs.
>>> The latest Featured Stock Update with an annotated graph appeared on 2/18/2010. click here.
|
|
C
A
S
I |
News |
Chart |
SEC
View all notes Alert
me of new notes
Company
Profile
|
PEGA
- NASDAQ
Pegasystems Inc
COMPUTER SOFTWARE & SERVICES - Business Software & Services
|
$36.43
|
-0.60
|
246,025
127% DAV
194,100
|
1/4/2010
(Date
Featured) |
$34.00
(Price
Featured) |
PP = $36.19 |
G |
| MB = $38.00 |
Most Recent Note - 2/22/2010 5:50:47 PM
G - Negative reversal for a loss on higher volume, after a gap up today, indicated distributional pressure. Its 50 DMA line and prior chart lows near $32 define near-term support to watch.
>>> The latest Featured Stock Update with an annotated graph appeared on 2/8/2010. click here.
|
|
C
A
S
I |
News |
Chart |
SEC
View all notes Alert
me of new notes
Company
Profile
|
SIRO
- NASDAQ
Sirona Dental Systems
HEALTH SERVICES - Medical Instruments & Supplies
|
$36.33
|
+0.58
|
978,732
173% DAV
566,000
|
2/16/2010
(Date
Featured) |
$36.43
(Price
Featured) |
PP = $36.15 |
Y |
| MB = $37.96 |
Most Recent Note - 2/22/2010 5:52:52 PM
Y - Gain on above average volume today for its second highest close of the year. Last week it priced a secondary offering of shares from which the company will not receive any proceeds. It was featured in yellow in the 2/16/10 mid-day report (read here) as it broke out from a 10-week flat base. Fundamentally, following 3 negative comparisons, its sales revenues in the Sep and Dec '09 quarters showed a return to growth. Quarterly earnings increases have been very strong along with great annual earnings growth in recent years (good C and A criteria). This high-ranked Medical - Systems/Equipment firm had previously completed Secondary Offerings on 8/06/09 and 12/11/09.
>>> The latest Featured Stock Update with an annotated graph appeared on 2/16/2010. click here.
|
|
C
A
S
I |
News |
Chart |
SEC
View all notes Alert
me of new notes
Company
Profile
|
|
|
|
THESE ARE NOT BUY RECOMMENDATIONS!
Comments contained in the body of this report are technical
opinions only. The material herein has been obtained
from sources believed to be reliable and accurate, however,
its accuracy and completeness cannot be guaranteed.
This site is not an investment advisor, hence it does
not endorse or recommend any securities or other investments.
Any recommendation contained in this report may not
be suitable for all investors and it is not to be deemed
an offer or solicitation on our part with respect to
the purchase or sale of any securities. All trademarks,
service marks and trade names appearing in this report
are the property of their respective owners, and are
likewise used for identification purposes only.
This report is a service available
only to active Paid Premium Members.
You may opt-out of receiving report notifications
at any time. Questions or comments may be submitted
by writing to Premium Membership Services 665 S.E. 10 Street, Suite 201 Deerfield Beach, FL 33441-5634 or by calling 1-800-965-8307
or 954-785-1121.
|
|
|


