You are not logged in.
This means you
CAN ONLY VIEW reports that were published prior to Tuesday, April 8, 2025.
You
MUST UPGRADE YOUR MEMBERSHIP if you want to see any current reports.
AFTER MARKET UPDATE - FRIDAY, FEBRUARY 19TH, 2010
Previous After Market Report Next After Market Report >>>
|
|
|
|
DOW |
+9.45 |
10,402.35 |
+0.09% |
|
Volume |
1,120,896,870 |
+17% |
|
Volume |
2,139,456,150 |
+2% |
|
NASDAQ |
+2.16 |
2,243.87 |
+0.10% |
|
Advancers |
1,790 |
57% |
|
Advancers |
1,409 |
50% |
|
S&P 500 |
+2.42 |
1,109.17 |
+0.22% |
|
Decliners |
1,229 |
39% |
|
Decliners |
1,252 |
45% |
|
Russell 2000 |
+2.30 |
631.62 |
+0.37% |
|
52 Wk Highs |
193 |
|
|
52 Wk Highs |
131 |
|
|
S&P 600 |
+1.65 |
335.57 |
+0.49% |
|
52 Wk Lows |
1 |
|
|
52 Wk Lows |
9 |
|
|
 |
Major Indices End Week Above Their 50-Day Moving Averages
Adam Sarhan, Contributing Writer,
Stocks rallied on this holiday-shortened week as investors digested a slew of economic and earnings news. The fact that all three of the major averages ended the week back above their respective 50-day moving average lines helped the market's technical stance improve meaningfully. Volume on Friday, the 10th day of the current rally attempt, was reported higher than the prior session totals on the Nasdaq exchange and on the NYSE. However, the gains were not substantial enough percentage-wise to meet the definition of a follow-through-day. Advancers led decliners by a 3-to-2 ratio on the NYSE, but they only led narrowly on the Nasdaq exchange. New 52-week highs outnumbered new lows on both exchanges and new lows were in the single digits. There were 31 high-ranked companies from the CANSLIM.net Leaders List that made a new 52-week high and appeared on the CANSLIM.net BreakOuts Page, up from 21 issues that appeared on the prior session.

On Tuesday, stocks rallied after the NY Fed released its Empire State Manufacturing Index which topped the Street's estimates. This was the fastest reading in four years and the first manufacturing report that was released in February. The stronger than expected results suggest that business conditions are improving which bodes well for the economic recovery. Stocks edged higher on Wednesday after the Federal Reserve released the minutes of last month's Fed meeting. The minutes showed that Fed officials debated how and when to shrink the central bank’s $2.26 trillion balance sheet. The minutes also showed that some officials want to begin selling assets in the “near future” while others are more content to wait until the economy stabilizes.
Fed Unexpectedly Raises Rates From +0.50% to +0.75%:
The big surprise occurred on Thursday when the Federal Reserve unexpectedly raised its discount rate, the interest rate it charges banks for emergency loans, from +0.50% to +0.75%. The Fed said that "The modifications are not expected to lead to tighter financial conditions for households and businesses and do not signal any change in the outlook for the economy or for monetary policy." Two disconcerting economic reports were released on Thursday: jobless claims surged and producer prices topped estimates. The Labor Department said the number of US workers filing new applications for unemployment benefits unexpectedly jumped last week. Initial jobless claims for state unemployment benefits rose +31,000 to +473,000 which paled in comparison to the Street’s estimate of +430,000. Elsewhere, producer prices rose sharply last month which suggests inflation is on the rise. The producer price index topped estimates and rose +1.4% from December. Economists believe that higher energy prices and unusually cold temperatures sent prices higher last month.
On Friday, the Labor Department released its consumer prices index (CPI) which rose in January but trailed estimates. Core prices which measure food and energy fell for the first time since 1982 which helped allay inflation woes. Looking at the market, Friday marked Day 10 of a new rally attempt which means that as long as the February 5th lows are not breached the window remains open for a new follow-through day (FTD) to emerge. A new follow-through day will confirm the current rally attempt and will be produced when one of the major averages rallies at least +1.7% on higher volume than the prior session as a new batch of leaders break out of fresh bases. However, if the February 5, 2010 lows are breached then the day count will be reset and a steeper correction may unfold. So far, the market’s reaction has been tepid at best to the latest round of economic and earnings data which remains a concern. Remember that the market remains in a correction until a new new follow-through day emerges. Until then, patience is paramount.
Professional Money Management Services - A Winning System - Inquire today!
Our skilled team of portfolio managers knows how to follow the rules of this fact-based investment system. We do not follow opinion or the "conviction list" of some large Wall Street institution which would have us fully invested even during horrific bear markets. Instead, we remain fluid and only buy the best stocks when they are triggering proper technical buy signals. If you are not completely satisfied with the way your portfolio is being managed, Click here to get connected with one of our portfolio managers. *Accounts over $250,000 please. ** Serious inquires only, please.
PICTURED: The S&P 600 Small-Cap Index has a current winning streak of 8 consecutive gains on near average volume, rising above its 50-day moving average (DMA) line to within -2.4% of its recovery high. Healthier action in small-cap shares is an especially encouraging sign for fans of this fact-based investment system.
|
|
|
 |
Financial Shares Among Friday's Positive Influences
Kenneth J. Gruneisen - Passed the CAN SLIM® Master's Exam
Financial shares had a positive influence on the major averages as the Broker/Dealer Index ($XBD +1.03%) and Bank Index ($BKX +1.28%) were among Friday's standout gainers. The Oil Services Index ($OSX +1.50%) posted a solid gain, meanwhile the Integrated Oil Index ($XOI +0.04%) was unchanged and the Gold & Silver Index ($XAU -0.51%) and Healthcare Index ($HMO -0.63%) closed modestly lower. The tech sector was led higher by the Networking Index ($NWX +1.23%), Internet Index ($IIX +0.72%), and Semiconductor Index ($SOX +0.30%), but the Biotechnology Index ($BTK -0.06%) ended essentially flat. The Retail Index ($RLX +0.21%) tacked on its 6th consecutive small gain.
Charts courtesy www.stockcharts.com

PICTURED: The Retail Index ($RLX +0.21%) posted a 6th consecutive gain, rising well above its 50-day moving average (DMA) line.
| Oil Services |
$OSX |
205.29 |
+3.04 |
+1.50% |
+5.32% |
| Healthcare |
$HMO |
1,387.46 |
-8.84 |
-0.63% |
-5.80% |
| Integrated Oil |
$XOI |
1,043.92 |
+0.41 |
+0.04% |
-2.27% |
| Semiconductor |
$SOX |
343.54 |
+1.02 |
+0.30% |
-4.55% |
| Networking |
$NWX |
236.51 |
+2.88 |
+1.23% |
+2.36% |
| Internet |
$IIX |
230.80 |
+1.65 |
+0.72% |
-1.31% |
| Broker/Dealer |
$XBD |
114.92 |
+1.17 |
+1.03% |
-0.11% |
| Retail |
$RLX |
413.61 |
+0.85 |
+0.21% |
+0.61% |
| Gold & Silver |
$XAU |
164.44 |
-0.85 |
-0.51% |
-2.26% |
| Bank |
$BKX |
46.66 |
+0.59 |
+1.28% |
+9.25% |
| Biotech |
$BTK |
1,025.20 |
-0.63 |
-0.06% |
+8.82% |
|
|
|
 |
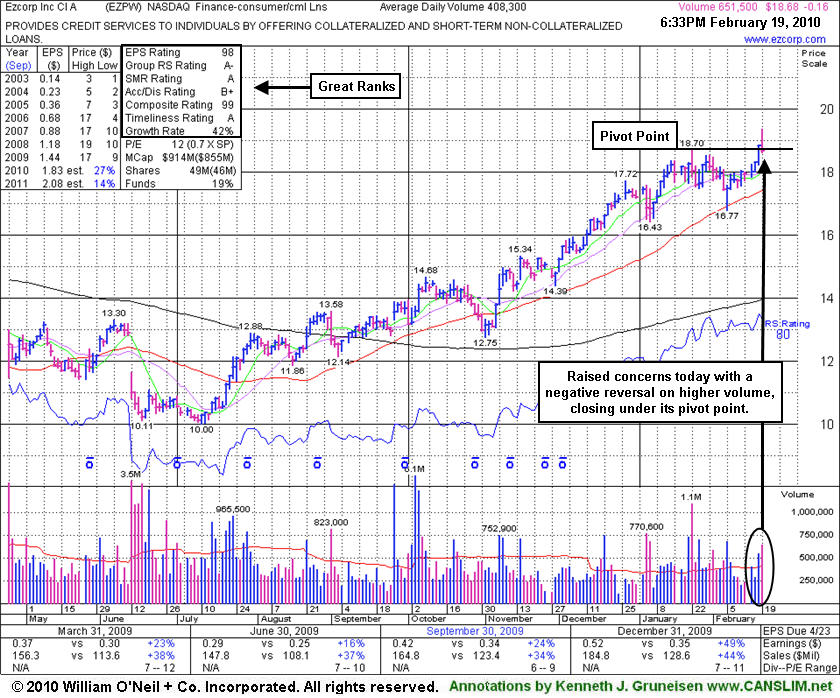
Negative Reversal Indicated Distributional Pressure
Kenneth J. Gruneisen - Passed the CAN SLIM® Master's Exam
EZCORP Inc (EZPW -$0.16 or -0.85% to $18.68) negatively reversed today and closed near the session low after initially getting off to a strong start on the session. It was featured in yellow with new pivot point and may buy levels noted in today's mid-day report (read here). As noted, "To trigger a proper technical buy signal the volume total must be +50% above average or greater while a stock rises above its pivot point to new highs." Its prior gain for a new high close had only about +35% above average volume.
Its failure to hold its gains through the session close suggests that it encountered prompt distributional pressure when attempting to rally into new high territory. Confirming gains could help reassure investors, meanwhile a follow-through-day from at least one of the major averages is also needed before the investment system's M criteria is met. Note that it managed to top its 2008 all-time high this week, leaving no resistance remaining due to overhead supply.
This previously featured Finance - Consumer/Commercial Loans firm was dropped from the Featured Stocks list on 10/09/08, yet it continued to show strong sales and earnings growth (solid fundamentals). Earnings per share increases have shown acceleration along with greater than +25% sales revenues increases in the latest quarterly comparisons (good C criteria) versus the year earlier, and a great annual earnings history (good A criteria).
|
|
|
Color Codes Explained :
Y - Better candidates highlighted by our
staff of experts.
G - Previously featured
in past reports as yellow but may no longer be buyable under the
guidelines.
***Last / Change / Volume quote data in this table corresponds with the timestamp on the note***
Symbol/Exchange
Company Name
Industry Group |
Last |
Chg. |
Vol
% DAV |
Date Featured |
Price Featured |
Latest Pivot Point
Featured |
Status |
| Latest Max Buy Price |
ARST
-
|
$27.50
|
-0.39
|
216,063
51% DAV
424,000
|
12/22/2009
(Date
Featured) |
$25.94
(Price
Featured) |
PP = $27.20 |
G |
| MB = $28.56 |
Most Recent Note - 2/19/2010 4:49:52 PM
G - Small loss today on light volume after 7 consecutive gains. Important support to watch now is its recent low ($22.58) and prior chart lows in the $22 area. ARST was first featured in yellow at $19.91 in the 9/01/09 mid-day report with an annotated daily graph (read here).
>>> The latest Featured Stock Update with an annotated graph appeared on 2/17/2010. click here.
|
|
C
A
S
I |
News |
Chart |
SEC
View all notes Alert
me of new notes
Company
Profile
|
ARUN
- NASDAQ
Aruba Networks Inc
COMPUTER HARDWARE - Networking & Communication Dev
|
$12.18
|
+1.27
|
9,161,236
857% DAV
1,068,600
|
2/19/2010
(Date
Featured) |
$12.71
(Price
Featured) |
PP = $11.94 |
Y |
| MB = $12.54 |
Most Recent Note - 2/19/2010 4:55:19 PM
Y - Gapped up today and was featured in the mid-day report (read here) as a considerable gain for a new 52 week high on more than 8 times average volume helped it break out from a flat base-on-base pattern above its 50-day moving average line. Quarterly earnings increases (excluding items - click here to read about "Q2 Loss" in the Business Journal) have been strong and sales revenues in the latest quarter ended Jan 31, 2010 showed impressive acceleration. The strong technical action is an immediate response to its improving fundamentals.
There are no Featured Stock Updates™ available for this stock at this time. You may request one by clicking here
|
|
C
A
S
I |
News |
Chart |
SEC
View all notes Alert
me of new notes
Company
Profile
|
BIDU
- NASDAQ
Baidu Inc Ads
INTERNET - Internet Information Providers
|
$500.15
|
+2.55
|
1,134,355
59% DAV
1,929,200
|
1/13/2010
(Date
Featured) |
$431.25
(Price
Featured) |
PP = $426.75 |
G |
| MB = $448.09 |
Most Recent Note - 2/19/2010 5:00:31 PM
G - Volume was light again behind today's gain for a new all-time high. It is only about +6% above its mid-January high, but it did not form a sound base. Gapped up on 2/10/10 for a considerable gain with volume more than 3 times average.
>>> The latest Featured Stock Update with an annotated graph appeared on 2/11/2010. click here.
|
|
C
A
S
I |
News |
Chart |
SEC
View all notes Alert
me of new notes
Company
Profile
|
BRLI
- NASDAQ
Bio Reference Labs Inc
HEALTH SERVICES - Medical Laboratories & Researc
|
$39.82
|
+0.02
|
101,796
119% DAV
85,700
|
2/12/2010
(Date
Featured) |
$39.02
(Price
Featured) |
PP = $40.97 |
Y |
| MB = $43.02 |
Most Recent Note - 2/19/2010 5:15:29 PM
Y - Quietly perched only -3% from its 52-week high, very near its pivot point. Consolidating for nearly 7-weeks above support at its 50 DMA line, this high-ranked Medical-Dental - Services firm has not triggered a technical buy signal since it was featured in yellow in the 2/12/10 mid-day report (read here). Very little resistance remains due to overhead supply. Earnings growth and sales revenues growth has accelerated, better than the +25% minimum guideline in recent quarters. Fundamentals are favorable with respect to the C and A criteria.
>>> The latest Featured Stock Update with an annotated graph appeared on 2/12/2010. click here.
|
|
C
A
S
I |
News |
Chart |
SEC
View all notes Alert
me of new notes
Company
Profile
|
CACC
- NASDAQ
Credit Acceptance Corp
FINANCIAL SERVICES - Credit Services
|
$40.36
|
-0.17
|
22,644
36% DAV
63,000
|
9/29/2009
(Date
Featured) |
$33.48
(Price
Featured) |
PP = $37.10 |
G |
| MB = $38.96 |
Most Recent Note - 2/19/2010 5:16:56 PM
G - It has been quietly consolidating in a tight trading range for more than a week, holding its ground well above prior chart highs in the $37 area. This Financial firm's outlook is questionable until it trades back above its 50 DMA line.
>>> The latest Featured Stock Update with an annotated graph appeared on 2/9/2010. click here.
|
|
C
A
S
I |
News |
Chart |
SEC
View all notes Alert
me of new notes
Company
Profile
|
CRM
- NYSE
Salesforce.com Inc
INTERNET - Internet Software & Services
|
$68.92
|
+0.47
|
1,799,034
94% DAV
1,918,200
|
12/18/2009
(Date
Featured) |
$67.32
(Price
Featured) |
PP = $67.82 |
G |
| MB = $71.21 |
Most Recent Note - 2/19/2010 5:18:57 PM
G - Gains this week with light or average volume helped it rally back above its 50 DMA line for the first time since 1/20/10, technically helping its outlook improve. Recent chart low ($60.30 on 2/05/10) is an important support level to watch.
>>> The latest Featured Stock Update with an annotated graph appeared on 2/10/2010. click here.
|
|
C
A
S
I |
News |
Chart |
SEC
View all notes Alert
me of new notes
Company
Profile
|
EZPW
- NASDAQ
Ezcorp Inc Cl A
SPECIALTY RETAIL - Specialty Retail, Other
|
$18.68
|
-0.16
|
661,494
162% DAV
408,300
|
2/19/2010
(Date
Featured) |
$19.03
(Price
Featured) |
PP = $18.80 |
Y |
| MB = $19.74 |
Most Recent Note - 2/19/2010 5:23:48 PM
Y - Hit a new 52-week high today, then negatively reversed and closed near the session low. Color code was changed to yellow with new pivot point and may buy levels noted in today's mid-day report (read here). To trigger a proper technical buy signal the volume total must be +50% above average or greater while a stock rises above its pivot point to new highs. This previously featured Finance - Consumer/Commercial Loans firm was dropped from the Featured Stocks list on 10/09/08, yet it continued to show solid growth (solid fundamentals). Earnings per share increases have shown acceleration along with greater than +25% sales revenues increases in the latest quarterly comparisons (good C criteria) versus the year earlier, and a great annual earnings history (good A criteria).
>>> The latest Featured Stock Update with an annotated graph appeared on 2/19/2010. click here.
|
|
C
A
S
I |
News |
Chart |
SEC
View all notes Alert
me of new notes
Company
Profile
|
GMCR
- NASDAQ
Green Mtn Coffee Roastrs
FOOD & BEVERAGE - Processed & Packaged Goods
|
$83.41
|
-0.08
|
596,506
41% DAV
1,465,200
|
12/28/2009
(Date
Featured) |
$77.49
(Price
Featured) |
PP = $76.50 |
G |
| MB = $80.33 |
Most Recent Note - 2/19/2010 5:29:08 PM
G - Still consolidating in a very tight trading range with volume drying up, base building above its 50 DMA line and within close striking range of its 52-week high. Important initial support level to watch is recent lows in the $78 area.
>>> The latest Featured Stock Update with an annotated graph appeared on 2/2/2010. click here.
|
|
C
A
S
I |
News |
Chart |
SEC
View all notes Alert
me of new notes
Company
Profile
|
ISRG
- NASDAQ
Intuitive Surgical Inc
HEALTH SERVICES - Medical Appliances & Equipment
|
$346.52
|
+1.77
|
605,457
118% DAV
513,300
|
1/22/2010
(Date
Featured) |
$340.40
(Price
Featured) |
PP = $314.00 |
G |
| MB = $329.70 |
Most Recent Note - 2/19/2010 5:30:49 PM
G - Hit a new 52-week high today with a 6th consecutive gain. Its 50 DMA line and recent chart lows in the $315 area define important technical support. ISRG was featured again most recently in the 1/22/10 mid-day report (read here).
>>> The latest Featured Stock Update with an annotated graph appeared on 2/5/2010. click here.
|
|
C
A
S
I |
News |
Chart |
SEC
View all notes Alert
me of new notes
Company
Profile
|
PCLN
- NASDAQ
Priceline.com Inc
INTERNET - Internet Software & Services
|
$399.55
|
-4.72
|
584,812
N/A
|
11/1/2002
(Date
Featured) |
$399.55
(Price
Featured) |
PP = $428.20 |
Y |
| MB = $449.61 |
Most Recent Note - 1/2/2011
Y - Returns to Featured Stocks list with its appearance in the January 2011 CANSLIM.net News including detailed analysis and annotated daily and weekly graphs.
>>> The latest Featured Stock Update with an annotated graph appeared on 2/18/2010. click here.
|
|
C
A
S
I |
News |
Chart |
SEC
View all notes Alert
me of new notes
Company
Profile
|
PEGA
- NASDAQ
Pegasystems Inc
COMPUTER SOFTWARE & SERVICES - Business Software & Services
|
$37.03
|
+0.07
|
154,743
80% DAV
193,000
|
1/4/2010
(Date
Featured) |
$34.00
(Price
Featured) |
PP = $36.19 |
G |
| MB = $38.00 |
Most Recent Note - 2/19/2010 5:34:46 PM
G - Gain today on light volume for its 2nd highest close ever. Wedging higher quietly up from the $35-36 area that was a previously a stubborn resistance level. Its 50 DMA line and prior chart lows near $32 define near-term support to watch.
>>> The latest Featured Stock Update with an annotated graph appeared on 2/8/2010. click here.
|
|
C
A
S
I |
News |
Chart |
SEC
View all notes Alert
me of new notes
Company
Profile
|
SIRO
- NASDAQ
Sirona Dental Systems
HEALTH SERVICES - Medical Instruments & Supplies
|
$35.75
|
+0.83
|
1,057,843
189% DAV
560,400
|
2/16/2010
(Date
Featured) |
$36.43
(Price
Featured) |
PP = $36.15 |
Y |
| MB = $37.96 |
Most Recent Note - 2/19/2010 5:36:04 PM
Y - Gain today for its second best close ever. This week it priced a secondary offering of shares from which the company will not receive any proceeds. It was featured in yellow in the 2/16/10 mid-day report (read here) as it broke out from a 10-week flat base. Fundamentally, following 3 negative comparisons, its sales revenues in the Sep and Dec '09 quarters showed a return to growth. Quarterly earnings increases have been very strong along with great annual earnings growth in recent years (good C and A criteria). This high-ranked Medical - Systems/Equipment firm had previously completed Secondary Offerings on 8/06/09 and 12/11/09.
>>> The latest Featured Stock Update with an annotated graph appeared on 2/16/2010. click here.
|
|
C
A
S
I |
News |
Chart |
SEC
View all notes Alert
me of new notes
Company
Profile
|
|
|
|
THESE ARE NOT BUY RECOMMENDATIONS!
Comments contained in the body of this report are technical
opinions only. The material herein has been obtained
from sources believed to be reliable and accurate, however,
its accuracy and completeness cannot be guaranteed.
This site is not an investment advisor, hence it does
not endorse or recommend any securities or other investments.
Any recommendation contained in this report may not
be suitable for all investors and it is not to be deemed
an offer or solicitation on our part with respect to
the purchase or sale of any securities. All trademarks,
service marks and trade names appearing in this report
are the property of their respective owners, and are
likewise used for identification purposes only.
This report is a service available
only to active Paid Premium Members.
You may opt-out of receiving report notifications
at any time. Questions or comments may be submitted
by writing to Premium Membership Services 665 S.E. 10 Street, Suite 201 Deerfield Beach, FL 33441-5634 or by calling 1-800-965-8307
or 954-785-1121.
|
|
|


