You are not logged in.
This means you
CAN ONLY VIEW reports that were published prior to Tuesday, April 1, 2025.
You
MUST UPGRADE YOUR MEMBERSHIP if you want to see any current reports.
AFTER MARKET UPDATE - THURSDAY, FEBRUARY 18TH, 2010
Previous After Market Report Next After Market Report >>>
|
|
|
|
DOW |
+83.66 |
10,392.90 |
+0.81% |
|
Volume |
960,398,720 |
-6% |
|
Volume |
2,091,005,220 |
-0% |
|
NASDAQ |
+15.42 |
2,241.71 |
+0.69% |
|
Advancers |
2,105 |
67% |
|
Advancers |
1,566 |
56% |
|
S&P 500 |
+7.24 |
1,106.75 |
+0.66% |
|
Decliners |
930 |
30% |
|
Decliners |
1,089 |
39% |
|
Russell 2000 |
+4.49 |
629.32 |
+0.72% |
|
52 Wk Highs |
177 |
|
|
52 Wk Highs |
93 |
|
|
S&P 600 |
+2.91 |
333.92 |
+0.88% |
|
52 Wk Lows |
1 |
|
|
52 Wk Lows |
7 |
|
|
 |
Indices Add To Streak Of Small Gains Without Great Volume
Adam Sarhan, Contributing Writer,
Investors digested a slew of economic and earnings news on the 9th day of the current rally attempt. Volume, a critical indicator of institutional sponsorship, was near the prior session total on the Nasdaq exchange and lighter on the NYSE compared to the prior session. Advancers led decliners by a 2-to-1 ratio on the NYSE and by a 3-to-2 ratio on the Nasdaq exchange. New 52-week highs outnumbered new lows on both exchanges and new lows were in the single digits. There were 21 high-ranked companies from the CANSLIM.net Leaders List that made a new 52-week high and appeared on the CANSLIM.net BreakOuts Page, down from the 27 issues that appeared on the prior session.
The earnings and economic news of the day sent mixed economic signals to investors. Retail giant Wal-Mart (WMT -1.09%) gapped down and sliced below its 50-day moving average (DMA) line after reporting tepid Q4 results. Earnings rose +9% and sales rose +1% vs. the same period in the prior year. While an improvement from the first three quarters of 2009, analysts were expecting better results. Barring some unforeseen event, the average company in the benchmark S&P 500 grew its earnings close to +70% last quarter which snapped a record nine quarter losing streak.
The news on the economic front was lackluster at best. The Labor Department said the number of US workers filing new applications for unemployment benefits unexpectedly jumped last week. Initial jobless claims for state unemployment benefits rose +31,000 to +473,000 which paled in comparison to the Street's estimate of +430,000. Elsewhere, producer prices rose sharply last month which suggests inflation is on the rise. The producer price index topped estimates and rose +1.4% from December. Economists believe that higher energy prices and unusually cold temperatures sent prices higher.
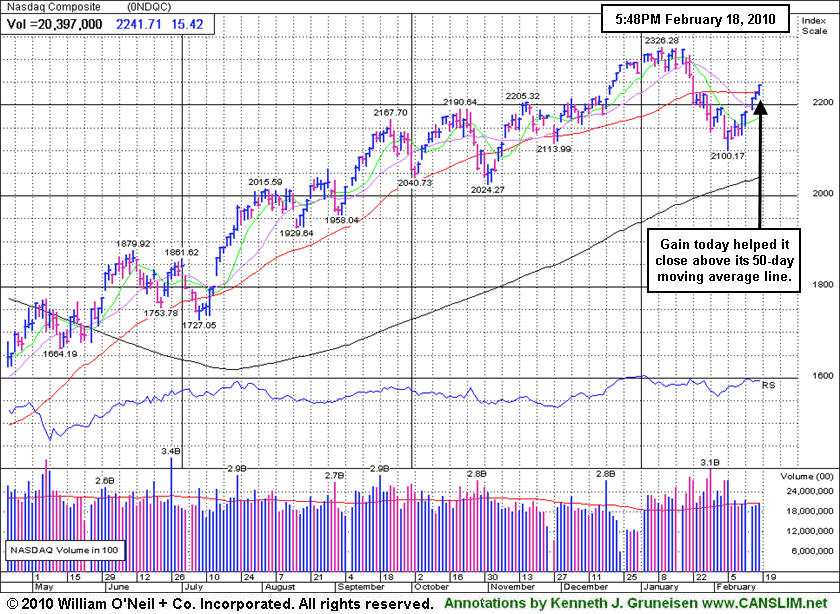
Looking at the market, the Nasdaq Composite Index and Dow Jones Industrial Average managed to close above their respective 50 DMA lines, marking a welcome improvement in the market's technical stance. The benchmark S&P 500 index finished just below its short-term average. As long as the February 5th lows are not breached the window remains open for a new follow-through day (FTD) to emerge. A new follow-through day will confirm the current rally attempt and will be produced when one of the major averages rallies at least +1.7% on higher volume than the prior session as a new batch of leaders hits new highs. However, if the February 5, 2010 lows are breached then the day count will be reset and a steeper correction may unfold.
So far, the market’s reaction has been tepid at best to the latest round of economic and earnings data which remains a concern. Remember that the market remains in a correction until a new new follow-through day emerges. Until then, patience is paramount.
Professional Money Management Services - A Winning System - Inquire today!
Our skilled team of portfolio managers knows how to follow the rules of this fact-based investment system. We do not follow opinion or the "conviction list" of some large Wall Street institution which would have us fully invested even during horrific bear markets. Instead, we remain fluid and only buy the best stocks when they are triggering proper technical buy signals. If you are not completely satisfied with the way your portfolio is being managed, Click here to get connected with one of our portfolio managers. *Accounts over $250,000 please. ** Serious inquires only, please.
PICTURED: The Nasdaq Composite Index's gain helped it close above its 50 DMA line, a technical improvement helping the overall market outlook.
|
|
|
 |
Commodity, Technology, and Retail Groups Post Gains
Kenneth J. Gruneisen - Passed the CAN SLIM® Master's Exam
Commodity-linked groups, technology, and retail related shares were among Thursday's groups having a positive influence on the major averages. The Gold & Silver Index ($XAU +1.42%) outpaced the Oil Services Index ($OSX +0.94%) and Integrated Oil Index ($XOI +0.66%). There was a modest gain from the Retail Index ($RLX +0.76%) and smaller gains from the Bank Index ($BKX +0.17%) and Broker/Dealer Index ($XBD +0.26%). The Networking Index ($NWX +1.24%) and Internet Index ($IIX +1.25%) led the tech sector, followed by a smaller gain from the Semiconductor Index ($SOX +0.29%). The Biotechnology Index ($BTK +0.09%) ended barely higher while the Healthcare Index ($HMO -1.59%) was a standout laggard.
Charts courtesy www.stockcharts.com
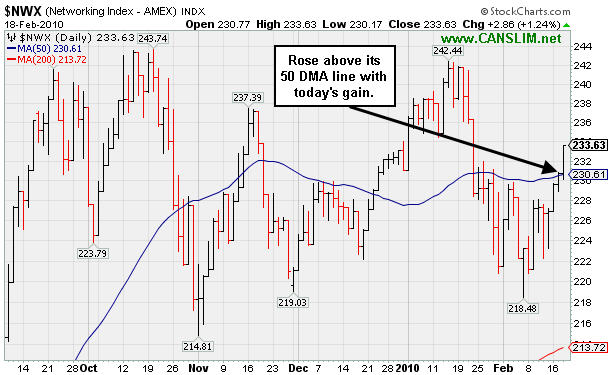
PICTURED: The Networking Index ($NWX +1.24%) rose back above its 50-day moving average (DMA) line with today's gain.
| Oil Services |
$OSX |
202.25 |
+1.88 |
+0.94% |
+3.76% |
| Healthcare |
$HMO |
1,396.30 |
-22.50 |
-1.59% |
-5.20% |
| Integrated Oil |
$XOI |
1,043.51 |
+6.87 |
+0.66% |
-2.31% |
| Semiconductor |
$SOX |
342.52 |
+0.98 |
+0.29% |
-4.83% |
| Networking |
$NWX |
233.63 |
+2.86 |
+1.24% |
+1.11% |
| Internet |
$IIX |
229.15 |
+2.83 |
+1.25% |
-2.01% |
| Broker/Dealer |
$XBD |
113.75 |
+0.29 |
+0.26% |
-1.13% |
| Retail |
$RLX |
412.76 |
+3.12 |
+0.76% |
+0.40% |
| Gold & Silver |
$XAU |
165.29 |
+2.32 |
+1.42% |
-1.76% |
| Bank |
$BKX |
46.07 |
+0.08 |
+0.17% |
+7.87% |
| Biotech |
$BTK |
1,025.83 |
+0.93 |
+0.09% |
+8.88% |
|
|
|
 |
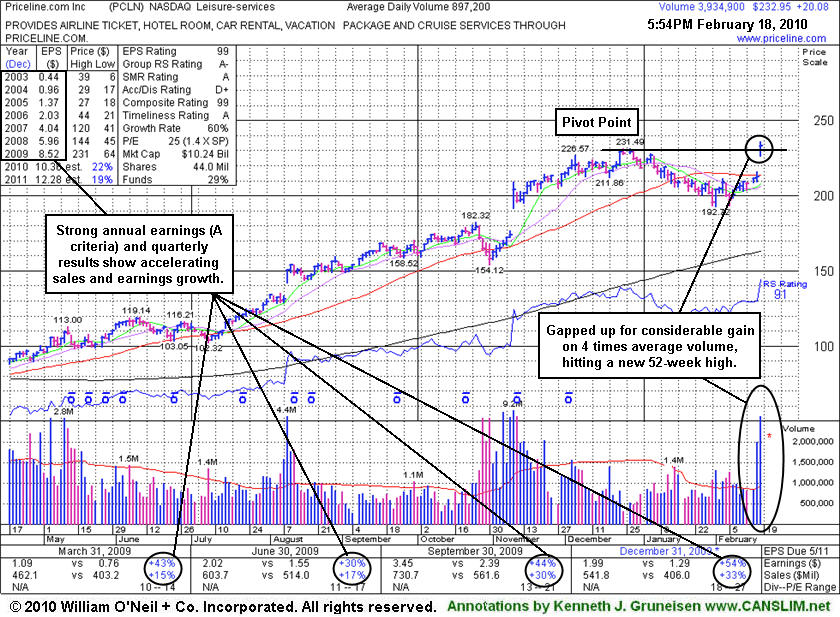
Big Gap Up Gain On 4 Times Average Volume
Kenneth J. Gruneisen - Passed the CAN SLIM® Master's Exam
Priceline.com Inc. (PCLN +$20.08 or +9.43% to $232.95) gapped up today and hit a new 52-week high, triggering a technical buy signal while rising from a 9-week base. It returned to the Featured Stocks page today and was color coded yellow with pivot point and max buy levels noted in the earlier mid-day report (read here). In the most current (C criteria) quarter ended December 31, 2009 its sales revenues and earnings showed impressive acceleration yet again with increases well above the +25% minimum guideline. It has powerfully rebounded above its 50 DMA line and is now free from resistance due to overhead supply. Annual earnings growth (the A criteria) has been strong. An overriding concern currently is the M criteria which argues against new buying efforts until a solid follow-through-day from at least one of the major averages occurs.
Now listed in the Leisure-Services group to better reflect its primarily travel-related online services, PCLN was listed in the Internet - eCommerce group in the past. A summary of CANSLIM.net's past coverage and the stock's subsequent action was published on 11/07/08 under the headline "Multiple Sell Signals Preceded Big Price Decline" . That write-up explained the stock's weak action after it had been dropped from the Featured Stocks list after its 200 DMA violation on July 2, 2008. PCLN was first featured on Friday, November 09, 2007 in the CANSLIM.net Mid Day Breakouts Report after gapping up over the $100 threshold (read here). The current action may be signalling the beginning of another considerable and sustained rally.
|
|
|
Color Codes Explained :
Y - Better candidates highlighted by our
staff of experts.
G - Previously featured
in past reports as yellow but may no longer be buyable under the
guidelines.
***Last / Change / Volume quote data in this table corresponds with the timestamp on the note***
Symbol/Exchange
Company Name
Industry Group |
Last |
Chg. |
Vol
% DAV |
Date Featured |
Price Featured |
Latest Pivot Point
Featured |
Status |
| Latest Max Buy Price |
ARST
-
|
$27.89
|
+0.75
|
426,608
94% DAV
455,200
|
12/22/2009
(Date
Featured) |
$25.94
(Price
Featured) |
PP = $27.20 |
G |
| MB = $28.56 |
Most Recent Note - 2/18/2010 4:30:49 PM
G - Posted a 7th consecutive gain today with near average volume, rallying further above its 50 DMA line. Important support to watch now is its recent low ($22.58) and prior chart lows in the $22 area. ARST was first featured in yellow at $19.91 in the 9/01/09 mid-day report with an annotated daily graph (read here).
>>> The latest Featured Stock Update with an annotated graph appeared on 2/17/2010. click here.
|
|
C
A
S
I |
News |
Chart |
SEC
View all notes Alert
me of new notes
Company
Profile
|
BIDU
- NASDAQ
Baidu Inc Ads
INTERNET - Internet Information Providers
|
$497.60
|
+10.08
|
1,140,115
59% DAV
1,937,800
|
1/13/2010
(Date
Featured) |
$431.25
(Price
Featured) |
PP = $426.75 |
G |
| MB = $448.09 |
Most Recent Note - 2/18/2010 4:40:16 PM
G - Volume was light behind today's gain for a new all-time high. It is only about +5% above its mid-January high but did not form a sound base, and it gapped up on 2/10/10 for a considerable gain with volume more than 3 times average.
>>> The latest Featured Stock Update with an annotated graph appeared on 2/11/2010. click here.
|
|
C
A
S
I |
News |
Chart |
SEC
View all notes Alert
me of new notes
Company
Profile
|
BRLI
- NASDAQ
Bio Reference Labs Inc
HEALTH SERVICES - Medical Laboratories & Researc
|
$39.80
|
+0.00
|
35,963
42% DAV
85,600
|
2/12/2010
(Date
Featured) |
$39.02
(Price
Featured) |
PP = $40.97 |
Y |
| MB = $43.02 |
Most Recent Note - 2/18/2010 4:43:18 PM
Y - Paused today after 6 consecutive gains, perched only -3% from its 52-week high, very near its pivot point. Consolidating for 5-weeks above support at its 50 DMA line, this high-ranked Medical-Dental - Services firm has not triggered a technical buy signal since it was featured in yellow in the 2/12/10 mid-day report (read here). Very little resistance remains due to overhead supply. Earnings growth and sales revenues growth has accelerated, better than the +25% minimum guideline in recent quarters. Fundamentals are favorable with respect to the C and A criteria.
>>> The latest Featured Stock Update with an annotated graph appeared on 2/12/2010. click here.
|
|
C
A
S
I |
News |
Chart |
SEC
View all notes Alert
me of new notes
Company
Profile
|
CACC
- NASDAQ
Credit Acceptance Corp
FINANCIAL SERVICES - Credit Services
|
$40.53
|
+0.20
|
26,196
42% DAV
63,000
|
9/29/2009
(Date
Featured) |
$33.48
(Price
Featured) |
PP = $37.10 |
G |
| MB = $38.96 |
Most Recent Note - 2/18/2010 4:47:03 PM
G - Quietly consolidating in a tight trading range for the past week, holding its ground well above prior chart highs in the $37 area. This Financial firm's outlook is questionable until it trades back above its 50 DMA line.
>>> The latest Featured Stock Update with an annotated graph appeared on 2/9/2010. click here.
|
|
C
A
S
I |
News |
Chart |
SEC
View all notes Alert
me of new notes
Company
Profile
|
CRM
- NYSE
Salesforce.com Inc
INTERNET - Internet Software & Services
|
$68.45
|
+1.67
|
2,088,812
110% DAV
1,905,600
|
12/18/2009
(Date
Featured) |
$67.32
(Price
Featured) |
PP = $67.82 |
G |
| MB = $71.21 |
Most Recent Note - 2/18/2010 4:53:20 PM
G - Gain today on near average volume helped it close above its 50 DMA line for the first time since 1/20/10, technically helping its outlook improve. Recent chart low ($60.30 on 2/05/10) is an important support level to watch.
>>> The latest Featured Stock Update with an annotated graph appeared on 2/10/2010. click here.
|
|
C
A
S
I |
News |
Chart |
SEC
View all notes Alert
me of new notes
Company
Profile
|
GMCR
- NASDAQ
Green Mtn Coffee Roastrs
FOOD & BEVERAGE - Processed & Packaged Goods
|
$83.49
|
+0.18
|
459,883
31% DAV
1,481,100
|
12/28/2009
(Date
Featured) |
$77.49
(Price
Featured) |
PP = $76.50 |
G |
| MB = $80.33 |
Most Recent Note - 2/18/2010 4:54:44 PM
G - Still consolidating in a tight trading range with volume drying up, base building above its 50 DMA line and within close striking range of its 52-week high. Important initial support level to watch is recent lows in the $78 area.
>>> The latest Featured Stock Update with an annotated graph appeared on 2/2/2010. click here.
|
|
C
A
S
I |
News |
Chart |
SEC
View all notes Alert
me of new notes
Company
Profile
|
ISRG
- NASDAQ
Intuitive Surgical Inc
HEALTH SERVICES - Medical Appliances & Equipment
|
$344.75
|
+3.60
|
432,622
84% DAV
515,100
|
1/22/2010
(Date
Featured) |
$340.40
(Price
Featured) |
PP = $314.00 |
G |
| MB = $329.70 |
Most Recent Note - 2/18/2010 5:04:57 PM
G - Gain on light volume for another new high close, approaching its 52-week high with today's 5th consecutive gain. Its 50 DMA line and recent chart lows in the $315 area define important technical support. ISRG was featured again most recently in the 1/22/10 mid-day report (read here).
>>> The latest Featured Stock Update with an annotated graph appeared on 2/5/2010. click here.
|
|
C
A
S
I |
News |
Chart |
SEC
View all notes Alert
me of new notes
Company
Profile
|
PCLN
- NASDAQ
Priceline.com Inc
INTERNET - Internet Software & Services
|
$399.55
|
-4.72
|
584,812
N/A
|
11/1/2002
(Date
Featured) |
$399.55
(Price
Featured) |
PP = $428.20 |
Y |
| MB = $449.61 |
Most Recent Note - 1/2/2011
Y - Returns to Featured Stocks list with its appearance in the January 2011 CANSLIM.net News including detailed analysis and annotated daily and weekly graphs.
>>> The latest Featured Stock Update with an annotated graph appeared on 2/18/2010. click here.
|
|
C
A
S
I |
News |
Chart |
SEC
View all notes Alert
me of new notes
Company
Profile
|
PEGA
- NASDAQ
Pegasystems Inc
COMPUTER SOFTWARE & SERVICES - Business Software & Services
|
$36.96
|
+0.63
|
149,650
77% DAV
193,100
|
1/4/2010
(Date
Featured) |
$34.00
(Price
Featured) |
PP = $36.19 |
G |
| MB = $38.00 |
Most Recent Note - 2/18/2010 6:35:00 PM
G - Gain today on light volume for its 3rd highest close ever. Wedging higher quietly up from the $35-36 area that was a previously a stubborn resistance level. Its 50 DMA line and prior chart lows near $32 define near-term support to watch.
>>> The latest Featured Stock Update with an annotated graph appeared on 2/8/2010. click here.
|
|
C
A
S
I |
News |
Chart |
SEC
View all notes Alert
me of new notes
Company
Profile
|
SIRO
- NASDAQ
Sirona Dental Systems
HEALTH SERVICES - Medical Instruments & Supplies
|
$34.92
|
-0.17
|
398,596
70% DAV
570,100
|
2/16/2010
(Date
Featured) |
$36.43
(Price
Featured) |
PP = $36.15 |
Y |
| MB = $37.96 |
Most Recent Note - 2/18/2010 6:37:06 PM
Y - Held its ground today after a gap down on the prior session. Priced a secondary offering of shares from which the company will not receive any proceeds. The considerable loss led to a close below its pivot point, and today it closed below its prior high closes, raising more concerns. Featured in the 2/16/10 mid-day report (read here) as it broke out from a 10-week flat base. It has rallied from January 2009 lows near $10. Fundamentally, following 3 negative comparisons, its sales revenues in the Sep and Dec '09 quarters showed a return to growth. Quarterly earnings increases have been very strong along with great annual earnings growth in recent years (good C and A criteria). This high-ranked Medical - Systems/Equipment firm had previously completed Secondary Offerings on 8/06/09 and 12/11/09.
>>> The latest Featured Stock Update with an annotated graph appeared on 2/16/2010. click here.
|
|
C
A
S
I |
News |
Chart |
SEC
View all notes Alert
me of new notes
Company
Profile
|
|
|
|
THESE ARE NOT BUY RECOMMENDATIONS!
Comments contained in the body of this report are technical
opinions only. The material herein has been obtained
from sources believed to be reliable and accurate, however,
its accuracy and completeness cannot be guaranteed.
This site is not an investment advisor, hence it does
not endorse or recommend any securities or other investments.
Any recommendation contained in this report may not
be suitable for all investors and it is not to be deemed
an offer or solicitation on our part with respect to
the purchase or sale of any securities. All trademarks,
service marks and trade names appearing in this report
are the property of their respective owners, and are
likewise used for identification purposes only.
This report is a service available
only to active Paid Premium Members.
You may opt-out of receiving report notifications
at any time. Questions or comments may be submitted
by writing to Premium Membership Services 665 S.E. 10 Street, Suite 201 Deerfield Beach, FL 33441-5634 or by calling 1-800-965-8307
or 954-785-1121.
|
|
|


