***Last / Change / Volume data in this table is the closing quote data***
Symbol/Exchange
Company Name
Industry Group |
PRICE |
CHANGE
(%Change) |
Day High |
Volume
(% DAV)
(% 50 day avg vol) |
52 Wk Hi
% From Hi |
Featured
Date |
Price
Featured |
Pivot Featured |
|
Max Buy |
BIDU
-
NASDAQ
Baidu Inc Ads
INTERNET - Internet Information Providers
|
$128.54
|
-0.17
-0.13% |
$129.26
|
3,601,211
47.27% of 50 DAV
50 DAV is 7,618,300
|
$131.63
-2.35%
|
2/1/2011
|
$117.74
|
PP = $112.08
|
|
MB = $117.68
|
Most Recent Note - 2/11/2011 5:36:29 PM
G - Hit another new all-time high with today's 5th consecutive gain on average volume. Prior highs in the $112-115 area define initial chart support to watch now.
>>> The latest Featured Stock Update with an annotated graph appeared on 2/2/2011. Click here.
View all notes |
Alert me of new notes |
CANSLIM.net Company Profile |
SEC |
Zacks Reports |
StockTalk |
News |
Chart |
Request a new note
C
A N
S L
I M


|
CMG
-
NYSE
Chipotle Mexican Grill
LEISURE - Restaurants
|
$265.54
|
+1.53
0.58% |
$268.00
|
789,742
76.76% of 50 DAV
50 DAV is 1,028,900
|
$275.00
-3.44%
|
2/11/2011
|
$271.15
|
PP = $262.87
|
|
MB = $276.01
|
Most Recent Note - 2/15/2011 3:52:33 PM
Y - Down on near average volume today after a recent spurt of gains with above average volume. Reported strong earnings and technically rallied "straight up from the bottom" from an 11-week cup shaped base without a handle.
>>> The latest Featured Stock Update with an annotated graph appeared on 2/11/2011. Click here.
View all notes |
Alert me of new notes |
CANSLIM.net Company Profile |
SEC |
Zacks Reports |
StockTalk |
News |
Chart |
Request a new note
C
A N
S L
I M
|
CRUS
-
NASDAQ
Cirrus Logic Inc
ELECTRONICS - Semiconductor - Specialized
|
$25.15
|
+0.15
0.60% |
$25.37
|
2,161,463
66.01% of 50 DAV
50 DAV is 3,274,600
|
$25.48
-1.30%
|
1/28/2011
|
$20.69
|
PP = $19.17
|
|
MB = $20.13
|
Most Recent Note - 2/16/2011 6:25:27 PM
G - Gain on light volume today for a new high close. Holding its ground stubbornly after volume-driven gains, it is extended from its latest sound base pattern. Patience may allow for secondary buy points to develop. Prior highs define chart support levels to watch on pullbacks.
>>> The latest Featured Stock Update with an annotated graph appeared on 1/28/2011. Click here.
View all notes |
Alert me of new notes |
CANSLIM.net Company Profile |
SEC |
Zacks Reports |
StockTalk |
News |
Chart |
Request a new note
C
A N
S L
I M
|
CTSH
-
NASDAQ
Cognizant Tech Sol Cl A
COMPUTER SOFTWARE and SERVICES - Business Software and Services
|
$76.88
|
+0.24
0.31% |
$77.26
|
1,365,288
61.72% of 50 DAV
50 DAV is 2,211,900
|
$77.08
-0.26%
|
2/7/2011
|
$75.09
|
PP = $76.46
|
|
MB = $80.28
|
Most Recent Note - 2/16/2011 6:26:58 PM
Y - Inched higher for a 4th consecutive small gain today on below average volume. Consolidating above its 50 DMA line, it faces no resistance due to overhead supply after closing the session -0.6% off its 52-week high. See the latest FSU analysis for details and a new annotated graph.
>>> The latest Featured Stock Update with an annotated graph appeared on 2/8/2011. Click here.
View all notes |
Alert me of new notes |
CANSLIM.net Company Profile |
SEC |
Zacks Reports |
StockTalk |
News |
Chart |
Request a new note
C
A N
S L
I M
|
DECK
-
NASDAQ
Deckers Outdoor Corp
CONSUMER NON-DURABLES - Textile - Apparel Footwear
|
$90.57
|
+6.32
7.50% |
$90.75
|
3,350,909
207.54% of 50 DAV
50 DAV is 1,614,600
|
$87.88
3.06%
|
2/3/2011
|
$79.61
|
PP = $82.67
|
|
MB = $86.80
|
 Most Recent Note - 2/17/2011 12:08:28 PM
Y - After gapping down today it has managed a powerful positive reversal, which is bullish action. It has rallied above the "max buy" level cited and may technically have the heavy volume to clinch a late buy signal based on the previously noted "double bottom" base pattern. The recent consolidation was too short to be considered a proper "handle" on a cup-with-handle pattern, however one may also consider it to be rising from a 9-week flat base (no new pivot point is being cited). The stock is free of all resistance due to overhead supply.
>>> The latest Featured Stock Update with an annotated graph appeared on 1/26/2011. Click here.
View all notes |
Alert me of new notes |
CANSLIM.net Company Profile |
SEC |
Zacks Reports |
StockTalk |
News |
Chart |
Request a new note
C
A N
S L
I M
|
Symbol/Exchange
Company Name
Industry Group |
PRICE |
CHANGE
(%Change) |
Day High |
Volume
(% DAV)
(% 50 day avg vol) |
52 Wk Hi
% From Hi |
Featured
Date |
Price
Featured |
Pivot Featured |
|
Max Buy |
EZCH
-
NASDAQ
Ezchip Semiconductor Ltd
ELECTRONICS - Semiconductor - Specialized
|
$30.30
|
+0.01
0.03% |
$30.47
|
246,589
64.38% of 50 DAV
50 DAV is 383,000
|
$33.48
-9.50%
|
12/2/2010
|
$27.53
|
PP = $26.00
|
|
MB = $27.30
|
Most Recent Note - 2/14/2011 3:21:00 PM
G - Today's gain with above average volume is indicative of support near its 50 DMA line. On 2/10/11 it reported earnings +41% on +33% sales revenues for the quarter ended December 31, 2010, and gapped down undercutting its 50 DMA line and prior chart highs in the $29 area then rebounded to close well above both. As previously noted - "Volume and volatility often increase near corporate earnings news."
>>> The latest Featured Stock Update with an annotated graph appeared on 1/21/2011. Click here.
View all notes |
Alert me of new notes |
CANSLIM.net Company Profile |
SEC |
Zacks Reports |
StockTalk |
News |
Chart |
Request a new note
C
A N
S L
I M
|
EZPW
-
NASDAQ
Ezcorp Inc Cl A
SPECIALTY RETAIL - Specialty Retail, Other
|
$28.13
|
+0.27
0.97% |
$28.21
|
280,541
70.56% of 50 DAV
50 DAV is 397,600
|
$29.94
-6.05%
|
11/5/2010
|
$24.02
|
PP = $23.85
|
|
MB = $25.04
|
Most Recent Note - 2/15/2011 4:03:03 PM
G - Small gap down today on below average (but higher) volume led to a close back under its 50 DMA line again. Showing resilience in recent Weeks while volume totals have been cooling, but it has not built a sound new base. Recent low ($25.56 on 1/25/11) defines an important support level now.
>>> The latest Featured Stock Update with an annotated graph appeared on 2/3/2011. Click here.
View all notes |
Alert me of new notes |
CANSLIM.net Company Profile |
SEC |
Zacks Reports |
StockTalk |
News |
Chart |
Request a new note
C
A N
S L
I M
|
FOSL
-
NASDAQ
Fossil Inc
CONSUMER DURABLES - Recreational Goods, Other
|
$78.42
|
-0.67
-0.85% |
$78.84
|
751,267
99.61% of 50 DAV
50 DAV is 754,200
|
$83.68
-6.29%
|
2/1/2011
|
$73.30
|
PP = $74.44
|
|
MB = $78.16
|
Most Recent Note - 2/16/2011 12:06:18 PM
G - Holding its ground today. Gapped down on 2/15/11 following 8 consecutive gains into new high territory after reporting earnings +42% on +33% sales revenues. Prior resistance in the $74 area defines initial chart support above its 50 DMA line.
>>> The latest Featured Stock Update with an annotated graph appeared on 1/12/2011. Click here.
View all notes |
Alert me of new notes |
CANSLIM.net Company Profile |
SEC |
Zacks Reports |
StockTalk |
News |
Chart |
Request a new note
C
A N
S L
I M
|
HMSY
-
NASDAQ
H M S Holdings Corp
COMPUTER SOFTWARE and SERVICES - Healthcare Information Service
|
$71.96
|
+0.89
1.25% |
$72.48
|
240,404
168.23% of 50 DAV
50 DAV is 142,900
|
$71.60
0.50%
|
11/19/2010
|
$61.89
|
PP = $63.01
|
|
MB = $66.16
|
Most Recent Note - 2/16/2011 6:17:52 PM
G - Prior highs near $67 define initial support to watch on pullbacks. Hit yet another new 52-week high today with its 12th consecutive gain with ever-increasing volume since it found support at its 50 DMA line. It quietly rose from an orderly base-on-base type pattern. Relative Strength rank (now 75) was noted as a concern and has only gradually improved.
>>> The latest Featured Stock Update with an annotated graph appeared on 2/16/2011. Click here.
View all notes |
Alert me of new notes |
CANSLIM.net Company Profile |
SEC |
Zacks Reports |
StockTalk |
News |
Chart |
Request a new note
C
A N
S L
I M
|
JOBS
-
NASDAQ
Fifty One Job Inc Ads
DIVERSIFIED SERVICES - Staffing and; Outsourcing Service
|
$59.67
|
+0.12
0.20% |
$60.04
|
52,199
38.58% of 50 DAV
50 DAV is 135,300
|
$61.28
-2.63%
|
2/7/2011
|
$59.23
|
PP = $61.38
|
|
MB = $64.45
|
Most Recent Note - 2/16/2011 6:18:47 PM
Y - Perched near its 52-week high. Its 50 DMA line and recent low ($52.58 on 1/28/11) define important support where violations would raise concerns and trigger technical sell signals. After a long ascending base pattern, subsequent volume-driven gains above its pivot point may trigger a new (or add-on) technical buy signal.
>>> The latest Featured Stock Update with an annotated graph appeared on 2/7/2011. Click here.
View all notes |
Alert me of new notes |
CANSLIM.net Company Profile |
SEC |
Zacks Reports |
StockTalk |
News |
Chart |
Request a new note
C
A N
S L
I M
|
Symbol/Exchange
Company Name
Industry Group |
PRICE |
CHANGE
(%Change) |
Day High |
Volume
(% DAV)
(% 50 day avg vol) |
52 Wk Hi
% From Hi |
Featured
Date |
Price
Featured |
Pivot Featured |
|
Max Buy |
LULU
-
NASDAQ
Lululemon Athletica
MANUFACTURING - Textile Manufacturing
|
$82.44
|
-0.16
-0.19% |
$83.70
|
1,004,483
42.98% of 50 DAV
50 DAV is 2,337,200
|
$85.28
-3.33%
|
1/26/2011
|
$68.11
|
PP = $74.70
|
|
MB = $78.44
|
Most Recent Note - 2/15/2011 3:56:10 PM
G - Quietly pulling back from its 52-week high after a streak of 7 consecutive gains with higher volume. Extended from its latest sound base, its prior highs near $74 define chart support to watch now.
>>> The latest Featured Stock Update with an annotated graph appeared on 1/14/2011. Click here.
View all notes |
Alert me of new notes |
CANSLIM.net Company Profile |
SEC |
Zacks Reports |
StockTalk |
News |
Chart |
Request a new note
C
A N
S L
I M
|
MWIV
-
NASDAQ
M W I Veterinary Supply
HEALTH SERVICES - Medical Instruments and; Supplies
|
$67.80
|
-3.80
-5.31% |
$70.50
|
191,054
304.23% of 50 DAV
50 DAV is 62,800
|
$72.27
-6.19%
|
11/4/2010
|
$61.79
|
PP = $59.60
|
|
MB = $62.58
|
Most Recent Note - 2/17/2011 12:53:17 PM
G - Small gap down today following an analysts downgrade, reversing from its all-time high. It has not built a sound new base pattern. Prior highs in the $67 area define initial chart support to watch. Sales revenues acceleration (bigger percentage increases sequentially, +34%, +41%, +45% and +55% in the Mar, Jun, Sep, and Dec '10 quarterly comparisons versus the year earlier) is a very reassuring sign.
>>> The latest Featured Stock Update with an annotated graph appeared on 2/2/2011. Click here.
View all notes |
Alert me of new notes |
CANSLIM.net Company Profile |
SEC |
Zacks Reports |
StockTalk |
News |
Chart |
Request a new note
C
A N
S L
I M
|
NFLX
-
NASDAQ
Netflix Inc
SPECIALTY RETAIL - Music and Video Stores
|
$235.63
|
-2.09
-0.88% |
$241.80
|
5,636,655
101.17% of 50 DAV
50 DAV is 5,571,600
|
$247.55
-4.82%
|
1/10/2011
|
$187.88
|
PP = $209.34
|
|
MB = $219.81
|
Most Recent Note - 2/15/2011 12:32:20 PM
G - Small gap down today followed a considerable gain with above average volume for yet another new all-time high. It has been noted as extended from a sound base, and prior high ($209) defines support to watch above its 50 DMA line.
>>> The latest Featured Stock Update with an annotated graph appeared on 1/10/2011. Click here.
View all notes |
Alert me of new notes |
CANSLIM.net Company Profile |
SEC |
Zacks Reports |
StockTalk |
News |
Chart |
Request a new note
C
A N
S L
I M
|
NTAP
-
NASDAQ
Netapp Inc
COMPUTER HARDWARE - Data Storage Devices
|
$54.77
|
-3.77
-6.44% |
$55.10
|
30,152,385
695.17% of 50 DAV
50 DAV is 4,337,400
|
$61.02
-10.24%
|
1/6/2011
|
$57.49
|
PP = $58.06
|
|
MB = $60.96
|
Most Recent Note - 2/17/2011 10:04:23 AM
G - Gapped down today and violated its 50 DMA line, raising concerns and triggering a technical sell signal. Reported earnings +30% on +25% sales revenues for the quarter ended January 31, 2011 versus the year ago period. It has traded below the prior chart low ($53.14) which also defines an important support level where it might show resilience following the 50 DMA violation.
>>> The latest Featured Stock Update with an annotated graph appeared on 2/4/2011. Click here.
View all notes |
Alert me of new notes |
CANSLIM.net Company Profile |
SEC |
Zacks Reports |
StockTalk |
News |
Chart |
Request a new note
C
A N
S L
I M
|
OPEN
-
NASDAQ
Opentable Inc
INTERNET - Internet Software and Services
|
$92.89
|
-0.03
-0.03% |
$93.99
|
537,735
58.60% of 50 DAV
50 DAV is 917,600
|
$95.97
-3.21%
|
1/5/2011
|
$74.05
|
PP = $76.79
|
|
MB = $80.63
|
Most Recent Note - 2/15/2011 6:27:33 PM
G - Quietly consolidating after a streak of volume-driven gains for new all-time highs. Extended from a sound base pattern, meanwhile prior highs define support above its 50 DMA line. See the latest FSU summary for more details and an annotated graph.
>>> The latest Featured Stock Update with an annotated graph appeared on 2/15/2011. Click here.
View all notes |
Alert me of new notes |
CANSLIM.net Company Profile |
SEC |
Zacks Reports |
StockTalk |
News |
Chart |
Request a new note
C
A N
S L
I M
|
Symbol/Exchange
Company Name
Industry Group |
PRICE |
CHANGE
(%Change) |
Day High |
Volume
(% DAV)
(% 50 day avg vol) |
52 Wk Hi
% From Hi |
Featured
Date |
Price
Featured |
Pivot Featured |
|
Max Buy |
ORCL
-
NASDAQ
Oracle Corp
COMPUTER SOFTWARE and SERVICES - Application Software
|
$33.01
|
-0.10
-0.30% |
$33.20
|
14,568,772
55.55% of 50 DAV
50 DAV is 26,224,400
|
$33.59
-1.73%
|
1/20/2011
|
$32.31
|
PP = $32.37
|
|
MB = $33.99
|
Most Recent Note - 2/14/2011 2:49:04 PM
Y - Volume totals have been cooling while hovering near its 52-week high, below its "max buy" level. Near-term support to watch is its 50 DMA line.
>>> The latest Featured Stock Update with an annotated graph appeared on 1/7/2011. Click here.
View all notes |
Alert me of new notes |
CANSLIM.net Company Profile |
SEC |
Zacks Reports |
StockTalk |
News |
Chart |
Request a new note
C
A N
S L
I M
|
PAY
-
NYSE
Verifone Systems Inc
COMPUTER HARDWARE - Transaction Automation Systems
|
$49.41
|
+0.25
0.51% |
$49.91
|
2,453,125
169.61% of 50 DAV
50 DAV is 1,446,300
|
$49.28
0.27%
|
1/27/2011
|
$41.77
|
PP = $44.97
|
|
MB = $47.22
|
Most Recent Note - 2/16/2011 6:08:28 PM
G - Gain today with slightly above average volume for another new 52-week high. Technically triggered a new (or add-on) technical buy signal and quickly getting extended beyond its "max buy" level with its 2/14/11 gain. Color code was changed to green.
>>> The latest Featured Stock Update with an annotated graph appeared on 1/27/2011. Click here.
View all notes |
Alert me of new notes |
CANSLIM.net Company Profile |
SEC |
Zacks Reports |
StockTalk |
News |
Chart |
Request a new note
C
A N
S L
I M
|
PCLN
-
NASDAQ
Priceline.Com Inc
INTERNET - Internet Software and Services
|
$455.27
|
-2.77
-0.60% |
$462.35
|
709,779
76.12% of 50 DAV
50 DAV is 932,400
|
$464.47
-1.98%
|
1/3/2011
|
$399.55
|
PP = $428.20
|
|
MB = $449.61
|
Most Recent Note - 2/11/2011 5:34:18 PM
G - Color code was changed to green after rising above its "max buy" level this week. Prior highs and its 50 DMA line define support to watch.
>>> The latest Featured Stock Update with an annotated graph appeared on 2/14/2011. Click here.
View all notes |
Alert me of new notes |
CANSLIM.net Company Profile |
SEC |
Zacks Reports |
StockTalk |
News |
Chart |
Request a new note
C
A N
S L
I M
|
RAX
-
NYSE
Rackspace Hosting Inc
INTERNET - Internet Software and; Services
|
$38.89
|
+0.21
0.54% |
$39.22
|
1,060,598
56.60% of 50 DAV
50 DAV is 1,873,700
|
$40.62
-4.26%
|
1/10/2011
|
$22.84
|
PP = $32.76
|
|
MB = $34.40
|
Most Recent Note - 2/14/2011 3:18:02 PM
G - Pulling back today after a considerable gap up on 2/11/11 for a considerable gain on heavy volume after reporting earnings +29% on +27% sales revenues for the quarter ended December 31, 2010 versus the year ago period. It is extended from any sound base. Recent highs near $35 define support to watch above its 50 DMA line.
>>> The latest Featured Stock Update with an annotated graph appeared on 2/9/2011. Click here.
View all notes |
Alert me of new notes |
CANSLIM.net Company Profile |
SEC |
Zacks Reports |
StockTalk |
News |
Chart |
Request a new note
C
A N
S L
I M
|
ROVI
-
NASDAQ
Rovi Corp
COMPUTER SOFTWARE andamp; SERVICES - Security Software andamp; Services
|
$60.13
|
-0.02
-0.03% |
$60.24
|
4,054,103
233.12% of 50 DAV
50 DAV is 1,739,100
|
$69.50
-13.48%
|
10/29/2010
|
$49.99
|
PP = $53.10
|
|
MB = $55.76
|
Most Recent Note - 2/17/2011 5:49:34 PM
G - Held its ground today but failed to rebound after violating its 50 DMA line. A largest ever 1-day point loss on 2/16/11 with more than 4 times average volume triggered a worrisome technical sell signal. Weaker fundamentals and technical action raised concerns after it reported earnings +8% on +2% sales for the quarter ended December 31, 2010 versus the year-ago period and closed near the previously noted 1/31/11 low ($60.15) defining near-term chart support.
>>> The latest Featured Stock Update with an annotated graph appeared on 1/25/2011. Click here.
View all notes |
Alert me of new notes |
CANSLIM.net Company Profile |
SEC |
Zacks Reports |
StockTalk |
News |
Chart |
Request a new note
C
A N
S L
I M
|
Symbol/Exchange
Company Name
Industry Group |
PRICE |
CHANGE
(%Change) |
Day High |
Volume
(% DAV)
(% 50 day avg vol) |
52 Wk Hi
% From Hi |
Featured
Date |
Price
Featured |
Pivot Featured |
|
Max Buy |
TIBX
-
NASDAQ
Tibco Software Inc
COMPUTER SOFTWARE and SERVICES - Business Software and Services
|
$25.47
|
+0.00
0.00% |
$25.58
|
1,209,659
44.19% of 50 DAV
50 DAV is 2,737,300
|
$25.94
-1.81%
|
2/1/2011
|
$24.35
|
PP = $22.18
|
|
MB = $23.29
|
Most Recent Note - 2/14/2011 2:46:09 PM
G - Inched to another new 52-week high today with a gain on lighter volume. Extended from its latest sound base, its prior highs in the $22 area define support. See the latest FSU analysis for details and a new annotated graph.
>>> The latest Featured Stock Update with an annotated graph appeared on 2/10/2011. Click here.
View all notes |
Alert me of new notes |
CANSLIM.net Company Profile |
SEC |
Zacks Reports |
StockTalk |
News |
Chart |
Request a new note
C
A N
S L
I M
|
UA
-
NYSE
Under Armour Inc Cl A
CONSUMER NON-DURABLES - Textile - Apparel Clothing
|
$67.53
|
-0.24
-0.35% |
$68.00
|
421,664
53.46% of 50 DAV
50 DAV is 788,800
|
$70.43
-4.12%
|
1/27/2011
|
$58.31
|
PP = $56.99
|
|
MB = $59.84
|
Most Recent Note - 2/15/2011 3:53:53 PM
G - Quietly pulling back from its 52-week high following a recent spurt of gains with above average volume. Prior resistance in the $60 area defines initial support to watch above its 50 DMA line.
>>> The latest Featured Stock Update with an annotated graph appeared on 2/1/2011. Click here.
View all notes |
Alert me of new notes |
CANSLIM.net Company Profile |
SEC |
Zacks Reports |
StockTalk |
News |
Chart |
Request a new note
C
A N
S L
I M
|
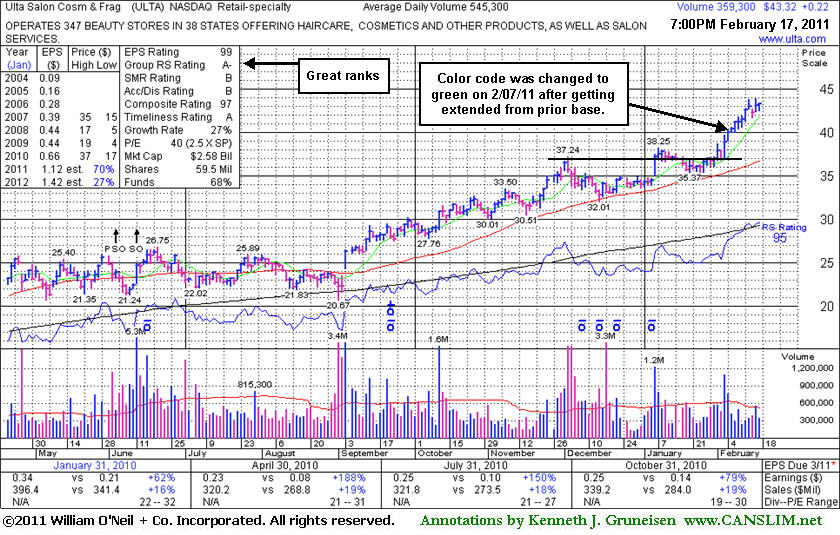
ULTA
-
NASDAQ
Ulta Salon Cosm & Frag
SPECIALTY RETAIL - Specialty Retail, Other
|
$43.32
|
+0.22
0.51% |
$43.45
|
363,636
65.45% of 50 DAV
50 DAV is 555,600
|
$43.90
-1.32%
|
1/6/2011
|
$36.12
|
PP = $37.34
|
|
MB = $39.21
|
Most Recent Note - 2/16/2011 6:23:49 PM
G - New all-time high close with a small gain today on average volume. It is extended from a sound base pattern, and prior highs in the $37-38 area define chart support to watch above its 50 DMA line.
>>> The latest Featured Stock Update with an annotated graph appeared on 2/17/2011. Click here.
View all notes |
Alert me of new notes |
CANSLIM.net Company Profile |
SEC |
Zacks Reports |
StockTalk |
News |
Chart |
Request a new note
C
A N
S L
I M
|