You are not logged in.
This means you
CAN ONLY VIEW reports that were published prior to Sunday, April 27, 2025.
You
MUST UPGRADE YOUR MEMBERSHIP if you want to see any current reports.
AFTER MARKET UPDATE - WEDNESDAY, FEBRUARY 17TH, 2010
Previous After Market Report Next After Market Report >>>
|
|
|
|
DOW |
+40.43 |
10,309.24 |
+0.39% |
|
Volume |
1,021,319,540 |
-6% |
|
Volume |
2,098,219,610 |
+1% |
|
NASDAQ |
+12.10 |
2,226.29 |
+0.55% |
|
Advancers |
2,048 |
65% |
|
Advancers |
1,583 |
56% |
|
S&P 500 |
+4.64 |
1,099.51 |
+0.42% |
|
Decliners |
981 |
31% |
|
Decliners |
1,074 |
38% |
|
Russell 2000 |
+3.99 |
624.83 |
+0.64% |
|
52 Wk Highs |
146 |
|
|
52 Wk Highs |
113 |
|
|
S&P 600 |
+2.04 |
331.01 |
+0.62% |
|
52 Wk Lows |
2 |
|
|
52 Wk Lows |
9 |
|
|
 |
Gains For Major Averages Still Insufficient For Follow Through Day
Adam Sarhan, Contributing Writer,
The major averages ended higher on the 8th day of their current rally attempt after the latest round of healthy economic and earnings data was released. Volume, a critical indicator of institutional sponsorship, was mixed; slightly higher on the Nasdaq exchange, but lower on the NYSE compared to the prior session. Advancers trumped decliners by a 2-to-1 ratio on the NYSE and by a 3-to-2 Nasdaq exchange. New 52-week highs outnumbered new lows on both exchanges and new lows were in the single digits. There were 27 high-ranked companies from the CANSLIM.net Leaders List that made a new 52-week high and appeared on the CANSLIM.net BreakOuts Page, down from the 35 issues that appeared on the prior session.
 It was interesting to see both stocks and the US dollar rally on Wednesday after upbeat earnings and economic data was released. Healthy earnings from Deere & Co (DE +5.02%), Whole Foods Market Inc. (WFMI +12.55%) and Hewlett-Packard Co (HPQ +1.38%) helped the bulls send stocks higher. So far, three-quarters of S&P 500 companies have posted stronger than expected Q4 results which bodes well for the US economy. On the economic front, the government said housing starts and industrial production topped the Street's estimates as the economy continues recovering from the worst recession since WWII. In other news, the minutes from last month's FOMC meeting were released which showed Fed officials debated how and when to shrink the central bank’s $2.26 trillion balance sheet. The minutes showed that some officials want to begin selling assets in the “near future” while others are more content to wait until the economy stabilizes.
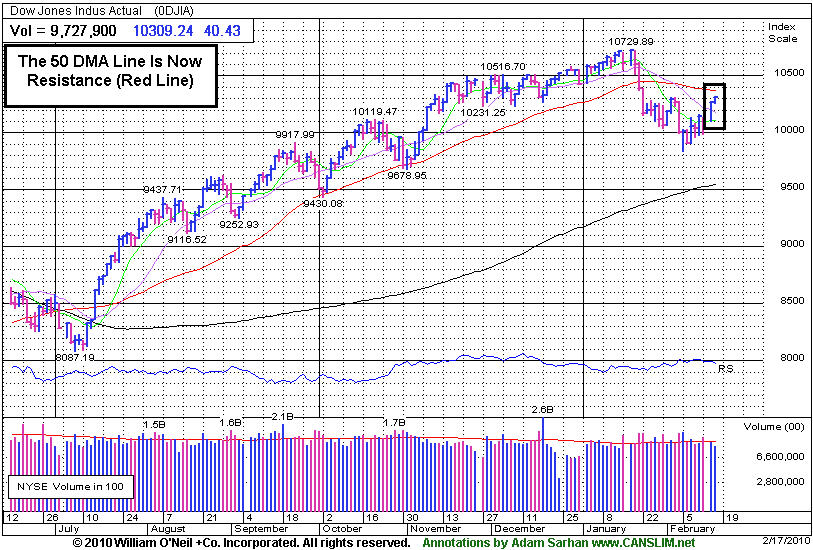
Looking at the market, the major averages closed with modest gains on Wednesday as the major averages consolidate their recent move. As long as February 5th lows are not breached the window remains open for a new follow-through day (FTD) to emerge. A new follow-through day will confirm the current rally attempt and will be produced when one of the major averages rallies at least +1.7% on higher volume than the prior session as a new batch of leaders breakout of sound bases. However, if the February 5, 2010 lows are breached then the day count will be reset and a steeper correction may unfold.
It is also important to see how the major averages react to their respective 50-day moving average (DMA) lines which were support and are now acting as resistance. Until they all close above that important level the technical damage remaining on the charts is a concern. So far, the market’s reaction has been tepid at best to the latest round of economic and earnings data which remains a concern. Remember that the market remains in a correction until a new new follow-through day emerges. Until then, patience is paramount.
Professional Money Management Services - A Winning System - Inquire today!
Our skilled team of portfolio managers knows how to follow the rules of this fact-based investment system. We do not follow opinion or the "conviction list" of some large Wall Street institution which would have us fully invested even during horrific bear markets. Instead, we remain fluid and only buy the best stocks when they are triggering proper technical buy signals. If you are not completely satisfied with the way your portfolio is being managed, Click here to get connected with one of our portfolio managers. *Accounts over $250,000 please. ** Serious inquires only, please.
PICTURED: The Dow Jones Industrial Average remains trading below its 50-day moving average. Technically, gains above that important short-term average for any of the major averages would help the market outlook.
|
|
|
 |
Biotechnology Index Blasts To New Recovery High
Kenneth J. Gruneisen - Passed the CAN SLIM® Master's Exam
The Healthcare Index ($HMO +1.96%) was one of Wednesday's best gainers, making up ground after lagging on the prior session. The Biotechnology Index ($BTK +1.64%) also posted a solid gain while there were smaller gains from the Networking Index ($NWX +0.50%), Semiconductor Index ($SOX +0.17%), and Internet Index ($IIX +0.19%). The Retail Index ($RLX +0.81%) also had a positive influence on the major averages, however the Bank Index ($BKX -0.02%) and Broker/Dealer Index ($XBD +0.03%) finished virtually unchanged. As the Gold & Silver Index ($XAU -0.62%) and Integrated Oil Index ($XOI -0.49%) slumped slightly, the Oil Services Index ($OSX +0.30%) finished narrowly higher.
Charts courtesy www.stockcharts.com
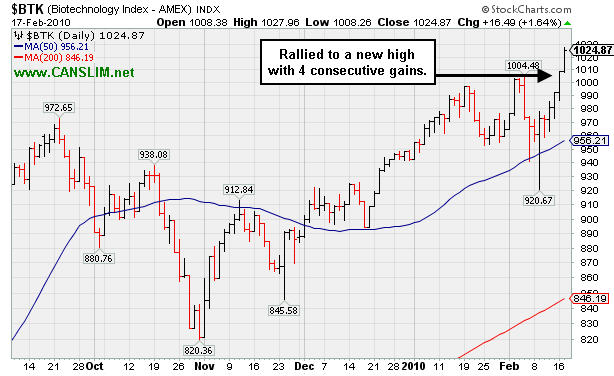
PICTURED: The Biotechnology Index ($BTK +1.64%) has rallied to a new recovery high with its current winning streak of 4 consecutive gains.
| Oil Services |
$OSX |
200.37 |
+0.60 |
+0.30% |
+2.80% |
| Healthcare |
$HMO |
1,418.80 |
+27.26 |
+1.96% |
-3.68% |
| Integrated Oil |
$XOI |
1,036.64 |
-5.14 |
-0.49% |
-2.96% |
| Semiconductor |
$SOX |
341.54 |
+0.58 |
+0.17% |
-5.10% |
| Networking |
$NWX |
230.77 |
+1.14 |
+0.50% |
-0.13% |
| Internet |
$IIX |
226.31 |
+0.44 |
+0.19% |
-3.23% |
| Broker/Dealer |
$XBD |
113.46 |
+0.03 |
+0.03% |
-1.38% |
| Retail |
$RLX |
409.64 |
+3.31 |
+0.81% |
-0.36% |
| Gold & Silver |
$XAU |
162.97 |
-1.02 |
-0.62% |
-3.14% |
| Bank |
$BKX |
45.99 |
-0.01 |
-0.02% |
+7.68% |
| Biotech |
$BTK |
1,024.90 |
+16.52 |
+1.64% |
+8.79% |
|
|
|
 |
Shaping Up After Rebounding Above 50 DMA
Kenneth J. Gruneisen - Passed the CAN SLIM® Master's Exam
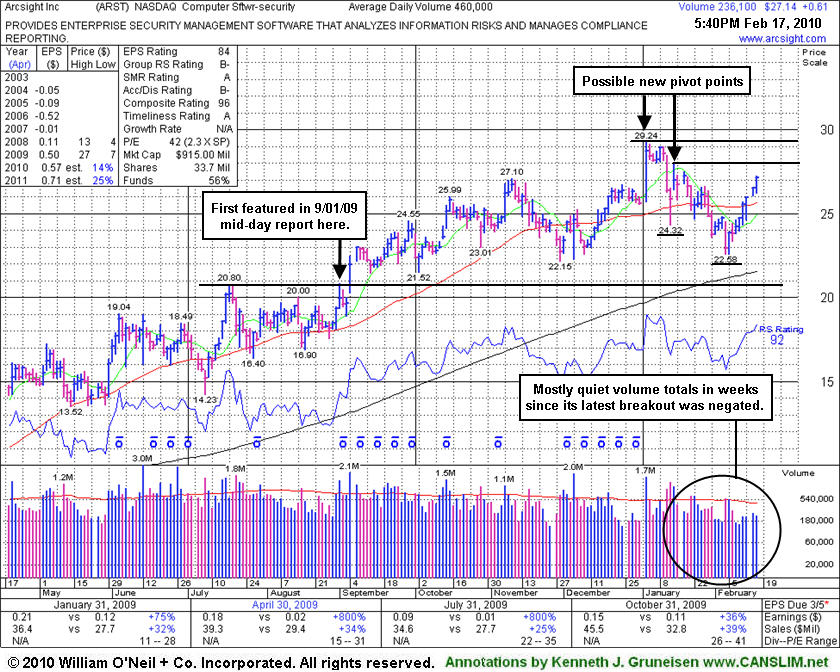
ArcSight, Inc. (ARST +$0.61 or +2.30% to $27.14) posted a 6th consecutive gain today with below average volume, rallying further above its 50-day moving average (DMA) line. In addition to the technical improvement above that short-term average that recently helped its outlook, its Earnings Per Share (EPS) rank has ratcheted back up above the 80 minimum guideline mentioned in the stock's last appearance in this FSU section with an annotated graph on 2/04/10 under the headline Gap Down and Waning EPS Rank Raise Concerns. Building a new potentially sound base now, its consolidation resembles a "double bottom" type pattern marked by an ideal "lower low" where its January 14th high of $27.95 could be used as the pivot point, however, it is a bit short of the minimum length (8 weeks) for a proper double bottom base. Otherwise, its all-time high ($29.24) could be the basis for a new pivot point. Either way, convincing gains above its recent peaks would be a very encouraging sign of hearty demand for the high-ranked Computer Software - Security firm's shares.
Market conditions (M criteria) leave disciplined investors still waiting patiently for a solid follow-through-day before any new buying efforts are justifiable under the investment system guidelines. Important support to watch now is its recent low ($22.58) and its 200 DMA line. ARST has continued putting up solid sales revenues and earnings results since first featured in yellow at $19.91 in the 9/01/09 mid-day report with an annotated daily graph (read here). On January 4, 2010 it had gapped up and triggered a technical buy signal as it blasted above its November 2009 high ($27.10), however, it failed to follow through with additional gains. Losses with above average volume later negated its last breakout and led to a close back in its prior base, raising concerns.
 |
|
|
Color Codes Explained :
Y - Better candidates highlighted by our
staff of experts.
G - Previously featured
in past reports as yellow but may no longer be buyable under the
guidelines.
***Last / Change / Volume quote data in this table corresponds with the timestamp on the note***
Symbol/Exchange
Company Name
Industry Group |
Last |
Chg. |
Vol
% DAV |
Date Featured |
Price Featured |
Latest Pivot Point
Featured |
Status |
| Latest Max Buy Price |
ARST
-
|
$27.14
|
+0.61
|
236,505
51% DAV
460,000
|
12/22/2009
(Date
Featured) |
$25.94
(Price
Featured) |
PP = $27.20 |
G |
| MB = $28.56 |
Most Recent Note - 2/17/2010 4:33:01 PM
G - Posted a 6th consecutive gain today with below average volume, rallying further above its 50 DMA line. Important support to watch now is its recent low ($22.58) and prior chart lows in the $22 area. ARST was first featured in yellow at $19.91 in the 9/01/09 mid-day report with an annotated daily graph (read here).
>>> The latest Featured Stock Update with an annotated graph appeared on 2/17/2010. click here.
|
|
C
A
S
I |
News |
Chart |
SEC
View all notes Alert
me of new notes
Company
Profile
|
BIDU
- NASDAQ
Baidu Inc Ads
INTERNET - Internet Information Providers
|
$487.52
|
-1.95
|
613,134
31% DAV
1,949,200
|
1/13/2010
(Date
Featured) |
$431.25
(Price
Featured) |
PP = $426.75 |
G |
| MB = $448.09 |
Most Recent Note - 2/17/2010 4:37:29 PM
G - Quietly hovering at all-time highs, stubbornly holding its ground for the past week with very few investors heading for the exit. After reporting earnings and raising guidance it gapped up on 2/10/10 for a considerable gain with volume more than 3 times average.
>>> The latest Featured Stock Update with an annotated graph appeared on 2/11/2010. click here.
|
|
C
A
S
I |
News |
Chart |
SEC
View all notes Alert
me of new notes
Company
Profile
|
BRLI
- NASDAQ
Bio Reference Labs Inc
HEALTH SERVICES - Medical Laboratories & Researc
|
$39.80
|
+0.22
|
84,230
99% DAV
84,700
|
2/12/2010
(Date
Featured) |
$39.02
(Price
Featured) |
PP = $40.97 |
Y |
| MB = $43.02 |
Most Recent Note - 2/17/2010 4:38:53 PM
Y - Today's 6th consecutive gain leaves it trading only -2% from its 52-week high, very near its pivot point. Consolidating for 5-weeks above support at its 50 DMA line, this high-ranked Medical-Dental - Services firm has not triggered a technical buy signal since it was featured in yellow in the 2/12/10 mid-day report (read here). Very little resistance remains due to overhead supply. Earnings growth and sales revenues growth has accelerated, better than the +25% minimum guideline in recent quarters. Fundamentals are favorable with respect to the C and A criteria.
>>> The latest Featured Stock Update with an annotated graph appeared on 2/12/2010. click here.
|
|
C
A
S
I |
News |
Chart |
SEC
View all notes Alert
me of new notes
Company
Profile
|
CACC
- NASDAQ
Credit Acceptance Corp
FINANCIAL SERVICES - Credit Services
|
$40.33
|
-0.04
|
24,701
39% DAV
63,100
|
9/29/2009
(Date
Featured) |
$33.48
(Price
Featured) |
PP = $37.10 |
G |
| MB = $38.96 |
Most Recent Note - 2/17/2010 4:42:24 PM
G - Quietly consolidating above prior chart highs in the $37 area which may act as support. This Financial firm's outlook is questionable until it trades back above its 50 DMA line.
>>> The latest Featured Stock Update with an annotated graph appeared on 2/9/2010. click here.
|
|
C
A
S
I |
News |
Chart |
SEC
View all notes Alert
me of new notes
Company
Profile
|
CRM
- NYSE
Salesforce.com Inc
INTERNET - Internet Software & Services
|
$66.78
|
+0.58
|
1,668,057
88% DAV
1,891,100
|
12/18/2009
(Date
Featured) |
$67.32
(Price
Featured) |
PP = $67.82 |
G |
| MB = $71.21 |
Most Recent Note - 2/17/2010 4:43:50 PM
G - Small gain today on near average volume, approaching its 50 DMA line. Gains above that short-term average are needed for its outlook to improve. Technically, the recent chart low ($60.30 on 2/05/10) is an important support level to watch.
>>> The latest Featured Stock Update with an annotated graph appeared on 2/10/2010. click here.
|
|
C
A
S
I |
News |
Chart |
SEC
View all notes Alert
me of new notes
Company
Profile
|
GMCR
- NASDAQ
Green Mtn Coffee Roastrs
FOOD & BEVERAGE - Processed & Packaged Goods
|
$83.31
|
+0.51
|
878,886
59% DAV
1,484,600
|
12/28/2009
(Date
Featured) |
$77.49
(Price
Featured) |
PP = $76.50 |
G |
| MB = $80.33 |
Most Recent Note - 2/17/2010 4:45:50 PM
G - Still consolidating in a tight trading range with volume drying up, base building above its 50 DMA line and within close striking range of its 52-week high. Important initial support level to watch is recent lows in the $78 area.
>>> The latest Featured Stock Update with an annotated graph appeared on 2/2/2010. click here.
|
|
C
A
S
I |
News |
Chart |
SEC
View all notes Alert
me of new notes
Company
Profile
|
ISRG
- NASDAQ
Intuitive Surgical Inc
HEALTH SERVICES - Medical Appliances & Equipment
|
$341.15
|
+6.85
|
618,709
120% DAV
515,400
|
1/22/2010
(Date
Featured) |
$340.40
(Price
Featured) |
PP = $314.00 |
G |
| MB = $329.70 |
Most Recent Note - 2/17/2010 4:48:50 PM
G - Ended at a new high close, approaching its 52-week high with better volume behind today's 4th consecutive gain. Its 50 DMA line and prior chart highs in the $314 area define important technical support. ISRG was featured again most recently in the 1/22/10 mid-day report (read here).
>>> The latest Featured Stock Update with an annotated graph appeared on 2/5/2010. click here.
|
|
C
A
S
I |
News |
Chart |
SEC
View all notes Alert
me of new notes
Company
Profile
|
PEGA
- NASDAQ
Pegasystems Inc
COMPUTER SOFTWARE & SERVICES - Business Software & Services
|
$36.33
|
+0.45
|
85,525
44% DAV
193,700
|
1/4/2010
(Date
Featured) |
$34.00
(Price
Featured) |
PP = $36.19 |
G |
| MB = $38.00 |
Most Recent Note - 2/17/2010 4:50:17 PM
G - Closed near its session high with light volume behind its gain today. Quietly consolidating in the $35-36 area that was a previously a stubborn resistance level. Its 50 DMA line and prior chart lows near $32 define near-term support to watch.
>>> The latest Featured Stock Update with an annotated graph appeared on 2/8/2010. click here.
|
|
C
A
S
I |
News |
Chart |
SEC
View all notes Alert
me of new notes
Company
Profile
|
SIRO
- NASDAQ
Sirona Dental Systems
HEALTH SERVICES - Medical Instruments & Supplies
|
$35.09
|
-2.00
|
2,296,386
430% DAV
533,800
|
2/16/2010
(Date
Featured) |
$36.43
(Price
Featured) |
PP = $36.15 |
Y |
| MB = $37.96 |
Most Recent Note - 2/17/2010 4:53:55 PM
Y - Gapped down today after announcing the pricing of a secondary offering of shares from which the company will not receive any proceeds. The considerable loss led to a close below its pivot point, yet it was somewhat encouraging that it narrowly avoided a close below its prior high closes Featured in the 2/16/10 mid-day report (read here) as it broke out from a 10-week flat base. It has rallied from January 2009 lows near $10. Fundamentally, following 3 negative comparisons, its sales revenues in the Sep and Dec '09 quarters showed a return to growth. Quarterly earnings increases have been very strong along with great annual earnings growth in recent years (good C and A criteria). This high-ranked Medical - Systems/Equipment firm had previously completed Secondary Offerings on 8/06/09 and 12/11/09.
>>> The latest Featured Stock Update with an annotated graph appeared on 2/16/2010. click here.
|
|
C
A
S
I |
News |
Chart |
SEC
View all notes Alert
me of new notes
Company
Profile
|
|
|
|
THESE ARE NOT BUY RECOMMENDATIONS!
Comments contained in the body of this report are technical
opinions only. The material herein has been obtained
from sources believed to be reliable and accurate, however,
its accuracy and completeness cannot be guaranteed.
This site is not an investment advisor, hence it does
not endorse or recommend any securities or other investments.
Any recommendation contained in this report may not
be suitable for all investors and it is not to be deemed
an offer or solicitation on our part with respect to
the purchase or sale of any securities. All trademarks,
service marks and trade names appearing in this report
are the property of their respective owners, and are
likewise used for identification purposes only.
This report is a service available
only to active Paid Premium Members.
You may opt-out of receiving report notifications
at any time. Questions or comments may be submitted
by writing to Premium Membership Services 665 S.E. 10 Street, Suite 201 Deerfield Beach, FL 33441-5634 or by calling 1-800-965-8307
or 954-785-1121.
|
|
|


