You are not logged in.
This means you
CAN ONLY VIEW reports that were published prior to Monday, April 14, 2025.
You
MUST UPGRADE YOUR MEMBERSHIP if you want to see any current reports.
AFTER MARKET UPDATE - FRIDAY, FEBRUARY 14TH, 2014
Previous After Market Report Next After Market Report >>>
|
|
|
|
DOW |
+126.80 |
16,154.39 |
+0.79% |
|
Volume |
609,016,510 |
-3% |
|
Volume |
1,727,155,310 |
-18% |
|
NASDAQ |
+3.36 |
4,244.03 |
+0.08% |
|
Advancers |
2,036 |
65% |
|
Advancers |
1,359 |
51% |
|
S&P 500 |
+8.80 |
1,838.63 |
+0.48% |
|
Decliners |
1,002 |
32% |
|
Decliners |
1,217 |
46% |
|
Russell 2000 |
+1.43 |
1,149.21 |
+0.12% |
|
52 Wk Highs |
147 |
|
|
52 Wk Highs |
131 |
|
|
S&P 600 |
+1.13 |
648.62 |
+0.17% |
|
52 Wk Lows |
13 |
|
|
52 Wk Lows |
11 |
|
|
 |
Major Indices Ended Week Above 50-Day Moving Average Lines
Kenneth J. Gruneisen - Passed the CAN SLIM® Master's Exam
Overall, the major averages climbed higher for a second week. The NASDAQ led the way with a weekly advance of +2.9%. Both the Dow and S&P 500 finished with gains of +2.3% on the week. Behind Friday's gains for the indices the volume totals were reported lighter than the prior trading session's volume totals on the Nasdaq exchange and on the NYSE, a sign that institutional investors were not aggressively accumulating stocks. Breadth was positive as advancers led decliners by about a 2-1 ratio on the NYSE while the mix was only narrowly positive on the Nasdaq exchange. There were 49 high-ranked companies from the CANSLIM.net Leaders List that made new 52-week highs and appeared on the CANSLIM.net BreakOuts Page, down from the total of 59 stocks on the prior session. The list of stocks hitting new 52-week highs outnumbered new 52-week lows on the Nasdaq exchange and on the NYSE. There were gains for 4 of the 11 high-ranked companies currently included on the Featured Stocks Page. The Market (M criteria) environment has been noted as a "Confirmed Uptrend" after a brief correction recently raised caution flags. For any rally to be sustained it is critical for there to be healthy leadership, so it encouraging to see many stocks hitting new 52-week highs.
A stronger than anticipated reading on consumer sentiment overshadowed the biggest drop in factory production since May 2009. Industrial production declined by -0.3% in January versus expectations for an increase of +0.3%. On the upside, the University of Michigan consumer confidence survey unexpectedly held steady in February at the previous month's reading of 81.2. A separate report showed the import price index topped estimates for a loss of -0.1% as the gauge rose by +0.1% last month.
Encouraging earnings results provided an additional boost. Campbell Soup (CPB +4.9%) led consumer stocks higher after the company posted sales and earnings above expectations. Meanwhile, the materials sector staged a rally. Cliffs Natural Resources (CLF +5.75%) rallied after easily topping profit estimates thanks to lower costs and higher iron ore prices. A rally in the energy sector helped stocks advance. Occidental Petroleum (OXY +3.78%) increased both its quarterly dividend and stock buyback program which pushed its shares up. Meanwhile, index-heavyweight Exxon Mobil (XOM +2.93%) rose. Telecommunication stocks lagged behind as Verizon (VZ -1.69%) and AT&T (T -1.02%) fell. Industrials weighed on the market. Agilent Technologies Inc (A -8.04%) fell after the company cut its full-year earnings outlook.
Treasury prices declined with the 10-year note losing 2/32 to yield 2.74%.
The CANSLIM.net Featured Stocks Page shows the most action-worthy candidates and their latest notes and a Headline Link directs members to the latest detailed analysis with data-packed graphs annotated by a Certified expert along with links to additional resources. The Premium Member Homepage includes "dynamic archives" to all prior pay reports published. Watch for an announcement via email concerning the next WEBCAST.
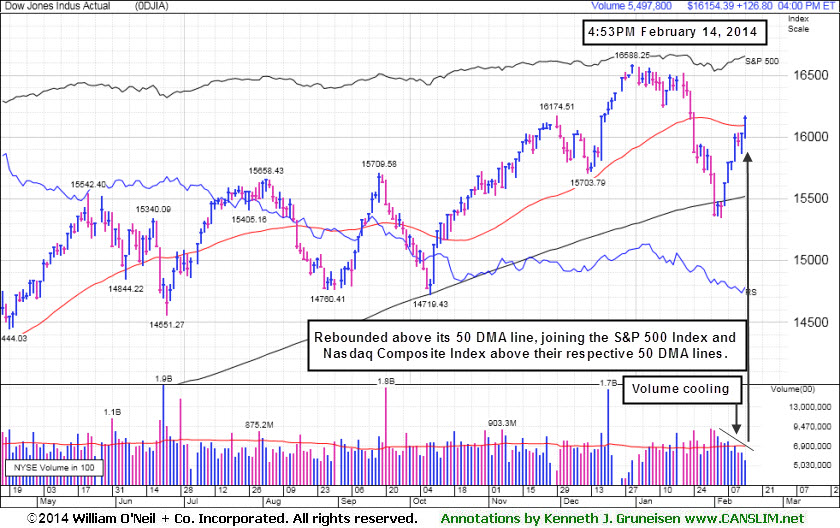
PICTURED: The Dow Jones Industrial Average finished -2.6% off its all-time high and rebounded above its 50-day moving average (DMA) line. That was an encouraging sign for the market's health (M criteria) as it joined both the S&P 500 Index and the Nasdaq Composite Index which already had rebounded above their respective 50 DMA lines. However, volume totals have been cooling behind it recent gains, revealing a lack of great institutional buying demand.
|
 Kenneth J. Gruneisen started out as a licensed stockbroker in August 1987, a couple of months prior to the historic stock market crash that took the Dow Jones Industrial Average down -22.6% in a single day. He has published daily fact-based fundamental and technical analysis on high-ranked stocks online for two decades. Through FACTBASEDINVESTING.COM, Kenneth provides educational articles, news, market commentary, and other information regarding proven investment systems that work in good times and bad.
Comments contained in the body of this report are technical opinions only and are not necessarily those of Gruneisen Growth Corp. The material herein has been obtained from sources believed to be reliable and accurate, however, its accuracy and completeness cannot be guaranteed. Our firm, employees, and customers may effect transactions, including transactions contrary to any recommendation herein, or have positions in the securities mentioned herein or options with respect thereto. Any recommendation contained in this report may not be suitable for all investors and it is not to be deemed an offer or solicitation on our part with respect to the purchase or sale of any securities. |
|
 |
Commodity-Linked Groups Led Mostly Positive Group Action
Kenneth J. Gruneisen - Passed the CAN SLIM® Master's Exam
The Retail Index ($RLX +0.22%) had a slightly positive bias while Financial shares were mixed as the Broker/Dealer Index ($XBD -0.46%) edged lower while the Bank Index ($BKX +0.45%) posted a modest gain. The Networking Index ($NWX +0.44%) and the Semiconductor Index ($SOX +0.56%) posted modest gains while the Biotechnology Index ($BTK -0.87%) lost ground. Commodity linked groups rounded out the mostly positive session with gains as the Gold & Silver Index ($XAU +2.43%) led the way and the Integrated Oil Index ($XOI +1.43%) outpaced the Oil Services Index ($OSX +0.50%).
Charts courtesy www.stockcharts.com
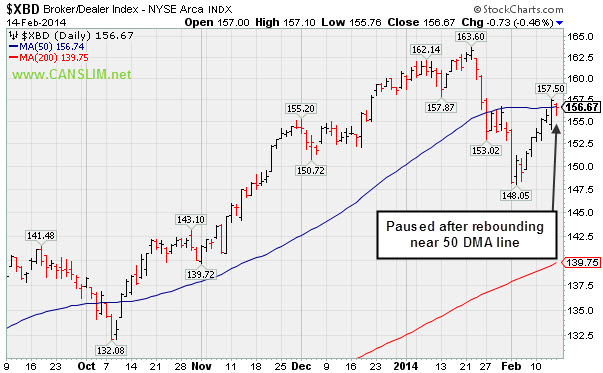
PICTURED: The Broker/Dealer Index ($XBD -0.46%) paused after rebounding near its 50-day moving average (DMA) line.
| Oil Services |
$OSX |
272.28 |
+1.35 |
+0.50% |
-3.11% |
| Integrated Oil |
$XOI |
1,453.58 |
+20.55 |
+1.43% |
-3.30% |
| Semiconductor |
$SOX |
559.12 |
+3.10 |
+0.56% |
+4.50% |
| Networking |
$NWX |
344.97 |
+1.51 |
+0.44% |
+6.49% |
| Broker/Dealer |
$XBD |
156.67 |
-0.73 |
-0.46% |
-2.42% |
| Retail |
$RLX |
898.42 |
+1.93 |
+0.22% |
-4.40% |
| Gold & Silver |
$XAU |
101.99 |
+2.42 |
+2.43% |
+21.20% |
| Bank |
$BKX |
68.83 |
+0.31 |
+0.45% |
-0.62% |
| Biotech |
$BTK |
2,633.63 |
-23.22 |
-0.87% |
+13.01% |
|
|
|
 |
Following Island Reversal Prior Highs May Act as Resistance
Kenneth J. Gruneisen - Passed the CAN SLIM® Master's Exam
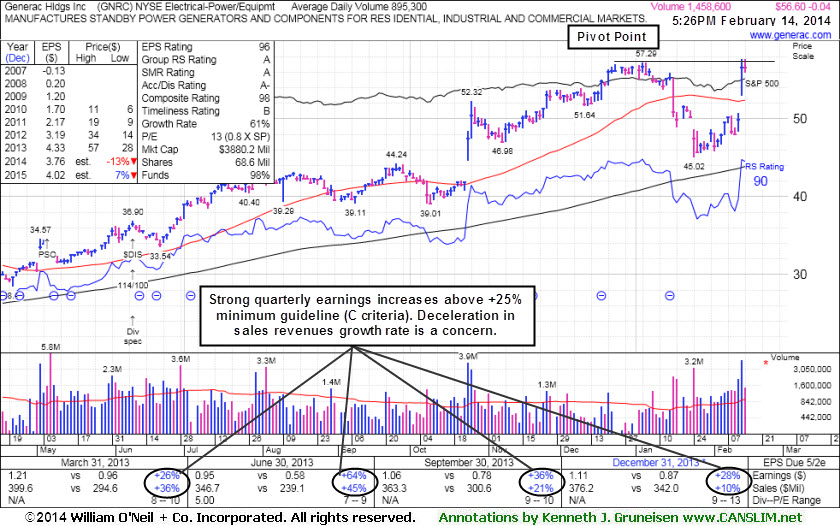
Generac Hldgs Inc (GNRC -$0.04 or -0.07% to $56.60) gapped up on the prior session for a considerable volume-driven gain completing a bullish "island reversal" pattern. The "island" was created by its 1/24/14 gap down and then the 2/13/14 gap up, which helped its technical stance improve by rebounding from below its 50-day moving average (DMA) line to challenge its 52-week high. In today's mid-day report (read here) it was highlighted in yellow as it returned to the Featured Stocks list with a new pivot point based on its 1/06/14 high plus 10 cents. It may likely encounter resistance near prior highs, however, any more convincing volume-driven gains into new high territory may confirm a new technical buy signal.
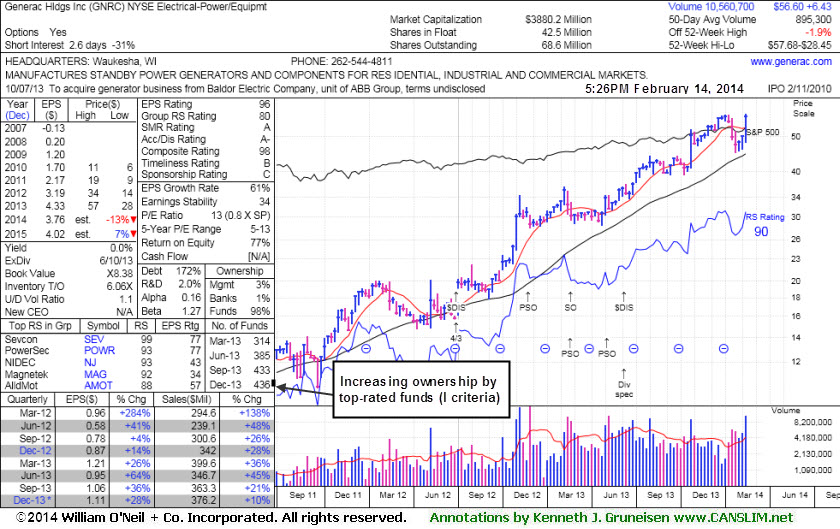
The high-ranked Electrical - Power/Equipment firm reported earnings +28% on +10% sales revenues for the Dec '13 quarter, continuing its strong earnings history satisfying the C criteria. Following its last appearance in this FSU section on 1/02/14 with annotated graphs under the headline, "Volume Totals Cooling While Holding Ground Near Highs", it violated its 50 DMA line and prior highs in the $52 area with a damaging volume-driven loss on 1/16/14 triggering worrisome technical sell signals. It had made limited progress since triggering an earlier technical buy signal.
Consensus estimates are calling for FY '14 earnings down -13%, and its currently low P/E valuation (0.8 X SP) suggests that the market has a timid outlook for future growth which is cause for some concern. Disciplined investors avoid chasing stocks if they get extended more than +5% above their pivot point, and they always limit losses by selling if any stock falls more than -7% from their purchase price.
GNRC has seen an increase in the number of top-rated funds owning its shares from 280 in Dec '12 to 436 in Dec '13, an encouraging sign concerning the I criteria. Its small float of only 42.5 million shares (S criteria) can contribute to greater price volatility in the event of institutional buying or selling.
|
|
|
Color Codes Explained :
Y - Better candidates highlighted by our
staff of experts.
G - Previously featured
in past reports as yellow but may no longer be buyable under the
guidelines.
***Last / Change / Volume data in this table is the closing quote data***
Symbol/Exchange
Company Name
Industry Group |
PRICE |
CHANGE
(%Change) |
Day High |
Volume
(% DAV)
(% 50 day avg vol) |
52 Wk Hi
% From Hi |
Featured
Date |
Price
Featured |
Pivot Featured |
|
Max Buy |
EQM
-
NYSE
E Q T Midstream Partners
ENERGY - Oil and Gas Pipelines
|
$65.00
|
+0.01
0.02% |
$65.88
|
159,033
144.58% of 50 DAV
50 DAV is 110,000
|
$67.80
-4.13%
|
12/12/2013
|
$53.17
|
PP = $56.51
|
|
MB = $59.34
|
 Most Recent Note - 2/14/2014 12:04:46 PM
G - Retreating from its 52-week high with volume running at an above average pace behind a 2nd consecutive loss today. Prior reports cautioned members - "It is extended from any sound base pattern. Prior highs in the $56 area define support to watch on pullbacks."
>>> FEATURED STOCK ARTICLE : Leader Still Extended From Any Sound Base - 2/7/2014
View all notes |
Set NEW NOTE alert |
CANSLIM.net Company Profile |
SEC
News |
Chart |
Request a new note
C
A N
S L
I M


|
FB
-
NASDAQ
Facebook Inc Cl A
INTERNET
|
$67.09
|
-0.24
-0.36% |
$67.58
|
36,730,909
56.60% of 50 DAV
50 DAV is 64,901,000
|
$67.33
-0.36%
|
12/12/2013
|
$51.40
|
PP = $54.93
|
|
MB = $57.68
|
Most Recent Note - 2/13/2014 4:17:40 PM
G - Finished near the session high today with a big gain on near average volume. It is extended well beyond the "secondary buy point" recently noted. Prior highs near $58 define important near-term support to watch on pullbacks. Disciplined investors avoid chasing extended stocks.
>>> FEATURED STOCK ARTICLE : Volume Totals Cooling While Holding Ground at Highs - 2/6/2014
View all notes |
Set NEW NOTE alert |
CANSLIM.net Company Profile |
SEC
News |
Chart |
Request a new note
C
A N
S L
I M
|
GNRC
-
NYSE
Generac Hldgs Inc
Electrical-Power/Equipmt
|
$56.60
|
-0.04
-0.07% |
$57.65
|
1,458,649
162.98% of 50 DAV
50 DAV is 895,000
|
$57.68
-1.87%
|
2/14/2014
|
$56.50
|
PP = $57.39
|
|
MB = $60.26
|
Most Recent Note - 2/14/2014 5:46:38 PM
Y - Reported earnings +28% on +10% sales revenues for the Dec '13 quarter, continuing its strong earnings history satisfying the C criteria. Gapped up on the prior session completing a bullish "island reversal" helping its technical stance improve by rebounding from below its 50 DMA line to touch new 52-week highs. Highlighted in yellow in the mid-day report (read here) with a new pivot point based on its 1/06/14 high plus 10 cents. Convincing volume-driven gains into new high territory may confirm a new technical buy signal. See the latest FSU analysis for more details and new annotated graphs.
>>> FEATURED STOCK ARTICLE : Following Island Reversal Prior Highs May Act as Resistance - 2/14/2014
View all notes |
Set NEW NOTE alert |
CANSLIM.net Company Profile |
SEC
News |
Chart |
Request a new note
C
A N
S L
I M
|
JAZZ
-
NASDAQ
Jazz Pharmaceuticals Plc
DRUGS - Biotechnology
|
$160.10
|
-0.66
-0.41% |
$162.14
|
551,854
60.38% of 50 DAV
50 DAV is 914,000
|
$163.68
-2.19%
|
9/30/2013
|
$93.20
|
PP = $89.10
|
|
MB = $93.56
|
Most Recent Note - 2/12/2014 1:29:08 PM
G - Hitting new 52-week and all-time highs with today's 4th consecutive gain. It is extended from any sound base. Its 50 DMA line and recent lows in the $135 area define important support to watch on pullbacks.
>>> FEATURED STOCK ARTICLE : Consolidating After Getting Very Extended - 2/5/2014
View all notes |
Set NEW NOTE alert |
CANSLIM.net Company Profile |
SEC
News |
Chart |
Request a new note
C
A N
S L
I M
|
KORS
-
NYSE
Michael Kors Hldgs Ltd
RETAIL - Apparel Stores
|
$98.46
|
+0.05
0.05% |
$98.62
|
1,904,253
46.04% of 50 DAV
50 DAV is 4,136,000
|
$98.81
-0.35%
|
2/4/2014
|
$90.92
|
PP = $84.68
|
|
MB = $88.91
|
Most Recent Note - 2/13/2014 4:19:08 PM
G - Hit another new 52-week high today, getting very extended from its prior base. Prior highs in the $84 area define the nearest chart support level. Disciplined investors avoid chasing extended stocks.
>>> FEATURED STOCK ARTICLE : Down on Higher Volume Ahead of Quarterly Earnings Report - 2/3/2014
View all notes |
Set NEW NOTE alert |
CANSLIM.net Company Profile |
SEC
News |
Chart |
Request a new note
C
A N
S L
I M
|
Symbol/Exchange
Company Name
Industry Group |
PRICE |
CHANGE
(%Change) |
Day High |
Volume
(% DAV)
(% 50 day avg vol) |
52 Wk Hi
% From Hi |
Featured
Date |
Price
Featured |
Pivot Featured |
|
Max Buy |
PCLN
-
NASDAQ
Priceline.com Inc
INTERNET - Internet Software and Services
|
$1,279.98
|
+3.91
0.31% |
$1,284.70
|
910,025
144.45% of 50 DAV
50 DAV is 630,000
|
$1,282.60
-0.20%
|
12/18/2013
|
$1,156.20
|
PP = $1,198.85
|
|
MB = $1,258.79
|
Most Recent Note - 2/14/2014 12:22:09 PM
G - Perched at its 52-week high with above average volume behind its 7th consecutive gain. Rallying with no resistance remaining due to overhead supply. Color code was changed to green after rallying above its "max buy" level. See the latest FSU analysis for more details and new annotated graphs.
>>> FEATURED STOCK ARTICLE : Extended From Prior Highs After 6th Straight Gain - 2/13/2014
View all notes |
Set NEW NOTE alert |
CANSLIM.net Company Profile |
SEC
News |
Chart |
Request a new note
C
A N
S L
I M
|
RGR
-
NYSE
Sturm Ruger & Co Inc
CONSUMER DURABLES - Sporting Goods
|
$73.44
|
+0.68
0.93% |
$74.37
|
280,805
53.38% of 50 DAV
50 DAV is 526,000
|
$85.93
-14.54%
|
1/8/2014
|
$78.87
|
PP = $80.38
|
|
MB = $84.40
|
Most Recent Note - 2/10/2014 1:57:28 PM
G- Today's 3rd consecutive gain on light volume has it rebounding near its 50 DMA line which may now act as resistance. Faces overhead supply up through the $85 level after recent distributional action.
>>> FEATURED STOCK ARTICLE : Slumped Into Prior Base Negating Breakout and Violated 50-Day Average - 2/4/2014
View all notes |
Set NEW NOTE alert |
CANSLIM.net Company Profile |
SEC
News |
Chart |
Request a new note
C
A N
S L
I M
|
SFUN
-
NYSE
Soufun Hldgs Ltd Ads A
INTERNET - Internet Information Providers
|
$79.00
|
-2.51
-3.08% |
$81.74
|
1,225,554
85.17% of 50 DAV
50 DAV is 1,439,000
|
$95.39
-17.18%
|
10/17/2013
|
$58.02
|
PP = $53.87
|
|
MB = $56.56
|
Most Recent Note - 2/13/2014 4:14:55 PM
G - Rebounded and closed above its 50 DMA line with above average volume behind today's considerable gain. The session helped its technical stance and outlook improve. It was not formed a sound base.
>>> FEATURED STOCK ARTICLE : 50-Day Moving Average Defines Near Term Support After Great Rally - 1/31/2014
View all notes |
Set NEW NOTE alert |
CANSLIM.net Company Profile |
SEC
News |
Chart |
Request a new note
C
A N
S L
I M
|
SILC
-
NASDAQ
Silicom Ltd
COMPUTER HARDWARE - Networking andamp; Communication Dev
|
$65.78
|
-0.12
-0.18% |
$66.24
|
36,185
56.54% of 50 DAV
50 DAV is 64,000
|
$66.39
-0.92%
|
12/23/2013
|
$44.62
|
PP = $46.25
|
|
MB = $48.56
|
Most Recent Note - 2/12/2014 12:53:14 PM
G - Inching higher for another new 52-week high with today's 7th consecutive gain on ever-increasing volume. Extended from any sound base while on track for a 9th consecutive weekly gain. See the latest FSU analysis for more details and new annotated graphs.
>>> FEATURED STOCK ARTICLE : Stubbornly Held Ground Following Breakaway Gap - 2/11/2014
View all notes |
Set NEW NOTE alert |
CANSLIM.net Company Profile |
SEC
News |
Chart |
Request a new note
C
A N
S L
I M
|
ULTI
-
NASDAQ
Ultimate Software Group
INTERNET - Internet Software and Services
|
$163.65
|
-1.22
-0.74% |
$165.00
|
190,901
98.40% of 50 DAV
50 DAV is 194,000
|
$168.43
-2.84%
|
1/27/2014
|
$153.75
|
PP = $162.98
|
|
MB = $171.13
|
Most Recent Note - 2/13/2014 4:22:17 PM
Y - Considerable gain today with near average volume for a best-ever close. Found support above its 50 DMA line following a worrisome "negative reversal" on 2/05/14. Fundamentals remain strong after solid Dec '13 earnings. See the latest FSU analysis for more details and new annotated graphs.
>>> FEATURED STOCK ARTICLE : Stalled and Encountering Distributional Pressure - 2/12/2014
View all notes |
Set NEW NOTE alert |
CANSLIM.net Company Profile |
SEC
News |
Chart |
Request a new note
C
A N
S L
I M
|
Symbol/Exchange
Company Name
Industry Group |
PRICE |
CHANGE
(%Change) |
Day High |
Volume
(% DAV)
(% 50 day avg vol) |
52 Wk Hi
% From Hi |
Featured
Date |
Price
Featured |
Pivot Featured |
|
Max Buy |
VRX
-
NYSE
Valeant Pharmaceuticals
DRUGS - Drug Manufacturers - Other
|
$139.57
|
-2.22
-1.57% |
$142.24
|
1,231,249
93.35% of 50 DAV
50 DAV is 1,319,000
|
$142.82
-2.28%
|
9/11/2013
|
$100.26
|
PP = $105.50
|
|
MB = $110.78
|
Most Recent Note - 2/10/2014 1:59:16 PM
G - Hovering quietly near all-time highs, extended from any sound base. Its 50 DMA line ($122) defines near-term support to watch.
>>> FEATURED STOCK ARTICLE : Hovering Near All-Time Highs Extended From Sound Base - 2/10/2014
View all notes |
Set NEW NOTE alert |
CANSLIM.net Company Profile |
SEC
News |
Chart |
Request a new note
C
A N
S L
I M
|
|
|
|
THESE ARE NOT BUY RECOMMENDATIONS!
Comments contained in the body of this report are technical
opinions only. The material herein has been obtained
from sources believed to be reliable and accurate, however,
its accuracy and completeness cannot be guaranteed.
This site is not an investment advisor, hence it does
not endorse or recommend any securities or other investments.
Any recommendation contained in this report may not
be suitable for all investors and it is not to be deemed
an offer or solicitation on our part with respect to
the purchase or sale of any securities. All trademarks,
service marks and trade names appearing in this report
are the property of their respective owners, and are
likewise used for identification purposes only.
This report is a service available
only to active Paid Premium Members.
You may opt-out of receiving report notifications
at any time. Questions or comments may be submitted
by writing to Premium Membership Services 665 S.E. 10 Street, Suite 201 Deerfield Beach, FL 33441-5634 or by calling 1-800-965-8307
or 954-785-1121.
|
|
|

