You are not logged in.
This means you
CAN ONLY VIEW reports that were published prior to Monday, April 14, 2025.
You
MUST UPGRADE YOUR MEMBERSHIP if you want to see any current reports.
AFTER MARKET UPDATE - WEDNESDAY, FEBRUARY 13TH, 2013
Previous After Market Report Next After Market Report >>>
|
|
|
|
DOW |
-35.79 |
13,982.91 |
-0.26% |
|
Volume |
657,145,780 |
+7% |
|
Volume |
1,748,063,520 |
+3% |
|
NASDAQ |
+10.39 |
3,196.88 |
+0.33% |
|
Advancers |
1,765 |
56% |
|
Advancers |
1,347 |
52% |
|
S&P 500 |
+0.90 |
1,520.33 |
+0.06% |
|
Decliners |
1,251 |
40% |
|
Decliners |
1,095 |
43% |
|
Russell 2000 |
+3.06 |
920.58 |
+0.33% |
|
52 Wk Highs |
340 |
|
|
52 Wk Highs |
198 |
|
|
S&P 600 |
+1.66 |
515.60 |
+0.32% |
|
52 Wk Lows |
6 |
|
|
52 Wk Lows |
23 |
|
|
 |
Indices Ended Mixed and Little Changed After Choppy Session
Kenneth J. Gruneisen - Passed the CAN SLIM® Master's Exam
On Wednesday the major averages finished mixed after a choppy trading session. The volume totals were reported higher on the NYSE and on the Nasdaq exchange. Breadth was positive as advancers led decliners by nearly a 3-2 margin on the NYSE and by a 6-5 margin on the Nasdaq exchange. The total number of stocks hitting new 52-week highs easily outnumbered new 52-week lows on the NYSE and on the Nasdaq exchange, and the new lows total was in the single digits on the NYSE. There were 83 high-ranked companies from the CANSLIM.net Leaders List making new 52-week highs and appearing on the CANSLIM.net BreakOuts Page, up from the prior session total of 66 stocks. There were gains for 10 of the 13 high-ranked companies currently included on the Featured Stocks Page.
The market searched for direction throughout the day as investors digested the State of the Union address and economic data. President Obama's agenda focused on job creation, a strengthening of the middle class as well as tax hikes and spending cuts. Economic data was mixed. Retail sales posted a modest uptick in January and import prices advanced for the first time in three months. In addition, business inventories rose in December at the slowest pace in six months.
Sector action varied. Telecommunication was one of the biggest decliners as Sprint Nextel Corp (S -0.85%) pulled back. Financials were lower after a two-day rally as Citigroup Inc (C -0.79%) fell. Gains in industrials limited losses. General Electric (GE +3.59%) rallied after agreeing to sell its stake in NBC Universal and boosting its share repurchase plan. Materials were held back by Cliffs Natural Resources Inc (CLF -19.99%) dove after posting a large fourth-quarter loss and slashing its dividend. Notable profit tallies out after the close included Cisco Systems Inc (CSCO +0.81%), Whole Foods Market Inc (WFM +0.82%) and MetLife, Inc. (MET +1.0%)
In fixed-income, Treasuries were lower after a government auction of 10-year notes saw weak demand. The 10-year note was down 11/32 to yield 2.02%.
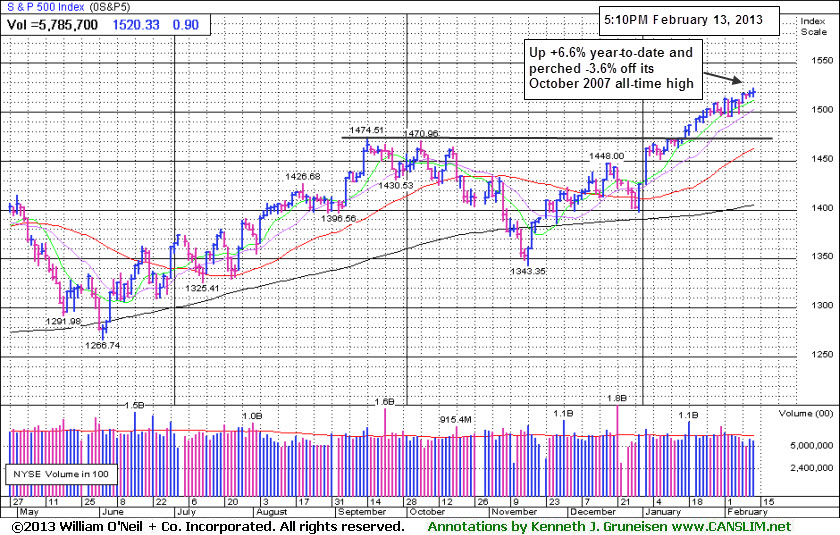
The latest rally has produced a few action worthy candidates meeting all of the fact-based investment system's criteria. Selectivity and discipline are required, as always. Investors may consider new buying efforts in stocks meeting all key criteria, as the market's (M criteria) confirmed uptrend has been comprised by great leadership (stocks hitting new 52-week highs) in the broader market. Widespread gains helped all of the major averages blast higher, and the benchmark S&P 500 Index is perched at its best level in more than five years and off its October 2007 all-time high.
Watch for an announcement via email concerning the next WEBCAST. The webcast will also be available via an updated link highlighted at the top of the Premium Member Homepage.
PICTURED: The S&P 500 Index stands -3.6% below its all-time high of October 2007 while up +6.6% year-to-date. Subsequent gains into new all-time high territory may help the broader market gain more momentum as headlines may attract greater interest in stocks overall.
|
 Kenneth J. Gruneisen started out as a licensed stockbroker in August 1987, a couple of months prior to the historic stock market crash that took the Dow Jones Industrial Average down -22.6% in a single day. He has published daily fact-based fundamental and technical analysis on high-ranked stocks online for two decades. Through FACTBASEDINVESTING.COM, Kenneth provides educational articles, news, market commentary, and other information regarding proven investment systems that work in good times and bad.
Comments contained in the body of this report are technical opinions only and are not necessarily those of Gruneisen Growth Corp. The material herein has been obtained from sources believed to be reliable and accurate, however, its accuracy and completeness cannot be guaranteed. Our firm, employees, and customers may effect transactions, including transactions contrary to any recommendation herein, or have positions in the securities mentioned herein or options with respect thereto. Any recommendation contained in this report may not be suitable for all investors and it is not to be deemed an offer or solicitation on our part with respect to the purchase or sale of any securities. |
|
 |
Retail Index Was a Positive Influence Amid Mixed Group Action
Kenneth J. Gruneisen - Passed the CAN SLIM® Master's Exam
The Retail Index ($RLX +0.64%) was a positive influence on the major averages and the Broker/Dealer Index ($XBD +0.16%) inched higher, but the Bank Index ($BKX -0.59%) offset some of the other groups' gains. The Networking Index ($NWX -0.57%) slid while the tech sector's Internet Index ($IIX +0.23%), Semiconductor Index ($SOX +0.28%), and Biotechnology Index ($BTK +0.38%) each posted small gains. The Oil Services Index ($OSX +0.68%) outpaced the Integrated Oil Index ($XOI +0.10%) as energy-related shares had a slightly positive bias. Defensive groups were mixed as the Gold & Silver Index ($XAU -1.50%) slumped while the Healthcare Index ($HMO +0.45%) posted a modest gain.
Charts courtesy www.stockcharts.com
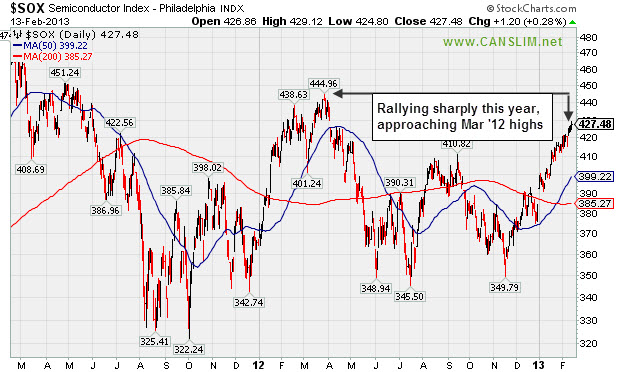
PICTURED: The Semiconductor Index ($SOX +0.28%) has rallied sharply this year, approaching its March 2012 highs.
| Oil Services |
$OSX |
248.17 |
+1.68 |
+0.68% |
+12.72% |
| Healthcare |
$HMO |
2,809.38 |
+12.62 |
+0.45% |
+11.74% |
| Integrated Oil |
$XOI |
1,353.71 |
+1.38 |
+0.10% |
+9.01% |
| Semiconductor |
$SOX |
427.48 |
+1.20 |
+0.28% |
+11.31% |
| Networking |
$NWX |
244.68 |
-1.41 |
-0.57% |
+8.00% |
| Internet |
$IIX |
357.84 |
+0.81 |
+0.23% |
+9.43% |
| Broker/Dealer |
$XBD |
108.61 |
+0.18 |
+0.16% |
+15.14% |
| Retail |
$RLX |
707.26 |
+4.51 |
+0.64% |
+8.30% |
| Gold & Silver |
$XAU |
148.36 |
-2.26 |
-1.50% |
-10.41% |
| Bank |
$BKX |
55.38 |
-0.33 |
-0.59% |
+8.00% |
| Biotech |
$BTK |
1,672.16 |
+6.34 |
+0.38% |
+8.09% |
|
|
|
 |
Slumping and Relative Strength Waning After Failed Breakout
Kenneth J. Gruneisen - Passed the CAN SLIM® Master's Exam
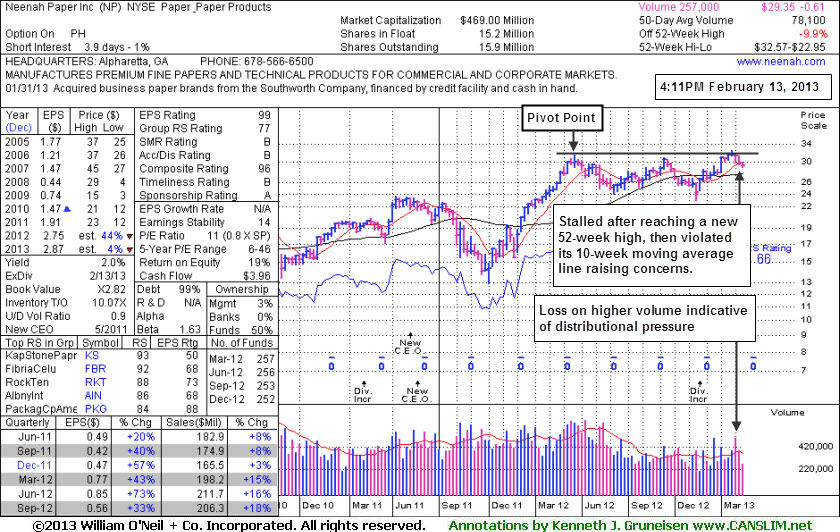
Neenah Paper Inc (NP -$0.10 or -0.34% to $29.35) stalled after recently reaching a new 52-week high and then it slumped below its pivot point and traded below its 10-week moving average line defining important chart support, raising more concerns. Its Relative Strength rating has slumped to a 66, well below the 80+ minimum guideline for buy candidates under the fact-based investment system, and its color code was noted as it was changed to green due to the technical deterioration. It faces a little resistance due to the small amount of overhead supply up through the $32 area that may hinder its ability to rally, yet it remains perched only -9.9% off its 52-week high.
The "negative reversal" for a loss on heavy volume after hitting a new 52-week high on 1/25/13 was noted as a worrisome sign of distributional pressure as it failed to finish strong and did not clinch a technical buy signal. The stock's last appearance in this FSU section on 1/25/13 included an annotated daily graph under the headline, "Featured in Mid-day Report and Finished With Negative Reversal Below Pivot Point". It was the observed - "A negative reversal indicates that it encountered a rush of willing sellers when it was a good position to close the session above its pivot point. Disciplined investors might be watching for subsequent gains with great volume conviction while rising above its pivot point and into new high territory as proof of lurking institutional buying demand which might lead to a more meaningful and sustained advance."
The weekly chart below illustrates the distributional action of late, as opposed to showing signs of institutional accumulation. The number of top-rated funds reportedly owning its shares has not shown any favorable trend, in fact, falling from 257 in Mar '12 to 252 in Dec '12, is a discouraging sign concerning the I criteria. Without any signs of fresh and substantial buying demand there is little reason for investors to take action.
|
|
|
Color Codes Explained :
Y - Better candidates highlighted by our
staff of experts.
G - Previously featured
in past reports as yellow but may no longer be buyable under the
guidelines.
***Last / Change / Volume data in this table is the closing quote data***
Symbol/Exchange
Company Name
Industry Group |
PRICE |
CHANGE
(%Change) |
Day High |
Volume
(% DAV)
(% 50 day avg vol) |
52 Wk Hi
% From Hi |
Featured
Date |
Price
Featured |
Pivot Featured |
|
Max Buy |
CELG
-
NASDAQ
Celgene Corp
DRUGS - Drug Manufacturers - Major
|
$99.07
|
+0.11
0.11% |
$99.40
|
2,264,600
60.10% of 50 DAV
50 DAV is 3,768,300
|
$102.29
-3.15%
|
12/11/2012
|
$82.24
|
PP = $81.34
|
|
MB = $85.41
|
Most Recent Note - 2/8/2013 4:00:02 PM
G - Still perched near its all-time high, holding its ground stubbornly while very extended from its prior base.
>>> The latest Featured Stock Update with an annotated graph appeared on 2/4/2013. Click here.
View all notes |
Alert me of new notes |
CANSLIM.net Company Profile |
SEC |
Zacks Reports |
StockTalk |
News |
Chart |
Request a new note
C
A N
S L
I M


|
CFNL
-
NASDAQ
Cardinal Financial Corp
BANKING - Regional - Southeast Banks
|
$16.58
|
+0.01
0.06% |
$16.66
|
126,632
61.00% of 50 DAV
50 DAV is 207,600
|
$16.90
-1.89%
|
12/3/2012
|
$15.20
|
PP = $16.31
|
|
MB = $17.13
|
Most Recent Note - 2/12/2013 1:43:34 PM
Y - Rallying from its 50 DMA line with volume running at an above average pace behind today's considerable gain while trading within close striking distance of its best-ever close. Subsequent losses leading to a damaging 50 DMA line violation or a slump below the recent low ($15.74 on 1/18/13) would raise concerns and trigger technical sell signals.
>>> The latest Featured Stock Update with an annotated graph appeared on 1/31/2013. Click here.
View all notes |
Alert me of new notes |
CANSLIM.net Company Profile |
SEC |
Zacks Reports |
StockTalk |
News |
Chart |
Request a new note
C
A N
S L
I M
|
CMCSA
-
NASDAQ
Comcast Corp Cl A
MEDIA - CATV Systems
|
$40.13
|
+1.16
2.98% |
$42.00
|
57,068,293
467.23% of 50 DAV
50 DAV is 12,214,300
|
$40.28
-0.37%
|
12/3/2012
|
$37.08
|
PP = $38.06
|
|
MB = $39.96
|
 Most Recent Note - 2/13/2013 12:13:47 PM
G - Reported earnings +11% on +6% sales revenues for the Dec '12 quarter, below the +25% minimum earnings guideline (C criteria), raising fundamental concerns. Off early highs after a considerable gap up today for a new 52-week high, despite sub par earnings results, after recently finding support near prior highs and at its 50 DMA line. Color code was changed to green as it rallied beyond its "max buy" level.
>>> The latest Featured Stock Update with an annotated graph appeared on 1/29/2013. Click here.
View all notes |
Alert me of new notes |
CANSLIM.net Company Profile |
SEC |
Zacks Reports |
StockTalk |
News |
Chart |
Request a new note
C
A N
S L
I M
|
KORS
-
NYSE
Michael Kors Hldgs Ltd
RETAIL - Apparel Stores
|
$61.35
|
-0.65
-1.05% |
$63.13
|
6,350,667
154.88% of 50 DAV
50 DAV is 4,100,400
|
$64.80
-5.32%
|
1/23/2013
|
$54.98
|
PP = $58.72
|
|
MB = $61.66
|
Most Recent Note - 2/12/2013 12:33:10 PM
Y - Reported earnings +129% on +70% sales revenues for the Dec '12 quarter versus the year ago period. Today's considerable "breakaway gap" for a new high with heavy volume while blasting above the pivot point triggered a convincing technical buy signal. As previously noted - "A breakaway gap has been noted as the one exception which allows for new buying efforts more than +5% above prior highs, however risk increases the further one chases any stock above prior highs."
>>> The latest Featured Stock Update with an annotated graph appeared on 2/7/2013. Click here.
View all notes |
Alert me of new notes |
CANSLIM.net Company Profile |
SEC |
Zacks Reports |
StockTalk |
News |
Chart |
Request a new note
C
A N
S L
I M
|
LNKD
-
NYSE
Linkedin Corp Class A
INTERNET - Internet Information Providers
|
$157.71
|
+2.71
1.75% |
$157.77
|
2,597,687
126.51% of 50 DAV
50 DAV is 2,053,300
|
$158.90
-0.75%
|
2/8/2013
|
$147.04
|
PP = $127.55
|
|
MB = $133.93
|
Most Recent Note - 2/12/2013 12:42:02 PM
G - Quickly got very extended from prior highs and its color code was changed to green. It was highlighted in yellow with new pivot point cited based on its 1/28/13 high plus 10 cents in the 2/08/13 mid-day report. See the 2/08/13 analysis for more details and a new annotated graph under the headline "Quickly Extended From Prior Highs Following Big Breakaway Gap".
>>> The latest Featured Stock Update with an annotated graph appeared on 2/8/2013. Click here.
View all notes |
Alert me of new notes |
CANSLIM.net Company Profile |
SEC |
Zacks Reports |
StockTalk |
News |
Chart |
Request a new note
C
A N
S L
I M
|
Symbol/Exchange
Company Name
Industry Group |
PRICE |
CHANGE
(%Change) |
Day High |
Volume
(% DAV)
(% 50 day avg vol) |
52 Wk Hi
% From Hi |
Featured
Date |
Price
Featured |
Pivot Featured |
|
Max Buy |
MIDD
-
NASDAQ
Middleby Corp
MANUFACTURING - Diversified Machinery
|
$149.19
|
+0.59
0.40% |
$149.83
|
51,268
55.48% of 50 DAV
50 DAV is 92,400
|
$151.49
-1.52%
|
10/8/2012
|
$118.46
|
PP = $122.67
|
|
MB = $128.80
|
Most Recent Note - 2/12/2013 1:47:16 PM
G - Touched another new all-time high today then reversed into the red after getting even more extended from any sound base. Prior highs and its 50 DMA line define important near-term chart support in the $132-134 area.
>>> The latest Featured Stock Update with an annotated graph appeared on 1/30/2013. Click here.
View all notes |
Alert me of new notes |
CANSLIM.net Company Profile |
SEC |
Zacks Reports |
StockTalk |
News |
Chart |
Request a new note
C
A N
S L
I M
|
N
-
NYSE
Netsuite Inc
DIVERSIFIED SERVICES - Business/Management Services
|
$66.38
|
+0.14
0.21% |
$66.49
|
241,441
67.31% of 50 DAV
50 DAV is 358,700
|
$75.75
-12.37%
|
12/12/2012
|
$64.75
|
PP = $67.12
|
|
MB = $70.48
|
Most Recent Note - 2/12/2013 1:50:54 PM
G - Trading near its 50 DMA line ($66.17 now) today, where any more damaging losses may trigger a technical sell signal. Concerns were raised following a worrisome "negative reversal" on 2/01/13 after initially gapping up for a new 52-week high. Recent notes have repeatedly cautioned - "Reported earnings +20% on +33% sales revenues for the Dec '12 quarter, below the +25% minimum earnings guideline (C criteria) raising fundamental concerns."
>>> The latest Featured Stock Update with an annotated graph appeared on 2/5/2013. Click here.
View all notes |
Alert me of new notes |
CANSLIM.net Company Profile |
SEC |
Zacks Reports |
StockTalk |
News |
Chart |
Request a new note
C
A N
S L
I M
|
NP
-
NYSE
Neenah Paper Inc
CONSUMER NON-DURABLES - Paper and Paper Products
|
$29.35
|
-0.10
-0.34% |
$29.65
|
130,330
166.88% of 50 DAV
50 DAV is 78,100
|
$32.57
-9.89%
|
1/25/2013
|
$31.80
|
PP = $31.76
|
|
MB = $33.35
|
Most Recent Note - 2/13/2013 6:01:45 PM
G - Its Relative Strength rating has slumped to a 66, well below the 80+ minimum guideline for buy candidates under the fact-based investment system, and its color code was changed to green. See the latest FSU analysis for more details and a new annotated graph.
>>> The latest Featured Stock Update with an annotated graph appeared on 2/13/2013. Click here.
View all notes |
Alert me of new notes |
CANSLIM.net Company Profile |
SEC |
Zacks Reports |
StockTalk |
News |
Chart |
Request a new note
C
A N
S L
I M
|
NSR
-
NYSE
Neustar Inc
TELECOMMUNICATIONS - Diversified Communication Serv
|
$46.58
|
+0.03
0.06% |
$46.69
|
261,994
59.01% of 50 DAV
50 DAV is 444,000
|
$47.24
-1.40%
|
12/11/2012
|
$41.85
|
PP = $41.41
|
|
MB = $43.48
|
Most Recent Note - 2/12/2013 1:55:41 PM
G - Hovering near its 52-week high, holding its ground stubbornly after getting extended from its prior base. Its 50 DMA line (now $43.11) defines near-term support above its prior base.
>>> The latest Featured Stock Update with an annotated graph appeared on 2/1/2013. Click here.
View all notes |
Alert me of new notes |
CANSLIM.net Company Profile |
SEC |
Zacks Reports |
StockTalk |
News |
Chart |
Request a new note
C
A N
S L
I M
|
RAX
-
NYSE
Rackspace Hosting Inc
INTERNET - Internet Software and; Services
|
$60.30
|
-14.68
-19.58% |
$65.40
|
15,869,784
1,288.55% of 50 DAV
50 DAV is 1,231,600
|
$81.36
-25.88%
|
12/18/2012
|
$71.88
|
PP = $70.10
|
|
MB = $73.61
|
Most Recent Note - 2/13/2013 10:02:03 AM
Reported earnings +17% on +25% sales revenues for the Dec '12 quarter, below the +25% minimum earnings guideline (C criteria), and it gapped down today for a damaging loss violating its 50 DMA line and triggering a technical sell signal. Based on fundamental and technical deterioration it will be dropped from the Featured Stocks list tonight.
>>> The latest Featured Stock Update with an annotated graph appeared on 2/6/2013. Click here.
View all notes |
Alert me of new notes |
CANSLIM.net Company Profile |
SEC |
Zacks Reports |
StockTalk |
News |
Chart |
Request a new note
C
A N
S L
I M
|
Symbol/Exchange
Company Name
Industry Group |
PRICE |
CHANGE
(%Change) |
Day High |
Volume
(% DAV)
(% 50 day avg vol) |
52 Wk Hi
% From Hi |
Featured
Date |
Price
Featured |
Pivot Featured |
|
Max Buy |
RNF
-
NYSE
Rentech Nitrogen Ptnr Lp
CHEMICALS - Agricultural Chemicals
|
$43.14
|
+1.42
3.40% |
$43.31
|
642,858
182.16% of 50 DAV
50 DAV is 352,900
|
$49.18
-12.28%
|
11/1/2012
|
$39.11
|
PP = $40.15
|
|
MB = $42.16
|
Most Recent Note - 2/13/2013 2:44:12 PM
G - Rebounding above its 50 DMA line today, a prompt and encouraging sign of support near that important short-term average and prior highs in the $41 area. Subsequent damaging losses below the prior session's low ($40.95) would raise more serious concerns and trigger additional worrisome technical sell signals. See the latest FSU analysis for more details and a new annotated graph.
>>> The latest Featured Stock Update with an annotated graph appeared on 2/12/2013. Click here.
View all notes |
Alert me of new notes |
CANSLIM.net Company Profile |
SEC |
Zacks Reports |
StockTalk |
News |
Chart |
Request a new note
C
A N
S L
I M
|
SFUN
-
NYSE
Soufun Hldgs Ltd Ads A
INTERNET - Internet Information Providers
|
$27.25
|
+0.19
0.70% |
$27.46
|
115,859
37.21% of 50 DAV
50 DAV is 311,400
|
$29.16
-6.55%
|
3/11/2013
|
$27.46
|
PP = $29.26
|
|
MB = $30.72
|
Most Recent Note - 2/11/2013 5:40:24 PM
Y - Highlighted in yellow with pivot point cited based on its 1/08/13 high plus 10 cents in the earlier mid-day report. Disciplined investors may watch for subsequent volume-driven gains to confirm a proper technical buy signal. See the latest FSU analysis for more details and an annotated graph.
>>> The latest Featured Stock Update with an annotated graph appeared on 2/11/2013. Click here.
View all notes |
Alert me of new notes |
CANSLIM.net Company Profile |
SEC |
Zacks Reports |
StockTalk |
News |
Chart |
Request a new note
C
A N
S L
I M
|
VRX
-
NYSE
Valeant Pharmaceuticals
DRUGS - Drug Manufacturers - Other
|
$67.50
|
+0.07
0.10% |
$67.81
|
916,362
61.68% of 50 DAV
50 DAV is 1,485,700
|
$67.98
-0.71%
|
12/20/2012
|
$60.24
|
PP = $61.21
|
|
MB = $64.27
|
Most Recent Note - 2/8/2013 7:06:03 PM
G - Hit a new 52-week high with lighter than average volume behind today's 4th consecutive gain. It is extended from its prior base, and its 50 DMA coincides with prior highs near $61 defining near-term chart support to watch on pullbacks.
>>> The latest Featured Stock Update with an annotated graph appeared on 1/28/2013. Click here.
View all notes |
Alert me of new notes |
CANSLIM.net Company Profile |
SEC |
Zacks Reports |
StockTalk |
News |
Chart |
Request a new note
C
A N
S L
I M
|
|
|
|
THESE ARE NOT BUY RECOMMENDATIONS!
Comments contained in the body of this report are technical
opinions only. The material herein has been obtained
from sources believed to be reliable and accurate, however,
its accuracy and completeness cannot be guaranteed.
This site is not an investment advisor, hence it does
not endorse or recommend any securities or other investments.
Any recommendation contained in this report may not
be suitable for all investors and it is not to be deemed
an offer or solicitation on our part with respect to
the purchase or sale of any securities. All trademarks,
service marks and trade names appearing in this report
are the property of their respective owners, and are
likewise used for identification purposes only.
This report is a service available
only to active Paid Premium Members.
You may opt-out of receiving report notifications
at any time. Questions or comments may be submitted
by writing to Premium Membership Services 665 S.E. 10 Street, Suite 201 Deerfield Beach, FL 33441-5634 or by calling 1-800-965-8307
or 954-785-1121.
|
|
|

