You are not logged in.
This means you
CAN ONLY VIEW reports that were published prior to Sunday, April 20, 2025.
You
MUST UPGRADE YOUR MEMBERSHIP if you want to see any current reports.
AFTER MARKET UPDATE - FRIDAY, FEBRUARY 11TH, 2011
Previous After Market Report Next After Market Report >>>
|
|
|
|
DOW |
+43.97 |
12,273.26 |
+0.36% |
|
Volume |
999,759,120 |
-3% |
|
Volume |
2,031,758,840 |
-17% |
|
NASDAQ |
+18.99 |
2,809.44 |
+0.68% |
|
Advancers |
2,137 |
68% |
|
Advancers |
1,799 |
65% |
|
S&P 500 |
+7.28 |
1,329.15 |
+0.55% |
|
Decliners |
873 |
28% |
|
Decliners |
846 |
31% |
|
Russell 2000 |
+9.41 |
822.11 |
+1.16% |
|
52 Wk Highs |
321 |
|
|
52 Wk Highs |
236 |
|
|
S&P 600 |
+4.52 |
435.28 |
+1.05% |
|
52 Wk Lows |
10 |
|
|
52 Wk Lows |
25 |
|
|
 |
Financial Stocks Help Major Averages Continue Rally
Kenneth J. Gruneisen - Passed the CAN SLIM® Master's Exam
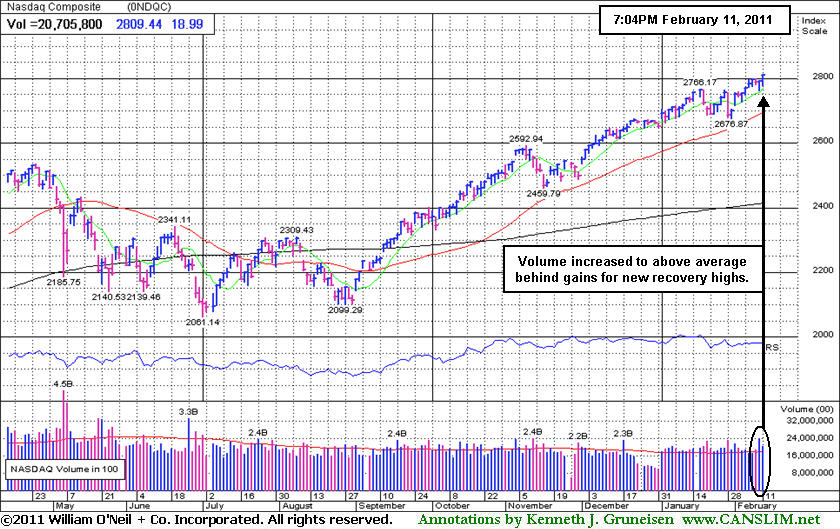
For the week, the Dow Jones Industrial Average and Nasdaq Composite Index both gained +1.5%, and the S&P 500 Index was up +1.4%. Friday's volume totals were reported lighter on the NYSE and on the Nasdaq exchange versus the prior session. Advancing issues beat decliners by nearly 3-1 on the NYSE and by 2-1 on the Nasdaq. New 52-week highs outnumbered new 52-week lows on the NYSE and on the Nasdaq exchange. There was a total of 131 high-ranked companies from the CANSLIM.net Leaders List that made new 52-week highs and appeared on the CANSLIM.net BreakOuts Page, up from the total of 90 on the prior session. On the Featured Stocks Page there were gains from 20 of the 23 high-ranked market leaders.
The stock market rallied on Friday after news that Egyptian President Hosni Mubarak resigned. Gains were on the moderate side, with investors still cautious about the transition of power and the impact on the region. The price of oil declined after the news, and the US dollar rose against most major currencies.
A report on consumer sentiment added to evidence of an economic rebound. The University of Michigan's sentiment index for February rose to an 8-month high. Food inflation is a nagging concern. Kraft Foods Inc (KFT -1.4%) fell after lowering its full-year forecast because of rising costs. Financial and industrial stocks fared well as JP Morgan Chase & Co (JPM +2.3%) and Caterpillar, Inc (CAT +2.9%), gains combined, added nearly 40 points to the Dow. ConocoPhillips (COP +2.1%) rose after announcing it will increase its dividend and share buyback plan.
Stocks have endured very little distributional while off to a very strong start with the first positive January in four years and continuing with a strong rally in February.
Read the February 2011 issue of CANSLIM.net News for a comprehensive overview of current market conditions, leading groups, and the most recent featured stocks.
PICTURED: The tech-heavy Nasdaq Composite Index rallied for new recovery highs. Although volume cooled slightly on Friday, it has posted 2 consecutive gains with above average volume.
|
 Kenneth J. Gruneisen started out as a licensed stockbroker in August 1987, a couple of months prior to the historic stock market crash that took the Dow Jones Industrial Average down -22.6% in a single day. He has published daily fact-based fundamental and technical analysis on high-ranked stocks online for two decades. Through FACTBASEDINVESTING.COM, Kenneth provides educational articles, news, market commentary, and other information regarding proven investment systems that work in good times and bad.
Comments contained in the body of this report are technical opinions only and are not necessarily those of Gruneisen Growth Corp. The material herein has been obtained from sources believed to be reliable and accurate, however, its accuracy and completeness cannot be guaranteed. Our firm, employees, and customers may effect transactions, including transactions contrary to any recommendation herein, or have positions in the securities mentioned herein or options with respect thereto. Any recommendation contained in this report may not be suitable for all investors and it is not to be deemed an offer or solicitation on our part with respect to the purchase or sale of any securities. |
|
 |
Financial Shares Show Reassuring Strength
Kenneth J. Gruneisen - Passed the CAN SLIM® Master's Exam
Financial stocks underpinned Friday's gains for the major averages as the Bank Index ($BKX +1.83%) and Broker/Dealer Index ($XBD +1.03%) provided an important positive influence again. The Healthcare Index ($HMO +1.12%) posted a solid gain, and the Retail Index ($RLX +0.80%) accompanied it in rallying to new recovery highs. The Networking Index ($NWX +1.43%) led the tech sector while the Semiconductor Index ($SOX +0.78%) posted a modest gain and the Biotechnology Index ($BTK +0.27%) Internet Index ($IIX +0.30%) also posted smaller gains. Meanwhile, commodity-linked groups lagged as the Gold & Silver Index ($XAU -0.37%) and Oil Services Index ($OSX -0.24%) edged lower and the Integrated Oil Index ($XOI +0.09%) finished flat.
Charts courtesy www.stockcharts.com
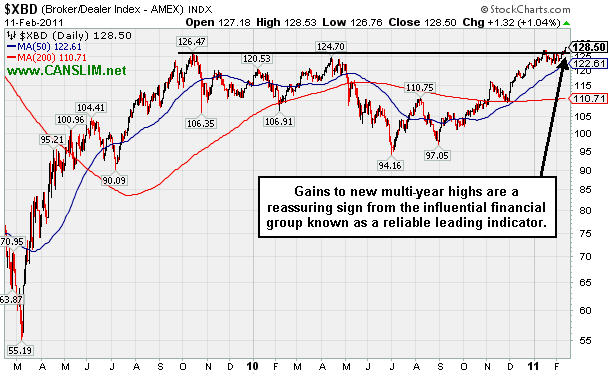
PICTURED: The Broker/Dealer Index's ($XBD +1.03%) recent gains for new recovery highs are a reassuring sign from an important group known as a reliable leading indicator. That helps the overall market outlook, since history has proven that the market is less prone to damaging losses when financial stocks are strong.
| Oil Services |
$OSX |
269.68 |
-0.66 |
-0.24% |
+10.02% |
| Healthcare |
$HMO |
1,972.05 |
+21.92 |
+1.12% |
+16.55% |
| Integrated Oil |
$XOI |
1,300.28 |
+1.14 |
+0.09% |
+7.18% |
| Semiconductor |
$SOX |
462.82 |
+3.57 |
+0.78% |
+12.38% |
| Networking |
$NWX |
331.29 |
+4.66 |
+1.43% |
+18.08% |
| Internet |
$IIX |
329.40 |
+0.97 |
+0.30% |
+7.04% |
| Broker/Dealer |
$XBD |
128.50 |
+1.32 |
+1.03% |
+5.75% |
| Retail |
$RLX |
524.28 |
+4.14 |
+0.80% |
+3.13% |
| Gold & Silver |
$XAU |
203.73 |
-0.76 |
-0.37% |
-10.08% |
| Bank |
$BKX |
55.56 |
+1.00 |
+1.83% |
+6.42% |
| Biotech |
$BTK |
1,293.58 |
+3.53 |
+0.27% |
-0.31% |
|
|
|
 |
A "Straight Up From The Bottom" Breakout
Kenneth J. Gruneisen - Passed the CAN SLIM® Master's Exam
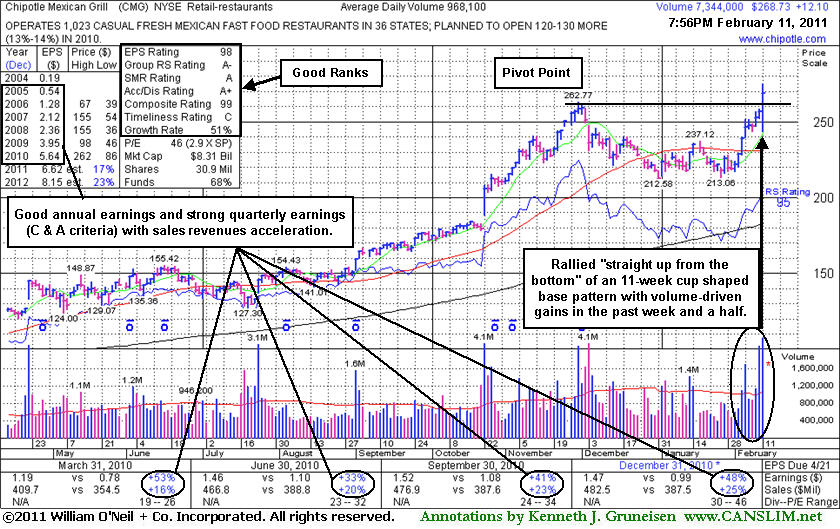
Chipotle Mexican Grill, Inc. (CMG +$12.10 or +4.71% to $268.73) hit a new 52-week high today with a considerable gain backed by heavy volume after reporting earnings +48% on +25% sales revenues for the quarter ended December 31, 2010 versus the year ago period. Its rebound above its 50-day moving average (DMA) line recently helped its outlook improve and it has rallied "straight up from the bottom" of an 11-week cup-shaped base without a handle. Based on its technical strength it was highlighted in yellow as it returned to the Featured Stocks list while featured in the mid-day report today with a new pivot point cited based on its 11/30/10 high plus ten cents.
Investors may not recognize the phrase "straight up from the bottom" but it applies to an advanced chart pattern covered in the Certification course. It applies to cases like this, when a sound looking candidate quickly climbs from the bottom of a cup-shaped consolidation, without much if any pause, with gains on heavy volume as it rises and breaks out, rather than forming a rounded cup that would be typical of an ideal cup-with-handle base pattern. The stock can be accumulated with the usual discipline of not chasing it too extended (more than +5% above its prior high).
Properly pyramiding into a position with multiple purchases per the investment system guidelines (see "Ken's Mailbag" in today's After Market Update for more on "pyramiding"), investors should be able to avoid chasing the stock too extended. Of course, the usual sell rules apply, as disciplined investors know to alway limit losses by selling if a stock falls -7% or more from your buy price.
It currently has an A+ rating for Accumulation/Distribution. Ownership by top-rated funds rose from 530 in Mar '10 to 608 in Dec '10, a nice reassurance concerning the I criteria of the investment system. Sales revenues increases have shown acceleration while up +12%, +16%, +20%, +23%, and now +25% in the streak of latest quarterly comparisons while the C criteria is satisfied by ongoing earnings increases above the +25% guideline. It also has a good annual (A criteria) earnings history
|
|
|
Color Codes Explained :
Y - Better candidates highlighted by our
staff of experts.
G - Previously featured
in past reports as yellow but may no longer be buyable under the
guidelines.
***Last / Change / Volume data in this table is the closing quote data***
Symbol/Exchange
Company Name
Industry Group |
PRICE |
CHANGE
(%Change) |
Day High |
Volume
(% DAV)
(% 50 day avg vol) |
52 Wk Hi
% From Hi |
Featured
Date |
Price
Featured |
Pivot Featured |
|
Max Buy |
BIDU
-
NASDAQ
Baidu Inc Ads
INTERNET - Internet Information Providers
|
$129.58
|
+3.79
3.01% |
$129.65
|
8,107,034
104.87% of 50 DAV
50 DAV is 7,730,200
|
$125.90
2.92%
|
2/1/2011
|
$117.74
|
PP = $112.08
|
|
MB = $117.68
|
 Most Recent Note - 2/11/2011 5:36:29 PM
G - Hit another new all-time high with today's 5th consecutive gain on average volume. Prior highs in the $112-115 area define initial chart support to watch now.
>>> The latest Featured Stock Update with an annotated graph appeared on 2/2/2011. Click here.
View all notes |
Alert me of new notes |
CANSLIM.net Company Profile |
SEC |
Zacks Reports |
StockTalk |
News |
Chart |
Request a new note
C
A N
S L
I M


|
CMG
-
NYSE
Chipotle Mexican Grill
LEISURE - Restaurants
|
$268.73
|
+12.10
4.71% |
$274.85
|
7,356,517
758.09% of 50 DAV
50 DAV is 970,400
|
$262.78
2.27%
|
2/11/2011
|
$271.15
|
PP = $262.87
|
|
MB = $276.01
|
Most Recent Note - 2/11/2011 12:40:37 PM
Y - Hit a new 52-week high today with a considerable gain backed by heavy volume after reporting earnings +48% on +25% sales revenues for the quarter ended December 31, 2010 versus the year ago period. Its rebound above its 50 DMA line last helped its outlook improve and it has rallied "straight up from the bottom" of an 11-week cup shaped base without a handle. Based on its technical strength it is returned to the Featured Stocks list today with a new pivot point cited based on its 11/30/10 high plus ten cents.
>>> The latest Featured Stock Update with an annotated graph appeared on 12/17/2010. Click here.
View all notes |
Alert me of new notes |
CANSLIM.net Company Profile |
SEC |
Zacks Reports |
StockTalk |
News |
Chart |
Request a new note
C
A N
S L
I M
|
CRUS
-
NASDAQ
Cirrus Logic Inc
ELECTRONICS - Semiconductor - Specialized
|
$24.26
|
+0.15
0.62% |
$24.46
|
2,149,664
64.99% of 50 DAV
50 DAV is 3,307,900
|
$25.15
-3.54%
|
1/28/2011
|
$20.69
|
PP = $19.17
|
|
MB = $20.13
|
Most Recent Note - 2/10/2011 12:36:12 PM
G - Gapped down today then rallied back for a positive reversal. Repeatedly noted as extended from its latest sound base pattern. While patience may allow for secondary buy points to develop, its prior highs define chart support levels to watch on pullbacks.
>>> The latest Featured Stock Update with an annotated graph appeared on 1/28/2011. Click here.
View all notes |
Alert me of new notes |
CANSLIM.net Company Profile |
SEC |
Zacks Reports |
StockTalk |
News |
Chart |
Request a new note
C
A N
S L
I M
|
CTSH
-
NASDAQ
Cognizant Tech Sol Cl A
COMPUTER SOFTWARE and SERVICES - Business Software and Services
|
$75.50
|
+0.15
0.20% |
$75.54
|
1,593,252
70.61% of 50 DAV
50 DAV is 2,256,400
|
$77.08
-2.05%
|
2/7/2011
|
$75.09
|
PP = $76.46
|
|
MB = $80.28
|
Most Recent Note - 2/11/2011 5:03:44 PM
Y - Consolidating above its 50 DMA line, it faces no resistance due to overhead supply after closing today's session -2% off its 52-week high. See the latest FSU analysis for details and a new annotated graph.
>>> The latest Featured Stock Update with an annotated graph appeared on 2/8/2011. Click here.
View all notes |
Alert me of new notes |
CANSLIM.net Company Profile |
SEC |
Zacks Reports |
StockTalk |
News |
Chart |
Request a new note
C
A N
S L
I M
|
DECK
-
NASDAQ
Deckers Outdoor Corp
CONSUMER NON-DURABLES - Textile - Apparel Footwear
|
$86.05
|
+1.49
1.76% |
$86.50
|
870,408
45.62% of 50 DAV
50 DAV is 1,908,000
|
$87.88
-2.08%
|
2/3/2011
|
$79.61
|
PP = $82.67
|
|
MB = $86.80
|
Most Recent Note - 2/11/2011 5:07:40 PM
Y - Today's 9th consecutive gain with below average volume helped it rise near its "max buy" level for its 3rd highest close ever. No gains above the new pivot point came with at least +50% above average volume necessary to technically trigger a proper new (or add-on) buy signal.
>>> The latest Featured Stock Update with an annotated graph appeared on 1/26/2011. Click here.
View all notes |
Alert me of new notes |
CANSLIM.net Company Profile |
SEC |
Zacks Reports |
StockTalk |
News |
Chart |
Request a new note
C
A N
S L
I M
|
Symbol/Exchange
Company Name
Industry Group |
PRICE |
CHANGE
(%Change) |
Day High |
Volume
(% DAV)
(% 50 day avg vol) |
52 Wk Hi
% From Hi |
Featured
Date |
Price
Featured |
Pivot Featured |
|
Max Buy |
EZCH
-
NASDAQ
Ezchip Semiconductor Ltd
ELECTRONICS - Semiconductor - Specialized
|
$30.00
|
-0.80
-2.60% |
$30.69
|
966,966
298.35% of 50 DAV
50 DAV is 324,100
|
$33.48
-10.39%
|
12/2/2010
|
$27.53
|
PP = $26.00
|
|
MB = $27.30
|
Most Recent Note - 2/11/2011 5:10:42 PM
G - Down today with above average volume, closing near its 50 DMA line. On 2/10/11 it reported earnings +41% on +33% sales revenues for the quarter ended December 31, 2010, and gapped down undercutting its 50 DMA line and prior chart highs in the $29 area then rebounded to close well above both. As previously noted - "Volume and volatility often increase near corporate earnings news."
>>> The latest Featured Stock Update with an annotated graph appeared on 1/21/2011. Click here.
View all notes |
Alert me of new notes |
CANSLIM.net Company Profile |
SEC |
Zacks Reports |
StockTalk |
News |
Chart |
Request a new note
C
A N
S L
I M
|
EZPW
-
NASDAQ
Ezcorp Inc Cl A
SPECIALTY RETAIL - Specialty Retail, Other
|
$27.97
|
+0.46
1.67% |
$28.00
|
248,679
59.54% of 50 DAV
50 DAV is 417,700
|
$29.94
-6.58%
|
11/5/2010
|
$24.02
|
PP = $23.85
|
|
MB = $25.04
|
Most Recent Note - 2/11/2011 5:12:12 PM
G - Small gain today helped it end the quiet week above its 50 DMA line again, showing resilience. It is not near any sound base, and its recent low ($25.56 on 1/25/11) defines an important support level now. Volume totals have been cooling while consolidating in recent weeks near its short-term average.
>>> The latest Featured Stock Update with an annotated graph appeared on 2/3/2011. Click here.
View all notes |
Alert me of new notes |
CANSLIM.net Company Profile |
SEC |
Zacks Reports |
StockTalk |
News |
Chart |
Request a new note
C
A N
S L
I M
|
FOSL
-
NASDAQ
Fossil Inc
CONSUMER DURABLES - Recreational Goods, Other
|
$82.79
|
+2.34
2.91% |
$83.40
|
1,219,149
175.82% of 50 DAV
50 DAV is 693,400
|
$80.47
2.88%
|
2/1/2011
|
$73.30
|
PP = $74.44
|
|
MB = $78.16
|
Most Recent Note - 2/11/2011 5:15:17 PM
G - Hit yet another new 52-week high with above average volume behind today's 7th consecutive gain. It is extended from any sound base pattern. Prior resistance in the $74 area defines initial chart support above its 50 DMA line.
>>> The latest Featured Stock Update with an annotated graph appeared on 1/12/2011. Click here.
View all notes |
Alert me of new notes |
CANSLIM.net Company Profile |
SEC |
Zacks Reports |
StockTalk |
News |
Chart |
Request a new note
C
A N
S L
I M
|
HMSY
-
NASDAQ
H M S Holdings Corp
COMPUTER SOFTWARE and SERVICES - Healthcare Information Service
|
$68.97
|
+1.22
1.80% |
$69.06
|
98,663
68.61% of 50 DAV
50 DAV is 143,800
|
$67.86
1.64%
|
11/19/2010
|
$61.89
|
PP = $63.01
|
|
MB = $66.16
|
Most Recent Note - 2/11/2011 5:17:46 PM
G - Hit yet another new 52-week high with today's 9th consecutive gain with light volume since it found support at its 50 DMA line. It quietly rose from an orderly base-on-base type pattern. Waning Relative Strength rank (now 72) has been noted as a concern.
>>> The latest Featured Stock Update with an annotated graph appeared on 1/3/2011. Click here.
View all notes |
Alert me of new notes |
CANSLIM.net Company Profile |
SEC |
Zacks Reports |
StockTalk |
News |
Chart |
Request a new note
C
A N
S L
I M
|
JOBS
-
NASDAQ
Fifty One Job Inc Ads
DIVERSIFIED SERVICES - Staffing and; Outsourcing Service
|
$57.83
|
+1.51
2.68% |
$58.47
|
107,499
78.18% of 50 DAV
50 DAV is 137,500
|
$61.28
-5.63%
|
2/7/2011
|
$59.23
|
PP = $61.38
|
|
MB = $64.45
|
Most Recent Note - 2/11/2011 5:22:20 PM
Y - Consolidating just above its 50 DMA line. That short-term average and its recent low ($52.58 on 1/28/11) define important support levels where violations would raise concerns and trigger technical sell signals. Color code was changed to yellow with new pivot point cited after a long ascending base pattern. Subsequent volume-driven gains above its pivot point may trigger a new (or add-on) technical buy signal. See the latest FSU analysis for more details and an annotated graph.
>>> The latest Featured Stock Update with an annotated graph appeared on 2/7/2011. Click here.
View all notes |
Alert me of new notes |
CANSLIM.net Company Profile |
SEC |
Zacks Reports |
StockTalk |
News |
Chart |
Request a new note
C
A N
S L
I M
|
Symbol/Exchange
Company Name
Industry Group |
PRICE |
CHANGE
(%Change) |
Day High |
Volume
(% DAV)
(% 50 day avg vol) |
52 Wk Hi
% From Hi |
Featured
Date |
Price
Featured |
Pivot Featured |
|
Max Buy |
LULU
-
NASDAQ
Lululemon Athletica
MANUFACTURING - Textile Manufacturing
|
$84.31
|
+1.54
1.86% |
$85.28
|
2,285,512
102.58% of 50 DAV
50 DAV is 2,228,000
|
$83.19
1.35%
|
1/26/2011
|
$68.11
|
PP = $74.70
|
|
MB = $78.44
|
Most Recent Note - 2/11/2011 10:08:43 AM
G - Up today for another new 52-week high, extended from its latest sound base after 7 consecutive gains. Prior highs near $74 that acted as resistance define chart support to watch now.
>>> The latest Featured Stock Update with an annotated graph appeared on 1/14/2011. Click here.
View all notes |
Alert me of new notes |
CANSLIM.net Company Profile |
SEC |
Zacks Reports |
StockTalk |
News |
Chart |
Request a new note
C
A N
S L
I M
|
MWIV
-
NASDAQ
M W I Veterinary Supply
HEALTH SERVICES - Medical Instruments and; Supplies
|
$69.33
|
+1.09
1.60% |
$69.77
|
43,522
71.00% of 50 DAV
50 DAV is 61,300
|
$69.04
0.42%
|
11/4/2010
|
$61.79
|
PP = $59.60
|
|
MB = $62.58
|
Most Recent Note - 2/11/2011 10:12:56 AM
G - Quietly perched at its all-time high, however it has not built a sound new base pattern. It found support near its 50 DMA line recently. Sales revenues acceleration (bigger percentage increases sequentially) is a very reassuring sign.
>>> The latest Featured Stock Update with an annotated graph appeared on 2/2/2011. Click here.
View all notes |
Alert me of new notes |
CANSLIM.net Company Profile |
SEC |
Zacks Reports |
StockTalk |
News |
Chart |
Request a new note
C
A N
S L
I M
|
NFLX
-
NASDAQ
Netflix Inc
SPECIALTY RETAIL - Music and Video Stores
|
$231.07
|
+7.87
3.53% |
$231.60
|
6,617,573
112.62% of 50 DAV
50 DAV is 5,876,200
|
$225.00
2.70%
|
1/10/2011
|
$187.88
|
PP = $209.34
|
|
MB = $219.81
|
Most Recent Note - 2/11/2011 5:29:25 PM
G - Gain today with above average volume for another new all-time high. It is extended from a sound base, and prior high ($209) defines support to watch above its 50 DMA line.
>>> The latest Featured Stock Update with an annotated graph appeared on 1/10/2011. Click here.
View all notes |
Alert me of new notes |
CANSLIM.net Company Profile |
SEC |
Zacks Reports |
StockTalk |
News |
Chart |
Request a new note
C
A N
S L
I M
|
NTAP
-
NASDAQ
Netapp Inc
COMPUTER HARDWARE - Data Storage Devices
|
$60.60
|
+0.06
0.10% |
$61.02
|
4,215,796
94.47% of 50 DAV
50 DAV is 4,462,400
|
$60.63
-0.05%
|
1/6/2011
|
$57.49
|
PP = $58.06
|
|
MB = $60.96
|
Most Recent Note - 2/10/2011 6:56:03 PM
G - Closed at a new high with today's 5th consecutive gain. Volume has been light as it traded up from support near its 50 DMA line. More damaging losses below its recent chart low ($53.14 on 1/25/11) could raise greater concerns and trigger a more serious technical sell signal.
>>> The latest Featured Stock Update with an annotated graph appeared on 2/4/2011. Click here.
View all notes |
Alert me of new notes |
CANSLIM.net Company Profile |
SEC |
Zacks Reports |
StockTalk |
News |
Chart |
Request a new note
C
A N
S L
I M
|
OPEN
-
NASDAQ
Opentable Inc
INTERNET - Internet Software and Services
|
$94.95
|
+3.27
3.57% |
$95.49
|
2,697,089
356.47% of 50 DAV
50 DAV is 756,600
|
$91.75
3.49%
|
1/5/2011
|
$74.05
|
PP = $76.79
|
|
MB = $80.63
|
Most Recent Note - 2/11/2011 1:18:45 PM
G - Rallying on heavy volume today for a 7th consecutive gain and another new all-time high, extended from a sound base pattern. Reported earnings +114% on +61% sales revenues for the quarter ended December 31, 2010 versus the year-ago period. Its 50 DMA line defines near-term chart support.
>>> The latest Featured Stock Update with an annotated graph appeared on 1/5/2011. Click here.
View all notes |
Alert me of new notes |
CANSLIM.net Company Profile |
SEC |
Zacks Reports |
StockTalk |
News |
Chart |
Request a new note
C
A N
S L
I M
|
Symbol/Exchange
Company Name
Industry Group |
PRICE |
CHANGE
(%Change) |
Day High |
Volume
(% DAV)
(% 50 day avg vol) |
52 Wk Hi
% From Hi |
Featured
Date |
Price
Featured |
Pivot Featured |
|
Max Buy |
ORCL
-
NASDAQ
Oracle Corp
COMPUTER SOFTWARE and SERVICES - Application Software
|
$33.47
|
+0.21
0.63% |
$33.59
|
17,401,897
62.30% of 50 DAV
50 DAV is 27,932,100
|
$33.56
-0.27%
|
1/20/2011
|
$32.31
|
PP = $32.37
|
|
MB = $33.99
|
Most Recent Note - 2/10/2011 6:58:46 PM
Y - Gain today with quiet volume for a new high close following mild distributional pressure it encountered after reaching a new 52-week high last week. Near-term support to watch is its 50 DMA line.
>>> The latest Featured Stock Update with an annotated graph appeared on 1/7/2011. Click here.
View all notes |
Alert me of new notes |
CANSLIM.net Company Profile |
SEC |
Zacks Reports |
StockTalk |
News |
Chart |
Request a new note
C
A N
S L
I M
|
PAY
-
NYSE
Verifone Systems Inc
COMPUTER HARDWARE - Transaction Automation Systems
|
$45.02
|
+1.10
2.50% |
$45.12
|
1,615,105
106.04% of 50 DAV
50 DAV is 1,523,100
|
$44.87
0.33%
|
1/27/2011
|
$41.77
|
PP = $44.97
|
|
MB = $47.22
|
Most Recent Note - 2/11/2011 5:40:21 PM
Y - Closed near the session high and pennies above its pivot point with today's gain for a new 52-week high backed by only average volume. Recently found support near its 50 DMA line. A subsequent gain with at least +50% above average volume may trigger a new (or add-on) technical buy signal.
>>> The latest Featured Stock Update with an annotated graph appeared on 1/27/2011. Click here.
View all notes |
Alert me of new notes |
CANSLIM.net Company Profile |
SEC |
Zacks Reports |
StockTalk |
News |
Chart |
Request a new note
C
A N
S L
I M
|
PCLN
-
NASDAQ
Priceline.Com Inc
INTERNET - Internet Software and Services
|
$455.39
|
-0.05
-0.01% |
$457.73
|
1,167,239
123.86% of 50 DAV
50 DAV is 942,400
|
$459.10
-0.81%
|
11/1/2002
|
$399.55
|
PP = $428.20
|
|
MB = $449.61
|
Most Recent Note - 2/11/2011 5:34:18 PM
G - Color code was changed to green after rising above its "max buy" level this week. Prior highs and its 50 DMA line define support to watch.
>>> The latest Featured Stock Update with an annotated graph appeared on 1/2/2011. Click here.
View all notes |
Alert me of new notes |
CANSLIM.net Company Profile |
SEC |
Zacks Reports |
StockTalk |
News |
Chart |
Request a new note
C
A N
S L
I M
|
RAX
-
NYSE
Rackspace Hosting Inc
INTERNET - Internet Software and; Services
|
$40.07
|
+3.05
8.24% |
$40.62
|
5,684,383
326.18% of 50 DAV
50 DAV is 1,742,700
|
$37.50
6.85%
|
1/10/2011
|
$22.84
|
PP = $32.76
|
|
MB = $34.40
|
Most Recent Note - 2/11/2011 1:21:33 PM
G - Gapped up today for a considerable gain on heavy volume after reporting earnings +29% on +27% sales revenues for the quarter ended December 31, 2010 versus the year ago period. It is extended from any sound base. Recent highs near $35 define support to watch above its 50 DMA line. See the latest FSU analysis for details and a new annotated weekly graph.
>>> The latest Featured Stock Update with an annotated graph appeared on 2/9/2011. Click here.
View all notes |
Alert me of new notes |
CANSLIM.net Company Profile |
SEC |
Zacks Reports |
StockTalk |
News |
Chart |
Request a new note
C
A N
S L
I M
|
ROVI
-
NASDAQ
Rovi Corp
COMPUTER SOFTWARE andamp; SERVICES - Security Software andamp; Services
|
$64.46
|
-0.54
-0.83% |
$64.85
|
1,212,699
71.91% of 50 DAV
50 DAV is 1,686,400
|
$69.50
-7.25%
|
10/29/2010
|
$49.99
|
PP = $53.10
|
|
MB = $55.76
|
Most Recent Note - 2/10/2011 4:45:33 PM
G - Still consolidating above its 50 DMA line with volume totals cooling after recently finding support near that important short-term average. The 1/31/11 low ($60.15) now defines another near-term chart support level to watch.
>>> The latest Featured Stock Update with an annotated graph appeared on 1/25/2011. Click here.
View all notes |
Alert me of new notes |
CANSLIM.net Company Profile |
SEC |
Zacks Reports |
StockTalk |
News |
Chart |
Request a new note
C
A N
S L
I M
|
Symbol/Exchange
Company Name
Industry Group |
PRICE |
CHANGE
(%Change) |
Day High |
Volume
(% DAV)
(% 50 day avg vol) |
52 Wk Hi
% From Hi |
Featured
Date |
Price
Featured |
Pivot Featured |
|
Max Buy |
TIBX
-
NASDAQ
Tibco Software Inc
COMPUTER SOFTWARE and SERVICES - Business Software and Services
|
$25.31
|
+0.10
0.40% |
$25.44
|
1,612,098
57.88% of 50 DAV
50 DAV is 2,785,300
|
$25.49
-0.71%
|
2/1/2011
|
$24.35
|
PP = $22.18
|
|
MB = $23.29
|
Most Recent Note - 2/10/2011 6:43:14 PM
G - Hit another new 52-week high today with a gain on light volume. Extended from its latest sound base, its prior highs in the $22 area define support. See the latest FSU analysis for details and a new annotated graph.
>>> The latest Featured Stock Update with an annotated graph appeared on 2/10/2011. Click here.
View all notes |
Alert me of new notes |
CANSLIM.net Company Profile |
SEC |
Zacks Reports |
StockTalk |
News |
Chart |
Request a new note
C
A N
S L
I M
|
UA
-
NYSE
Under Armour Inc Cl A
CONSUMER NON-DURABLES - Textile - Apparel Clothing
|
$69.81
|
+0.69
1.00% |
$69.97
|
618,094
79.73% of 50 DAV
50 DAV is 775,200
|
$69.23
0.84%
|
1/27/2011
|
$58.31
|
PP = $56.99
|
|
MB = $59.84
|
Most Recent Note - 2/10/2011 4:44:22 PM
G - Hit another new 52-week high with a solid gain on above average volume today. Prior resistance in the $60 area defines initial support to watch above its 50 DMA line.
>>> The latest Featured Stock Update with an annotated graph appeared on 2/1/2011. Click here.
View all notes |
Alert me of new notes |
CANSLIM.net Company Profile |
SEC |
Zacks Reports |
StockTalk |
News |
Chart |
Request a new note
C
A N
S L
I M
|
ULTA
-
NASDAQ
Ulta Salon Cosm & Frag
SPECIALTY RETAIL - Specialty Retail, Other
|
$42.59
|
+1.05
2.53% |
$42.63
|
287,556
45.31% of 50 DAV
50 DAV is 634,700
|
$41.95
1.53%
|
1/6/2011
|
$36.12
|
PP = $37.34
|
|
MB = $39.21
|
Most Recent Note - 2/11/2011 10:19:27 AM
G - Near its 52-week high today, posting its 7th consecutive small gain. It is extended from a sound base pattern, and prior highs in the $37-38 area define chart support to watch above its 50 DMA line.
>>> The latest Featured Stock Update with an annotated graph appeared on 1/6/2011. Click here.
View all notes |
Alert me of new notes |
CANSLIM.net Company Profile |
SEC |
Zacks Reports |
StockTalk |
News |
Chart |
Request a new note
C
A N
S L
I M
|
|
 |
| Subscriber Questions: |
February 9, 2011 |
Dear Ken,
In yesterdays After Market Update you reviewed the concept of pyramiding into a position. Can you initiate or add to positions based upon intraday prices and elevated volume or should you wait until near the end of the day to see the near final price and volume? Marcus |
| Ken's Response: |
February 10, 2011 |
Dear Marcus,
Thanks for writing in (about "pyramiding" discussed in the 2/08/11 article in the Featured Stock Update section - read here) with another great question!
I believe the pyramiding approach they teach in the Certification is specifically designed so you might make you first buy (of the recommended 3 partial buy orders for an ordinary "full position") without knowing for sure if volume that day is going to meet the minimum volume threshold for a proper buy signal. If volume is not running at an above average pace and the stock doesn't rise an additional 2-2.5% then you'd probably not enter the second or third buy order(s). Then, if ultimately days go by and the stock falters and fails to convincingly break out, you may end up selling the partial position as it weakens. Always sell if it falls -7%, but of course, you don't have to wait until you're -7% on the partial position to sometimes know that it should just be sold. This approach greatly minimizes the damage if it doesn't rally and you're stopped out, and it allows you to accumulate shares at a lower cost basis that is closer to the stock's pivot point. Best of all it, removes guesswork and lets the market action dictate whether or not you get a full position accumulated or not.
A lot of us, like me usually, wait until near the end of the session to know for sure how solid the volume total is and how the closing price looks like it will be versus its pivot point. Even if that means risking paying a little more, it is often worth paying a little more and having that valuable reassurance that heavy institutional buying demand is present. Pyramiding the buy orders for every full position is recommended, although in years past and before taking the Certification I enjoyed great success just buying the full position all at once and not pyramiding in.
Please let me know if there is any way I can be more helpful to you in your efforts.
Best regards,

Kenneth J. Gruneisen
Founder & Contributing Writer for CANSLIM.net from 1996 through May 11th 2015
|
|
|
|
THESE ARE NOT BUY RECOMMENDATIONS!
Comments contained in the body of this report are technical
opinions only. The material herein has been obtained
from sources believed to be reliable and accurate, however,
its accuracy and completeness cannot be guaranteed.
This site is not an investment advisor, hence it does
not endorse or recommend any securities or other investments.
Any recommendation contained in this report may not
be suitable for all investors and it is not to be deemed
an offer or solicitation on our part with respect to
the purchase or sale of any securities. All trademarks,
service marks and trade names appearing in this report
are the property of their respective owners, and are
likewise used for identification purposes only.
This report is a service available
only to active Paid Premium Members.
You may opt-out of receiving report notifications
at any time. Questions or comments may be submitted
by writing to Premium Membership Services 665 S.E. 10 Street, Suite 201 Deerfield Beach, FL 33441-5634 or by calling 1-800-965-8307
or 954-785-1121.
|
|
|

