***Last / Change / Volume data in this table is the closing quote data***
Symbol/Exchange
Company Name
Industry Group |
PRICE |
CHANGE
(%Change) |
Day High |
Volume
(% DAV)
(% 50 day avg vol) |
52 Wk Hi
% From Hi |
Featured
Date |
Price
Featured |
Pivot Featured |
|
Max Buy |
BIDU
-
NASDAQ
Baidu Inc Ads
INTERNET - Internet Information Providers
|
$125.79
|
+2.78
2.26% |
$125.90
|
7,486,855
96.85% of 50 DAV
50 DAV is 7,730,200
|
$124.55
1.00%
|
2/1/2011
|
$117.74
|
PP = $112.08
|
|
MB = $117.68
|
 Most Recent Note - 2/10/2011 6:49:05 PM
G - Up again today for another new all-time high with a gain on average volume. Prior highs in the $112-115 area define initial chart support to watch now.
>>> The latest Featured Stock Update with an annotated graph appeared on 2/2/2011. Click here.
View all notes |
Alert me of new notes |
CANSLIM.net Company Profile |
SEC |
Zacks Reports |
StockTalk |
News |
Chart |
Request a new note
C
A N
S L
I M


|
CRUS
-
NASDAQ
Cirrus Logic Inc
ELECTRONICS - Semiconductor - Specialized
|
$24.11
|
+0.03
0.12% |
$24.42
|
4,907,648
148.36% of 50 DAV
50 DAV is 3,307,900
|
$25.15
-4.14%
|
1/28/2011
|
$20.69
|
PP = $19.17
|
|
MB = $20.13
|
Most Recent Note - 2/10/2011 12:36:12 PM
G - Gapped down today then rallied back for a positive reversal. Repeatedly noted as extended from its latest sound base pattern. While patience may allow for secondary buy points to develop, its prior highs define chart support levels to watch on pullbacks.
>>> The latest Featured Stock Update with an annotated graph appeared on 1/28/2011. Click here.
View all notes |
Alert me of new notes |
CANSLIM.net Company Profile |
SEC |
Zacks Reports |
StockTalk |
News |
Chart |
Request a new note
C
A N
S L
I M
|
CTSH
-
NASDAQ
Cognizant Tech Sol Cl A
COMPUTER SOFTWARE and SERVICES - Business Software and Services
|
$75.35
|
+1.13
1.52% |
$75.38
|
1,965,568
87.11% of 50 DAV
50 DAV is 2,256,400
|
$77.08
-2.24%
|
2/7/2011
|
$75.09
|
PP = $76.46
|
|
MB = $80.28
|
Most Recent Note - 2/9/2011 2:13:28 PM
Y - Small gap down today, erasing all of the prior session's gain, raising concerns. Rallied above its pivot point on 2/08/11 from a short flat base with the bare minimum necessary volume to trigger a buy signal while clearing its riskier late-stage base. Recent quarters showed much better sales and earnings increases versus the year earlier and it maintained a strong annual earnings (A criteria) history. It reported earnings +40% on +45% sales for the quarter ended December 31, 2010 versus the year ago period in the interim since noted in the 10/15/10 mid-day report. It is already well-known by the institutional crowd, and decreasing top-rated institutional ownership (I criteria) is a concern after falling from 1,640 in Jun '10 to 1,617 in Dec '10. On 4/11/07 this stock was dropped from the CANSLIM.net Featured Stocks list and it subsequently fell from $40+ to $14 before rebounding impressively. See the latest FSU analysis for details and a new annotated graph.
>>> The latest Featured Stock Update with an annotated graph appeared on 2/8/2011. Click here.
View all notes |
Alert me of new notes |
CANSLIM.net Company Profile |
SEC |
Zacks Reports |
StockTalk |
News |
Chart |
Request a new note
C
A N
S L
I M
|
DECK
-
NASDAQ
Deckers Outdoor Corp
CONSUMER NON-DURABLES - Textile - Apparel Footwear
|
$84.56
|
+0.63
0.75% |
$84.80
|
961,521
50.39% of 50 DAV
50 DAV is 1,908,000
|
$87.88
-3.78%
|
2/3/2011
|
$79.61
|
PP = $82.67
|
|
MB = $86.80
|
Most Recent Note - 2/10/2011 7:03:25 PM
Y - Extended its streak to 8 consecutive gains with below average volume today, and it inched further above its pivot point. Gains above the new pivot point with at least +50% above average volume may trigger a new (or add-on) buy signal.
>>> The latest Featured Stock Update with an annotated graph appeared on 1/26/2011. Click here.
View all notes |
Alert me of new notes |
CANSLIM.net Company Profile |
SEC |
Zacks Reports |
StockTalk |
News |
Chart |
Request a new note
C
A N
S L
I M
|
EZCH
-
NASDAQ
Ezchip Semiconductor Ltd
ELECTRONICS - Semiconductor - Specialized
|
$30.80
|
-1.28
-3.99% |
$31.30
|
2,445,588
754.58% of 50 DAV
50 DAV is 324,100
|
$33.48
-8.00%
|
12/2/2010
|
$27.53
|
PP = $26.00
|
|
MB = $27.30
|
Most Recent Note - 2/10/2011 6:47:43 PM
G - Gapped down after reporting earnings +41% on +33% sales revenues for the quarter ended December 31, 2010. It undercut its 50 DMA line and prior chart highs in the $29 area and then rebounded to close well above both and finished near the session high. As previously noted - "Volume and volatility often increase near corporate earnings news."
>>> The latest Featured Stock Update with an annotated graph appeared on 1/21/2011. Click here.
View all notes |
Alert me of new notes |
CANSLIM.net Company Profile |
SEC |
Zacks Reports |
StockTalk |
News |
Chart |
Request a new note
C
A N
S L
I M
|
Symbol/Exchange
Company Name
Industry Group |
PRICE |
CHANGE
(%Change) |
Day High |
Volume
(% DAV)
(% 50 day avg vol) |
52 Wk Hi
% From Hi |
Featured
Date |
Price
Featured |
Pivot Featured |
|
Max Buy |
EZPW
-
NASDAQ
Ezcorp Inc Cl A
SPECIALTY RETAIL - Specialty Retail, Other
|
$27.51
|
+0.04
0.15% |
$27.70
|
164,239
39.32% of 50 DAV
50 DAV is 417,700
|
$29.94
-8.12%
|
11/5/2010
|
$24.02
|
PP = $23.85
|
|
MB = $25.04
|
Most Recent Note - 2/9/2011 9:20:25 PM
G - Small gap down today led to a close just below its 50 DMA line again after showing resilience recently. It is not near any sound base, and its recent low ($25.56 on 1/25/11) defines an important support level now. Volume totals have been cooling while consolidating in recent weeks near its short-term average.
>>> The latest Featured Stock Update with an annotated graph appeared on 2/3/2011. Click here.
View all notes |
Alert me of new notes |
CANSLIM.net Company Profile |
SEC |
Zacks Reports |
StockTalk |
News |
Chart |
Request a new note
C
A N
S L
I M
|
FOSL
-
NASDAQ
Fossil Inc
CONSUMER DURABLES - Recreational Goods, Other
|
$80.45
|
+0.79
0.99% |
$80.47
|
738,570
106.51% of 50 DAV
50 DAV is 693,400
|
$80.15
0.37%
|
2/1/2011
|
$73.30
|
PP = $74.44
|
|
MB = $78.16
|
Most Recent Note - 2/9/2011 9:22:01 PM
G - Hit yet another new 52-week high today with above average volume behind today's 5th consecutive gain. Color code was changed to green after inching up to a quiet close above its "max buy" level, getting extended from a riskier "late-stage" base without confirming a proper new (or add-on) technical buy signal. Recent chart low ($66.05 on 1/25/11) defines important support above its 50 DMA line.
>>> The latest Featured Stock Update with an annotated graph appeared on 1/12/2011. Click here.
View all notes |
Alert me of new notes |
CANSLIM.net Company Profile |
SEC |
Zacks Reports |
StockTalk |
News |
Chart |
Request a new note
C
A N
S L
I M
|
HMSY
-
NASDAQ
H M S Holdings Corp
COMPUTER SOFTWARE and SERVICES - Healthcare Information Service
|
$67.75
|
+0.34
0.50% |
$67.86
|
118,441
82.37% of 50 DAV
50 DAV is 143,800
|
$67.64
0.16%
|
11/19/2010
|
$61.89
|
PP = $63.01
|
|
MB = $66.16
|
Most Recent Note - 2/10/2011 6:53:37 PM
G - Hit a new 52-week high today as it posted an 8th consecutive gain with light volume since it found support at its 50 DMA line. It is inching up from an orderly building a base-on-base type pattern, but its waning Relative Strength rank (now 71) has been noted as a concern.
>>> The latest Featured Stock Update with an annotated graph appeared on 1/3/2011. Click here.
View all notes |
Alert me of new notes |
CANSLIM.net Company Profile |
SEC |
Zacks Reports |
StockTalk |
News |
Chart |
Request a new note
C
A N
S L
I M
|
JOBS
-
NASDAQ
Fifty One Job Inc Ads
DIVERSIFIED SERVICES - Staffing and; Outsourcing Service
|
$56.32
|
+0.03
0.05% |
$56.54
|
147,512
107.28% of 50 DAV
50 DAV is 137,500
|
$61.28
-8.09%
|
2/7/2011
|
$59.23
|
PP = $61.38
|
|
MB = $64.45
|
Most Recent Note - 2/9/2011 9:18:03 PM
Y - Down today on light volume. Its 50 DMA line defines important support, where a violation would raise concerns and trigger a technical sell signal. Color code was changed to yellow with new pivot point cited after a long ascending base pattern. See the latest FSU analysis for more details and an annotated graph.
>>> The latest Featured Stock Update with an annotated graph appeared on 2/7/2011. Click here.
View all notes |
Alert me of new notes |
CANSLIM.net Company Profile |
SEC |
Zacks Reports |
StockTalk |
News |
Chart |
Request a new note
C
A N
S L
I M
|
LULU
-
NASDAQ
Lululemon Athletica
MANUFACTURING - Textile Manufacturing
|
$82.77
|
+1.27
1.56% |
$83.19
|
2,203,963
98.92% of 50 DAV
50 DAV is 2,228,000
|
$82.86
-0.11%
|
1/26/2011
|
$68.11
|
PP = $74.70
|
|
MB = $78.44
|
Most Recent Note - 2/8/2011 7:52:41 PM
G - Gapped up again today and hit another new 52-week high, closing above its "max buy" level. Color code is changed to green after getting extended from its latest sound base. Prior highs near $74 that acted as resistance define chart support to watch now.
>>> The latest Featured Stock Update with an annotated graph appeared on 1/14/2011. Click here.
View all notes |
Alert me of new notes |
CANSLIM.net Company Profile |
SEC |
Zacks Reports |
StockTalk |
News |
Chart |
Request a new note
C
A N
S L
I M
|
Symbol/Exchange
Company Name
Industry Group |
PRICE |
CHANGE
(%Change) |
Day High |
Volume
(% DAV)
(% 50 day avg vol) |
52 Wk Hi
% From Hi |
Featured
Date |
Price
Featured |
Pivot Featured |
|
Max Buy |
MWIV
-
NASDAQ
M W I Veterinary Supply
HEALTH SERVICES - Medical Instruments and; Supplies
|
$68.24
|
+0.08
0.12% |
$68.80
|
38,229
62.36% of 50 DAV
50 DAV is 61,300
|
$69.04
-1.16%
|
11/4/2010
|
$61.79
|
PP = $59.60
|
|
MB = $62.58
|
Most Recent Note - 2/8/2011 8:10:55 PM
G - Closed near the session high at a new all-time high with average volume behind today's 4th consecutive gain. Reported earnings +38% on +55% sales revenues for the quarter ended December 31, 2010, and found support near its 50 DMA line recently. Sales revenues acceleration (bigger percentage increases sequentially) is a very reassuring sign.
>>> The latest Featured Stock Update with an annotated graph appeared on 2/2/2011. Click here.
View all notes |
Alert me of new notes |
CANSLIM.net Company Profile |
SEC |
Zacks Reports |
StockTalk |
News |
Chart |
Request a new note
C
A N
S L
I M
|
NFLX
-
NASDAQ
Netflix Inc
SPECIALTY RETAIL - Music and Video Stores
|
$223.20
|
+0.91
0.41% |
$225.00
|
3,104,130
52.83% of 50 DAV
50 DAV is 5,876,200
|
$223.98
-0.35%
|
1/10/2011
|
$187.88
|
PP = $209.34
|
|
MB = $219.81
|
Most Recent Note - 2/9/2011 9:16:01 PM
G - Gain today with below average volume for a new all-time high. Rallying further above its "max buy" level after its color code was changed to green. Prior highs define support to watch above its 50 DMA line.
>>> The latest Featured Stock Update with an annotated graph appeared on 1/10/2011. Click here.
View all notes |
Alert me of new notes |
CANSLIM.net Company Profile |
SEC |
Zacks Reports |
StockTalk |
News |
Chart |
Request a new note
C
A N
S L
I M
|
NTAP
-
NASDAQ
Netapp Inc
COMPUTER HARDWARE - Data Storage Devices
|
$60.54
|
+0.77
1.29% |
$60.63
|
4,867,561
109.08% of 50 DAV
50 DAV is 4,462,400
|
$59.99
0.92%
|
1/6/2011
|
$57.49
|
PP = $58.06
|
|
MB = $60.96
|
Most Recent Note - 2/10/2011 6:56:03 PM
G - Closed at a new high with today's 5th consecutive gain. Volume has been light as it traded up from support near its 50 DMA line. More damaging losses below its recent chart low ($53.14 on 1/25/11) could raise greater concerns and trigger a more serious technical sell signal.
>>> The latest Featured Stock Update with an annotated graph appeared on 2/4/2011. Click here.
View all notes |
Alert me of new notes |
CANSLIM.net Company Profile |
SEC |
Zacks Reports |
StockTalk |
News |
Chart |
Request a new note
C
A N
S L
I M
|
OPEN
-
NASDAQ
Opentable Inc
INTERNET - Internet Software and Services
|
$91.68
|
+5.83
6.79% |
$91.75
|
2,555,912
337.82% of 50 DAV
50 DAV is 756,600
|
$87.75
4.48%
|
1/5/2011
|
$74.05
|
PP = $76.79
|
|
MB = $80.63
|
Most Recent Note - 2/10/2011 1:42:52 PM
G - Rallying on heavy volume today for another new all-time high today, getting extended from its prior base pattern. Reported earnings +114% on +61% sales revenues for the quarter ended December 31, 2010 versus the year-ago period. Its 50 DMA line defines near-term chart support.
>>> The latest Featured Stock Update with an annotated graph appeared on 1/5/2011. Click here.
View all notes |
Alert me of new notes |
CANSLIM.net Company Profile |
SEC |
Zacks Reports |
StockTalk |
News |
Chart |
Request a new note
C
A N
S L
I M
|
ORCL
-
NASDAQ
Oracle Corp
COMPUTER SOFTWARE and SERVICES - Application Software
|
$33.26
|
+0.37
1.13% |
$33.26
|
17,237,692
61.71% of 50 DAV
50 DAV is 27,932,100
|
$33.56
-0.89%
|
1/20/2011
|
$32.31
|
PP = $32.37
|
|
MB = $33.99
|
Most Recent Note - 2/10/2011 6:58:46 PM
Y - Gain today with quiet volume for a new high close following mild distributional pressure it encountered after reaching a new 52-week high last week. Near-term support to watch is its 50 DMA line.
>>> The latest Featured Stock Update with an annotated graph appeared on 1/7/2011. Click here.
View all notes |
Alert me of new notes |
CANSLIM.net Company Profile |
SEC |
Zacks Reports |
StockTalk |
News |
Chart |
Request a new note
C
A N
S L
I M
|
Symbol/Exchange
Company Name
Industry Group |
PRICE |
CHANGE
(%Change) |
Day High |
Volume
(% DAV)
(% 50 day avg vol) |
52 Wk Hi
% From Hi |
Featured
Date |
Price
Featured |
Pivot Featured |
|
Max Buy |
PAY
-
NYSE
Verifone Systems Inc
COMPUTER HARDWARE - Transaction Automation Systems
|
$43.92
|
+0.49
1.13% |
$44.22
|
711,307
46.70% of 50 DAV
50 DAV is 1,523,100
|
$44.87
-2.12%
|
1/27/2011
|
$41.77
|
PP = $44.97
|
|
MB = $47.22
|
Most Recent Note - 2/10/2011 7:01:07 PM
Y - Quietly perched near its pivot point after finding support near its 50 DMA line. A subsequent gain with at least +50% above average volume may trigger a new (or add-on) technical buy signal.
>>> The latest Featured Stock Update with an annotated graph appeared on 1/27/2011. Click here.
View all notes |
Alert me of new notes |
CANSLIM.net Company Profile |
SEC |
Zacks Reports |
StockTalk |
News |
Chart |
Request a new note
C
A N
S L
I M
|
PCLN
-
NASDAQ
Priceline.Com Inc
INTERNET - Internet Software and Services
|
$455.43
|
+4.32
0.96% |
$456.50
|
1,099,804
116.70% of 50 DAV
50 DAV is 942,400
|
$459.10
-0.80%
|
11/1/2002
|
$399.55
|
PP = $428.20
|
|
MB = $449.61
|
Most Recent Note - 2/9/2011 1:32:18 PM
G - Color code is changed to green after rising above its "max buy" level with today's gain on higher volume. Traded in a tight range near its 52-week high since its 1/05/11 technical breakout.
>>> The latest Featured Stock Update with an annotated graph appeared on 1/2/2011. Click here.
View all notes |
Alert me of new notes |
CANSLIM.net Company Profile |
SEC |
Zacks Reports |
StockTalk |
News |
Chart |
Request a new note
C
A N
S L
I M
|
RAX
-
NYSE
Rackspace Hosting Inc
INTERNET - Internet Software and; Services
|
$37.02
|
+0.33
0.90% |
$37.50
|
1,978,012
113.50% of 50 DAV
50 DAV is 1,742,700
|
$37.42
-1.07%
|
1/10/2011
|
$22.84
|
PP = $32.76
|
|
MB = $34.40
|
Most Recent Note - 2/9/2011 9:43:36 PM
G - Small gain on average volume today, extended from any sound base. Found prompt support near its 50 DMA line recently. See the latest FSU analysis for details and a new annotated weekly graph.
>>> The latest Featured Stock Update with an annotated graph appeared on 2/9/2011. Click here.
View all notes |
Alert me of new notes |
CANSLIM.net Company Profile |
SEC |
Zacks Reports |
StockTalk |
News |
Chart |
Request a new note
C
A N
S L
I M
|
ROVI
-
NASDAQ
Rovi Corp
COMPUTER SOFTWARE andamp; SERVICES - Security Software andamp; Services
|
$65.00
|
+1.63
2.57% |
$65.00
|
930,936
55.20% of 50 DAV
50 DAV is 1,686,400
|
$69.50
-6.47%
|
10/29/2010
|
$49.99
|
PP = $53.10
|
|
MB = $55.76
|
Most Recent Note - 2/10/2011 4:45:33 PM
G - Still consolidating above its 50 DMA line with volume totals cooling after recently finding support near that important short-term average. The 1/31/11 low ($60.15) now defines another near-term chart support level to watch.
>>> The latest Featured Stock Update with an annotated graph appeared on 1/25/2011. Click here.
View all notes |
Alert me of new notes |
CANSLIM.net Company Profile |
SEC |
Zacks Reports |
StockTalk |
News |
Chart |
Request a new note
C
A N
S L
I M
|
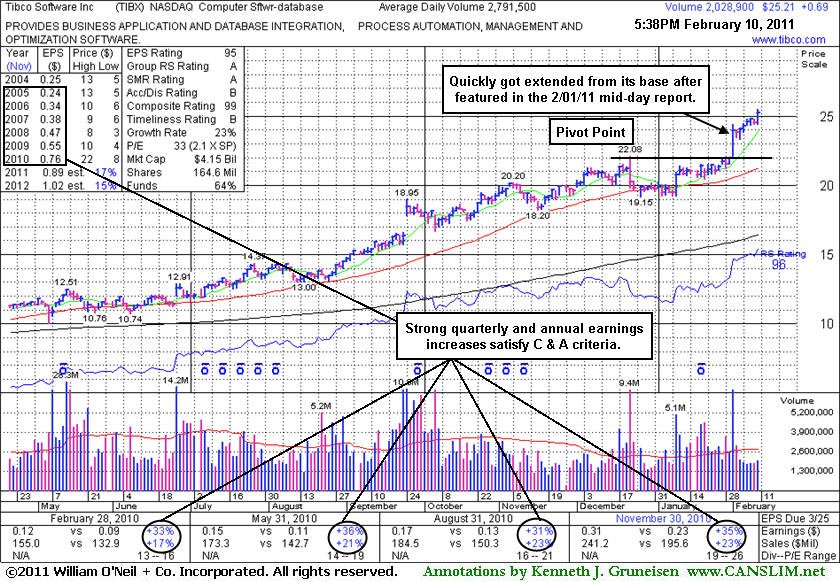
TIBX
-
NASDAQ
Tibco Software Inc
COMPUTER SOFTWARE and SERVICES - Business Software and Services
|
$25.21
|
+0.69
2.81% |
$25.49
|
2,029,531
72.87% of 50 DAV
50 DAV is 2,785,300
|
$24.83
1.53%
|
2/1/2011
|
$24.35
|
PP = $22.18
|
|
MB = $23.29
|
Most Recent Note - 2/10/2011 6:43:14 PM
G - Hit another new 52-week high today with a gain on light volume. Extended from its latest sound base, its prior highs in the $22 area define support. See the latest FSU analysis for details and a new annotated graph.
>>> The latest Featured Stock Update with an annotated graph appeared on 2/10/2011. Click here.
View all notes |
Alert me of new notes |
CANSLIM.net Company Profile |
SEC |
Zacks Reports |
StockTalk |
News |
Chart |
Request a new note
C
A N
S L
I M
|
Symbol/Exchange
Company Name
Industry Group |
PRICE |
CHANGE
(%Change) |
Day High |
Volume
(% DAV)
(% 50 day avg vol) |
52 Wk Hi
% From Hi |
Featured
Date |
Price
Featured |
Pivot Featured |
|
Max Buy |
UA
-
NYSE
Under Armour Inc Cl A
CONSUMER NON-DURABLES - Textile - Apparel Clothing
|
$69.12
|
+2.65
3.99% |
$69.22
|
1,031,434
133.05% of 50 DAV
50 DAV is 775,200
|
$68.65
0.68%
|
1/27/2011
|
$58.31
|
PP = $56.99
|
|
MB = $59.84
|
Most Recent Note - 2/10/2011 4:44:22 PM
G - Hit another new 52-week high with a solid gain on above average volume today. Prior resistance in the $60 area defines initial support to watch above its 50 DMA line.
>>> The latest Featured Stock Update with an annotated graph appeared on 2/1/2011. Click here.
View all notes |
Alert me of new notes |
CANSLIM.net Company Profile |
SEC |
Zacks Reports |
StockTalk |
News |
Chart |
Request a new note
C
A N
S L
I M
|
ULTA
-
NASDAQ
Ulta Salon Cosm & Frag
SPECIALTY RETAIL - Specialty Retail, Other
|
$41.54
|
+0.33
0.80% |
$41.95
|
254,280
40.06% of 50 DAV
50 DAV is 634,700
|
$41.82
-0.67%
|
1/6/2011
|
$36.12
|
PP = $37.34
|
|
MB = $39.21
|
Most Recent Note - 2/8/2011 4:55:46 PM
G - Up on even lighter volume today, closing near the session high and further above its "max buy" level for another new 52-week high. Its color code was changed to green after getting extended from a sound base pattern. Confirming gain on 2/03/11 with +79% above average volume. Its 50 DMA line defines important chart support to watch.
>>> The latest Featured Stock Update with an annotated graph appeared on 1/6/2011. Click here.
View all notes |
Alert me of new notes |
CANSLIM.net Company Profile |
SEC |
Zacks Reports |
StockTalk |
News |
Chart |
Request a new note
C
A N
S L
I M
|