You are not logged in.
This means you
CAN ONLY VIEW reports that were published prior to Monday, April 14, 2025.
You
MUST UPGRADE YOUR MEMBERSHIP if you want to see any current reports.
AFTER MARKET UPDATE - MONDAY, FEBRUARY 10TH, 2014
Previous After Market Report Next After Market Report >>>
|
|
|
|
DOW |
+7.71 |
15,801.79 |
+0.05% |
|
Volume |
640,413,200 |
-15% |
|
Volume |
1,686,983,940 |
-13% |
|
NASDAQ |
+22.31 |
4,148.17 |
+0.54% |
|
Advancers |
1,796 |
57% |
|
Advancers |
1,521 |
57% |
|
S&P 500 |
+2.82 |
1,799.84 |
+0.16% |
|
Decliners |
1,234 |
39% |
|
Decliners |
1,047 |
39% |
|
Russell 2000 |
+2.18 |
1,118.73 |
+0.20% |
|
52 Wk Highs |
62 |
|
|
52 Wk Highs |
67 |
|
|
S&P 600 |
+0.00 |
631.73 |
+0.00% |
|
52 Wk Lows |
16 |
|
|
52 Wk Lows |
13 |
|
|
 |
Major Averages Rose With Lighter Volume Conviction
Kenneth J. Gruneisen - Passed the CAN SLIM® Master's Exam
Monday's volume totals were reported lighter than the prior trading session's volume totals on the Nasdaq exchange and on the NYSE, suggesting that institutional buying demand was not on the rise. Breadth was positive as advancers led decliners by about a 3-2 ratio on the NYSE and on the Nasdaq exchange. There were 26 high-ranked companies from the CANSLIM.net Leaders List that made new 52-week highs and appeared on the CANSLIM.net BreakOuts Page, down from the total of 28 stocks on the prior session. The list of stocks hitting new 52-week highs outnumbered new 52-week lows on the Nasdaq exchange and on the NYSE, an encouraging improvement. There were gains for 8 of the 10 high-ranked companies currently included on the Featured Stocks Page, a list that has recently been waning. The Market (M criteria) has a nascent rally attempt under way. Remember that for any rally to be sustained it is critical for there to be "healthy" leadership - many stocks hitting new 52-week highs.
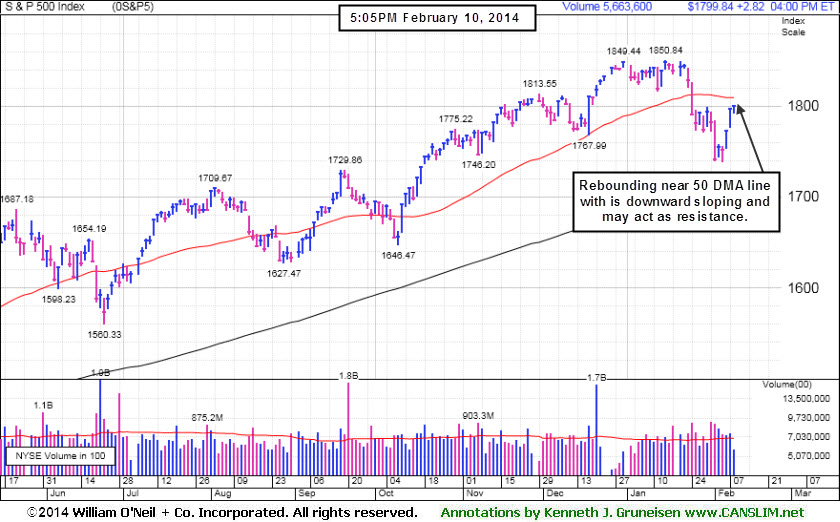
The major averages ended little changed on the session after toggling between gains and losses as investors focused on the Fed and earnings results. Fed Chair Yellen will deliver an update on monetary policy to the House on Tuesday which may provide insight on the status of the central bank's stimulus measures.
Most sectors on the S&P ended higher. Health care stocks showed strength with shares of Gilead Sciences (GILD +2.8%). On the earnings front, a disappointing holiday season dragged on Hasbro's ( HAS +4.53%) fourth-quarter profit yet the company boosted its dividend. In other news, shares of McDonald's (MCD -1.1%) fell despite posting better-than-expected global same-store sales in January. Online review website Yelp Inc (YELP +1.9%) rose on reports that the company had reached a strategic partnership deal with Yahoo! Inc (YHOO +1.42%). Notable profit tallies from Rackspace (RAX +2.15%) and Masco (MAS -1.45%) were due out after Monday's close.
Treasury prices ended modestly higher. The 10-year note was up 2/16 of a point to yield 2.68% and the 30-year bond gained 13/32 to yield 3.66%.
The CANSLIM.net Featured Stocks Page shows the most action-worthy candidates and their latest notes and a Headline Link directs members to the latest detailed analysis with data-packed graphs annotated by a Certified expert along with links to additional resources. The Premium Member Homepage includes "dynamic archives" to all prior pay reports published. Watch for an announcement via email concerning the next WEBCAST.
PICTURED: The S&P 500 Index rebounded near its 50-day moving average (DMA) line on Monday for what may be considered "Day 3" of a new rally attempt. Prior commentaries published here pointed out that last Wedneday's lows undercut Tuesday's lows for all of the major indices. Under the fact-based investment system it is most ideal for at least one of the major averages to produce as solid follow-through day (FTD) of big gains on higher volume between Days 4-7 of a new rally effort. Use caution and remain disciplined in following proper sell rules under the fact-based investment system.
|
 Kenneth J. Gruneisen started out as a licensed stockbroker in August 1987, a couple of months prior to the historic stock market crash that took the Dow Jones Industrial Average down -22.6% in a single day. He has published daily fact-based fundamental and technical analysis on high-ranked stocks online for two decades. Through FACTBASEDINVESTING.COM, Kenneth provides educational articles, news, market commentary, and other information regarding proven investment systems that work in good times and bad.
Comments contained in the body of this report are technical opinions only and are not necessarily those of Gruneisen Growth Corp. The material herein has been obtained from sources believed to be reliable and accurate, however, its accuracy and completeness cannot be guaranteed. Our firm, employees, and customers may effect transactions, including transactions contrary to any recommendation herein, or have positions in the securities mentioned herein or options with respect thereto. Any recommendation contained in this report may not be suitable for all investors and it is not to be deemed an offer or solicitation on our part with respect to the purchase or sale of any securities. |
|
 |
Gold & Silver, Tech and Financial Groups Rose
Kenneth J. Gruneisen - Passed the CAN SLIM® Master's Exam
Financial shares inched higher as the Bank Index ($BKX +0.10%) and the Broker/Dealer Index ($XBD +0.32%) posted small gains while the Retail Index ($RLX +0.02%) finished flat. The Gold & Silver Index ($XAU +3.07%) posted a solid gain, meanwhile, energy-related shares had a slightly negative bias as the Integrated Oil Index ($XOI -0.66%) and the Oil Services Index ($OSX -0.55%) edged lower. The Biotechnology Index ($BTK +2.03%) led the tech sector while the Networking Index ($NWX +0.35%) and the Semiconductor Index ($SOX +0.51%) posted smaller gains.
Charts courtesy www.stockcharts.com
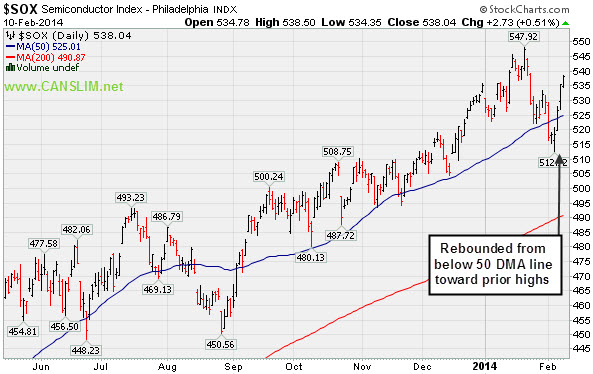
PICTURED: The Semiconductor Index ($SOX +0.51%) rebounded from below its 50-day moving average (DMA) line toward prior highs.
| Oil Services |
$OSX |
263.60 |
-1.47 |
-0.55% |
-6.20% |
| Integrated Oil |
$XOI |
1,405.41 |
-9.33 |
-0.66% |
-6.50% |
| Semiconductor |
$SOX |
538.04 |
+2.73 |
+0.51% |
+0.56% |
| Networking |
$NWX |
342.51 |
+1.18 |
+0.35% |
+5.73% |
| Broker/Dealer |
$XBD |
153.72 |
+0.49 |
+0.32% |
-4.26% |
| Retail |
$RLX |
886.01 |
+0.15 |
+0.02% |
-5.72% |
| Gold & Silver |
$XAU |
95.05 |
+2.83 |
+3.07% |
+12.95% |
| Bank |
$BKX |
67.84 |
+0.07 |
+0.10% |
-2.05% |
| Biotech |
$BTK |
2,582.25 |
+51.43 |
+2.03% |
+10.81% |
|
|
|
 |
Hovering Near All-Time Highs Extended From Sound Base
Kenneth J. Gruneisen - Passed the CAN SLIM® Master's Exam
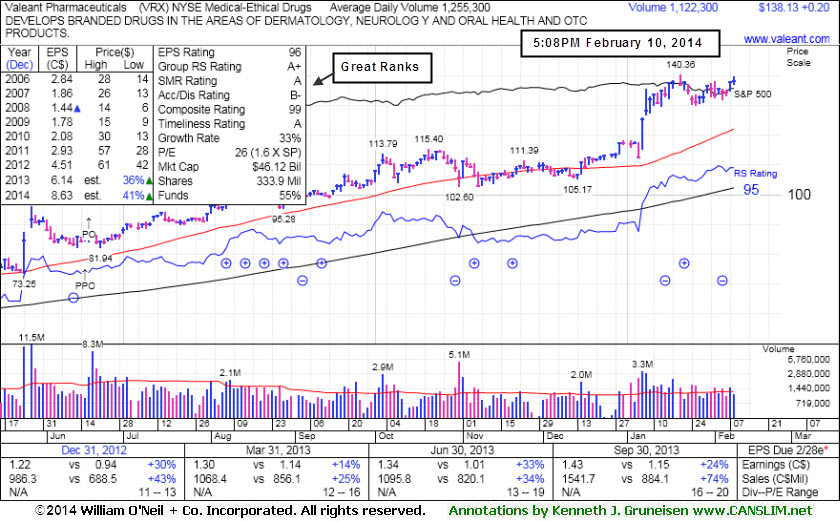
Valeant Pharmaceuticals International, Inc (VRX +$0.20 or +0.15% to $138.13) is hovering quietly near all-time highs, extended from any sound base. Its 50-day moving average (DMA) line ($122) defines near-term support to watch. VRX was last shown in this FSU section on 1/21/14 with annotated daily and weekly graphs under the headline, "Bullish Action Has Continued Despite Fundamental Concerns", as it touched a new all-time high ($140.36) then reversed into the red.
Bullish action continued since it reported earnings +24% on +74% sales revenues for the Sep '13 quarter, a notch below the +25% minimum guideline (C criteria), so prior reports cautioned members -"While it may be forming a sound new base, fundamentals may be an overriding concern." Earnings rose +33% on +34% sales revenues for the Jun '13 quarter, above the +25% minimum earnings guideline (C criteria) a strong follow-up after concerns had been raised by its Mar '13 earnings report with only a +14% earnings increase (see red circles). A downturn in FY '07 and '08 earnings (A criteria) has been followed by a strong earnings rebound in recent years. Return On Equity is currently reported at 37%, well above the 17% minimum guideline of the fact-based system.
The number of top-rated funds owning its shares rose from 818 in Mar '12 in to 1,060 in Dec '13, a reassuring trend concerning the I criteria. The high-ranked Medical - Ethical Drugs firm's shares spiked higher in late May at around the time of M&A news that it would buy Bausch & Lomb for $8.7 billion. It completed Public Offering on 6/18/13. The upshot of Public Offerings is that when completed the end result is typically an increase in the total number of institutional owners. Institutional owners are often supportive of their existing positions and will even accumulate more shares when they consolidate near classic support levels like the 50-day and 200-day moving average (DMA) lines, if they are still believers in the company. If too many become pessimistic and decide to unload, this is what ends up sending the stocks slicing through support.
Prior reports noted - "Investors are taught in the Certification to only buy stocks with a combination of both strong fundamentals and strong technical action, however stocks should be sold based on their technical action only. In this example, more bullish action rewarded patient investors still giving it the benefit of the doubt until any technical sell signals start adding up."
|
|
|
Color Codes Explained :
Y - Better candidates highlighted by our
staff of experts.
G - Previously featured
in past reports as yellow but may no longer be buyable under the
guidelines.
***Last / Change / Volume data in this table is the closing quote data***
Symbol/Exchange
Company Name
Industry Group |
PRICE |
CHANGE
(%Change) |
Day High |
Volume
(% DAV)
(% 50 day avg vol) |
52 Wk Hi
% From Hi |
Featured
Date |
Price
Featured |
Pivot Featured |
|
Max Buy |
EQM
-
NYSE
E Q T Midstream Partners
ENERGY - Oil and Gas Pipelines
|
$64.87
|
-0.13
-0.20% |
$65.62
|
75,618
74.87% of 50 DAV
50 DAV is 101,000
|
$65.83
-1.46%
|
12/12/2013
|
$53.17
|
PP = $56.51
|
|
MB = $59.34
|
Most Recent Note - 2/7/2014 6:11:38 PM
G - Hit a new 52-week high today. It is extended from any sound base pattern. Prior highs in the $56 area define support to watch on pullbacks. See the latest FSU analysis for more details and new annotated graphs.
>>> FEATURED STOCK ARTICLE : Leader Still Extended From Any Sound Base - 2/7/2014
View all notes |
Set NEW NOTE alert |
CANSLIM.net Company Profile |
SEC
News |
Chart |
Request a new note
C
A N
S L
I M


|
FB
-
NASDAQ
Facebook Inc Cl A
INTERNET
|
$63.55
|
-0.77
-1.20% |
$64.49
|
43,642,841
67.20% of 50 DAV
50 DAV is 64,940,000
|
$64.57
-1.58%
|
12/12/2013
|
$51.40
|
PP = $54.93
|
|
MB = $57.68
|
Most Recent Note - 2/6/2014 5:56:26 PM
Y - Market conditions still argue against new buying efforts until a FTD from at least one of the major averages confirms a new rally. One may consider a valid secondary buy point up to $62.28, as previously noted. See the latest FSU analysis for more details and new annotated graphs.
>>> FEATURED STOCK ARTICLE : Volume Totals Cooling While Holding Ground at Highs - 2/6/2014
View all notes |
Set NEW NOTE alert |
CANSLIM.net Company Profile |
SEC
News |
Chart |
Request a new note
C
A N
S L
I M
|
JAZZ
-
NASDAQ
Jazz Pharmaceuticals Plc
DRUGS - Biotechnology
|
$153.98
|
+0.88
0.57% |
$155.21
|
819,649
93.78% of 50 DAV
50 DAV is 874,000
|
$159.14
-3.24%
|
9/30/2013
|
$93.20
|
PP = $89.10
|
|
MB = $93.56
|
Most Recent Note - 2/7/2014 12:21:19 PM
G - Rebounding near its 52-week high with a solid gain today. It is extended from any sound base and its 50 DMA line ($132.10 now) defines important support to watch on pullbacks.
>>> FEATURED STOCK ARTICLE : Consolidating After Getting Very Extended - 2/5/2014
View all notes |
Set NEW NOTE alert |
CANSLIM.net Company Profile |
SEC
News |
Chart |
Request a new note
C
A N
S L
I M
|
KORS
-
NYSE
Michael Kors Hldgs Ltd
RETAIL - Apparel Stores
|
$95.56
|
+1.34
1.42% |
$95.76
|
3,825,248
94.78% of 50 DAV
50 DAV is 4,036,000
|
$94.43
1.20%
|
2/4/2014
|
$90.92
|
PP = $84.68
|
|
MB = $88.91
|
Most Recent Note - 2/5/2014 12:29:08 PM
Y - Holding its ground at its 52-week high following a "breakaway gap" on the prior session new all-time highs. Reported strong +73% earnings on +59% sales revenues for the Dec '13 quarter, continuing its strong earnings record. Color code was changed to yellow with new pivot point cited based on its 12/19/13 high plus 10 cents. Considerable volume-driven gain triggered a technical buy signal, however the broader market (M criteria) environment still argues for caution until at least one of the major averages produces a solid follow-through day of gains on higher volume.
>>> FEATURED STOCK ARTICLE : Down on Higher Volume Ahead of Quarterly Earnings Report - 2/3/2014
View all notes |
Set NEW NOTE alert |
CANSLIM.net Company Profile |
SEC
News |
Chart |
Request a new note
C
A N
S L
I M
|
PCLN
-
NASDAQ
Priceline.com Inc
INTERNET - Internet Software and Services
|
$1,207.82
|
+12.43
1.04% |
$1,212.00
|
583,968
98.15% of 50 DAV
50 DAV is 595,000
|
$1,214.97
-0.59%
|
12/18/2013
|
$1,156.20
|
PP = $1,198.85
|
|
MB = $1,258.79
|
Most Recent Note - 2/7/2014 12:40:56 PM
Y - Rebounding above its 50 DMA line today with a gap up and considerable volume-driven gain. Color code is changed to yellow after proving resilient, but no new pivot point is being cited. Recent low ($1,103.90 on 2/05/14) defines near-term support to watch where further deterioration would raise greater concerns.
>>> FEATURED STOCK ARTICLE : Violation of 50-Day Average After Failing to Trigger New Buy Signal - 1/29/2014
View all notes |
Set NEW NOTE alert |
CANSLIM.net Company Profile |
SEC
News |
Chart |
Request a new note
C
A N
S L
I M
|
Symbol/Exchange
Company Name
Industry Group |
PRICE |
CHANGE
(%Change) |
Day High |
Volume
(% DAV)
(% 50 day avg vol) |
52 Wk Hi
% From Hi |
Featured
Date |
Price
Featured |
Pivot Featured |
|
Max Buy |
RGR
-
NYSE
Sturm Ruger & Co Inc
CONSUMER DURABLES - Sporting Goods
|
$74.73
|
+0.77
1.04% |
$75.69
|
328,156
87.98% of 50 DAV
50 DAV is 373,000
|
$85.93
-13.03%
|
1/8/2014
|
$78.87
|
PP = $80.38
|
|
MB = $84.40
|
 Most Recent Note - 2/10/2014 1:57:28 PM
G- Today's 3rd consecutive gain on light volume has it rebounding near its 50 DMA line which may now act as resistance. Faces overhead supply up through the $85 level after recent distributional action.
>>> FEATURED STOCK ARTICLE : Slumped Into Prior Base Negating Breakout and Violated 50-Day Average - 2/4/2014
View all notes |
Set NEW NOTE alert |
CANSLIM.net Company Profile |
SEC
News |
Chart |
Request a new note
C
A N
S L
I M
|
SFUN
-
NYSE
Soufun Hldgs Ltd Ads A
INTERNET - Internet Information Providers
|
$78.83
|
+0.34
0.43% |
$82.60
|
4,283,910
341.35% of 50 DAV
50 DAV is 1,255,000
|
$95.39
-17.36%
|
10/17/2013
|
$58.02
|
PP = $53.87
|
|
MB = $56.56
|
Most Recent Note - 2/10/2014 5:45:03 PM
G - Traded above its 50 DMA line intra-day but encountered resistance and finished in the lower half of the session's range. A rebound above that short-term average is needed to help its outlook improve.
>>> FEATURED STOCK ARTICLE : 50-Day Moving Average Defines Near Term Support After Great Rally - 1/31/2014
View all notes |
Set NEW NOTE alert |
CANSLIM.net Company Profile |
SEC
News |
Chart |
Request a new note
C
A N
S L
I M
|
SILC
-
NASDAQ
Silicom Ltd
COMPUTER HARDWARE - Networking andamp; Communication Dev
|
$64.94
|
+0.72
1.12% |
$65.05
|
93,717
161.58% of 50 DAV
50 DAV is 58,000
|
$64.50
0.68%
|
12/23/2013
|
$44.62
|
PP = $46.25
|
|
MB = $48.56
|
Most Recent Note - 2/5/2014 12:33:09 PM
G - Still hovering near its 52-week high, extended from any sound base. Stubbornly holding its ground since a considerable gap up on 1/23/14 after reporting earnings +92% on +52% sales for the Dec '13 quarter, beating consensus estimates.
>>> FEATURED STOCK ARTICLE : Considerable Gap Up Following Strong Earnings Report - 1/23/2014
View all notes |
Set NEW NOTE alert |
CANSLIM.net Company Profile |
SEC
News |
Chart |
Request a new note
C
A N
S L
I M
|
ULTI
-
NASDAQ
Ultimate Software Group
INTERNET - Internet Software and Services
|
$158.71
|
+0.23
0.15% |
$159.20
|
147,628
79.80% of 50 DAV
50 DAV is 185,000
|
$168.43
-5.77%
|
1/27/2014
|
$153.75
|
PP = $162.98
|
|
MB = $171.13
|
Most Recent Note - 2/5/2014 12:40:46 PM
Y - Touched another new 52-week high then undercut its 50 DMA line following a "negative reversal" after reporting earnings +42% on +21% sales for the Dec '13 quarter. Prior gains confirmed a technical buy signal, yet recent reports cautioned members - "Broader market conditions (M criteria) argue for caution until at least one of the major averages produces a convincing follow through day of gains on higher volume."
>>> FEATURED STOCK ARTICLE : Forming New Base But Enduring Distributional Pressure - 1/27/2014
View all notes |
Set NEW NOTE alert |
CANSLIM.net Company Profile |
SEC
News |
Chart |
Request a new note
C
A N
S L
I M
|
VRX
-
NYSE
Valeant Pharmaceuticals
DRUGS - Drug Manufacturers - Other
|
$138.13
|
+0.20
0.15% |
$139.74
|
1,122,396
89.43% of 50 DAV
50 DAV is 1,255,000
|
$140.36
-1.59%
|
9/11/2013
|
$100.26
|
PP = $105.50
|
|
MB = $110.78
|
Most Recent Note - 2/10/2014 1:59:16 PM
G - Hovering quietly near all-time highs, extended from any sound base. Its 50 DMA line ($122) defines near-term support to watch.
>>> FEATURED STOCK ARTICLE : Hovering Near All-Time Highs Extended From Sound Base - 2/10/2014
View all notes |
Set NEW NOTE alert |
CANSLIM.net Company Profile |
SEC
News |
Chart |
Request a new note
C
A N
S L
I M
|
Symbol/Exchange
Company Name
Industry Group |
PRICE |
CHANGE
(%Change) |
Day High |
Volume
(% DAV)
(% 50 day avg vol) |
52 Wk Hi
% From Hi |
Featured
Date |
Price
Featured |
Pivot Featured |
|
Max Buy |
|
|
|
THESE ARE NOT BUY RECOMMENDATIONS!
Comments contained in the body of this report are technical
opinions only. The material herein has been obtained
from sources believed to be reliable and accurate, however,
its accuracy and completeness cannot be guaranteed.
This site is not an investment advisor, hence it does
not endorse or recommend any securities or other investments.
Any recommendation contained in this report may not
be suitable for all investors and it is not to be deemed
an offer or solicitation on our part with respect to
the purchase or sale of any securities. All trademarks,
service marks and trade names appearing in this report
are the property of their respective owners, and are
likewise used for identification purposes only.
This report is a service available
only to active Paid Premium Members.
You may opt-out of receiving report notifications
at any time. Questions or comments may be submitted
by writing to Premium Membership Services 665 S.E. 10 Street, Suite 201 Deerfield Beach, FL 33441-5634 or by calling 1-800-965-8307
or 954-785-1121.
|
|
|

