You are not logged in.
This means you
CAN ONLY VIEW reports that were published prior to Sunday, February 25, 2024.
You
MUST UPGRADE YOUR MEMBERSHIP if you want to see any current reports.
AFTER MARKET UPDATE - TUESDAY, FEBRUARY 8TH, 2022
Previous After Market Report Next After Market Report >>>
|
|
|
|
DOW |
+371.65 |
35,462.78 |
+1.06% |
|
Volume |
890,398,996 |
+1% |
|
Volume |
4,227,895,500 |
+0% |
|
NASDAQ |
+178.79 |
14,194.45 |
+1.28% |
|
Advancers |
1,970 |
60% |
|
Advancers |
2,735 |
62% |
|
S&P 500 |
+37.67 |
4,521.54 |
+0.84% |
|
Decliners |
1,320 |
40% |
|
Decliners |
1,710 |
38% |
|
Russell 2000 |
+32.77 |
2,045.37 |
+1.63% |
|
52 Wk Highs |
58 |
|
|
52 Wk Highs |
71 |
|
|
S&P 600 |
+22.88 |
1,307.70 |
+1.78% |
|
52 Wk Lows |
242 |
|
|
52 Wk Lows |
249 |
|
|
Since the Monday, January 31st follow-through day in the market (M criteria) confirmed a new uptrend, new buying efforts may be made in stocks fitting all key criteria of the fact-based investment system.
|
 |
Leadership Improved and Major Indices Rose
Kenneth J. Gruneisen - Passed the CAN SLIM® Master's Exam
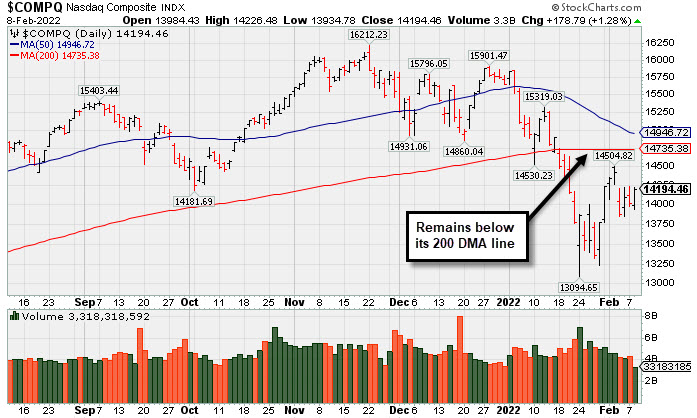
The Dow jumped 371 points, while the S&P 500 gained 0.8%. The Nasdaq Composite rallied 1.3%. Small-caps outperformed with the Russell 2000 climbing 1.5%. Volume totals reported were higher than the prior session on the NYSE and on the Nasdaq exchange. Advancers led decliners by about a 3-2 margin on the NYSE and on the Nasdaq exchange. Leadership improved as there were 38 high-ranked companies from the Leaders List that hit new 52-week highs and were listed on the BreakOuts Page, versus 15 on the prior session. New 52-week lows solidly outnumbered new highs on the NYSE and on the Nasdaq exchange. A follow-through day on Monday, January 31st confirmed a new uptrend for the market averages (M criteria). PICTURED: The Nasdaq Composite Index remains below its 200-day moving average (DMA) line.
U.S. stocks finished firmly higher on Tuesday as investors emerged to buy the dip in equities and digested a flurry of corporate updates. Eight of 11 S&P 500 sectors closed in positive territory. Materials paced the gains with DuPont de Nemours Inc. (DD +6.32%) rose following a top and bottom line beat and dividend increase. Energy shares bucked the uptrend amid a drop in oil prices. West Texas Intermediate crude shed 1.8% to $89.68/barrel on the prospect of de-escalating tensions over Ukraine and progress in U.S.-Iran nuclear talks. In other corporate news, Amgen Inc. (AMGN +7.82%) rose after exceeding consensus profit expectations amid a boost in revenue from manufacturing COVID-19 antibodies. Elsewhere, Peloton Interactive Inc. (PTON +25.28%) rose after announcing restructuring plans that include reducing its workforce by 20% and replacing its CEO, capping a two-day rally of more than 50%. Meanwhile, cybersecurity firm Mandiant (MNDT +17.86%) rose amid reports Microsoft (MSFT +1.20%) was discussing a potential acquisition of the company.
Treasuries extended their recent rout, with the yield on the 10-year note up four basis points (0.04%) to 1.96%, its highest level since late 2019, ahead of the maturity’s $37 billion auction tomorrow. The benchmark yield has climbed 46 basis points (0.46%) year-to-date as market participants brace for swift monetary policy tightening from the Federal Reserve as officials prioritize combating elevated inflation. On Thursday, a report is forecasted to show consumer prices climbing at the fastest annual pace in 40 years.
|
 Kenneth J. Gruneisen started out as a licensed stockbroker in August 1987, a couple of months prior to the historic stock market crash that took the Dow Jones Industrial Average down -22.6% in a single day. He has published daily fact-based fundamental and technical analysis on high-ranked stocks online for two decades. Through FACTBASEDINVESTING.COM, Kenneth provides educational articles, news, market commentary, and other information regarding proven investment systems that work in good times and bad.
Comments contained in the body of this report are technical opinions only and are not necessarily those of Gruneisen Growth Corp. The material herein has been obtained from sources believed to be reliable and accurate, however, its accuracy and completeness cannot be guaranteed. Our firm, employees, and customers may effect transactions, including transactions contrary to any recommendation herein, or have positions in the securities mentioned herein or options with respect thereto. Any recommendation contained in this report may not be suitable for all investors and it is not to be deemed an offer or solicitation on our part with respect to the purchase or sale of any securities. |
|
 |
Retail, Financial, Semiconductor, and Gold & Silver Indexes Rose
Kenneth J. Gruneisen - Passed the CAN SLIM® Master's Exam
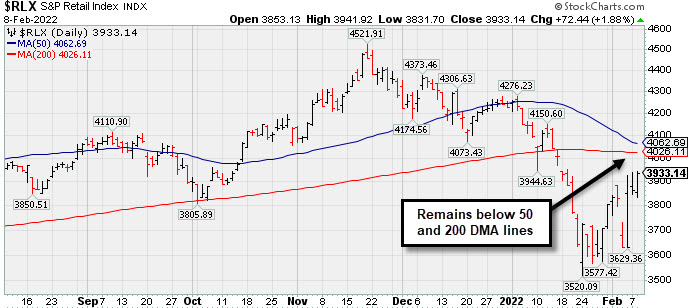
The Broker/Dealer Index ($XBD +2.29%), Bank Index ($BKX +2.03%), and Retail Index ($RLX +1.88%) all posted influential gains. The Semiconductor Index ($SOX +2.40%) led the tech sector while the Networking Index ($NWX +1.05%) posted a smaller gain but the Biotech Index ($BTK -0.53%) edged lower. Commodity-linked groups were mixed as the Gold & Silver Index ($XAU +1.96%) posted a gain while the Oil Services Index ($OSX -2.47%) and the Integrated Oil Index ($XOI -2.14%) both lost ground.
PICTURED: The Retail Index ($RLX +1.88%) remains below its 50-day and 200-day moving average (DMA) lines.
| Oil Services |
$OSX |
65.72 |
-1.67 |
-2.47% |
+24.65% |
| Integrated Oil |
$XOI |
1,433.22 |
-31.32 |
-2.14% |
+21.65% |
| Semiconductor |
$SOX |
3,535.13 |
+82.79 |
+2.40% |
-10.42% |
| Networking |
$NWX |
858.08 |
+8.95 |
+1.05% |
-11.64% |
| Broker/Dealer |
$XBD |
504.82 |
+11.29 |
+2.29% |
+3.69% |
| Retail |
$RLX |
3,933.14 |
+72.44 |
+1.88% |
-6.94% |
| Gold & Silver |
$XAU |
131.39 |
+2.52 |
+1.96% |
-0.80% |
| Bank |
$BKX |
143.77 |
+2.86 |
+2.03% |
+8.73% |
| Biotech |
$BTK |
5,103.06 |
-27.23 |
-0.53% |
-7.53% |
|
|
|
 |
Featured Stocks
Kenneth J. Gruneisen - Passed the CAN SLIM® Master's Exam
|
|
|
Color Codes Explained :
Y - Better candidates highlighted by our
staff of experts.
G - Previously featured
in past reports as yellow but may no longer be buyable under the
guidelines.
***Last / Change / Volume data in this table is the closing quote data***
Symbol/Exchange
Company Name
Industry Group |
PRICE |
CHANGE
(%Change) |
Day High |
Volume
(% DAV)
(% 50 day avg vol) |
52 Wk Hi
% From Hi |
Featured
Date |
Price
Featured |
Pivot Featured |
|
Max Buy |
 REGN
-
NASDAQ
REGN
-
NASDAQ
Regeneron Pharmaceutical
DRUGS - Biotechnology
|
$617.94
|
-4.42
-0.71% |
$621.90
|
844,473
106.90% of 50 DAV
50 DAV is 790,000
|
$686.62
-10.00%
|
12/13/2021
|
$647.95
|
PP = $686.72
|
|
MB = $721.06
|
 Most Recent Note - 2/8/2022 5:14:11 PM
G - Still meeting resistance near its 50 DMA line ($626.73). Gains above that important short-term average are needed for its outlook to improve. Reported Dec '21 quarterly earnings +149% on +104% sales revenues versus the year ago period. Recently holding its ground in a tight range above prior lows and above its 200 DMA line ($594) which define the important near-term support.
>>> FEATURED STOCK ARTICLE : Earnings News Due While Consolidating Above 200 DMA Line - 2/1/2022 |
View all notes |
Set NEW NOTE alert |
Company Profile |
SEC
News |
Chart |
Request a new note
C
A
S
I |
SF
-
NYSE
Stifel Financial Corp
FINANCIAL SERVICES - Investment Brokerage - Regiona
|
$81.43
|
+4.06
5.25% |
$81.67
|
1,359,334
243.17% of 50 DAV
50 DAV is 559,000
|
$78.60
3.60%
|
1/27/2022
|
$74.17
|
PP = $76.23
|
|
MB = $80.04
|
Most Recent Note - 2/8/2022 5:15:33 PM
G - Color code is changed to green after hitting a new 52-week high and closing well above its "max buy" level with today's gain backed by +143% above average volume, getting extended from the previously noted "double bottom" base. Prior highs in the $76-78 area define initial support to watch on pullbacks.
>>> FEATURED STOCK ARTICLE : Formed Double Bottom Base and Faces Little Resistance - 1/27/2022 |
View all notes |
Set NEW NOTE alert |
Company Profile |
SEC
News |
Chart |
Request a new note
C
A
S
I |
TGH
-
NYSE
Textainer Group Holdings
TRANSPORTATION - Logistics
|
$40.82
|
+2.60
6.80% |
$41.35
|
1,221,505
352.02% of 50 DAV
50 DAV is 347,000
|
$41.24
-1.02%
|
1/31/2022
|
$36.68
|
PP = $41.34
|
|
MB = $43.41
|
Most Recent Note - 2/8/2022 5:17:40 PM
Y - Touched a new 52-week high today but it did not close above its pivot point despite a big volume-driven gain after a consolidation above support at its 50 DMA line ($36.19). Due to report Dec '21 quarterly results on 2/10/22. Volume and volatility often increase near earnings news. Subsequent gains above the pivot point backed by at least +40% above average volume are needed to trigger a technical buy signal. Highlighted in yellow with pivot point cited based on its 11/05/21 high plus 10 cents in the 1/31/22 mid-day report.
>>> FEATURED STOCK ARTICLE : Consolidating Above 50-Day Moving Average - 1/31/2022 |
View all notes |
Set NEW NOTE alert |
Company Profile |
SEC
News |
Chart |
Request a new note
C
A
S
I |
HWKN
-
NASDAQ
Hawkins Inc
CHEMICALS - Basic Chemicals
|
$41.50
|
+1.85
4.67% |
$41.63
|
81,390
150.72% of 50 DAV
50 DAV is 54,000
|
$41.38
0.29%
|
2/3/2022
|
$39.81
|
PP = $41.07
|
|
MB = $43.12
|
Most Recent Note - 2/8/2022 5:11:26 PM
Y - Posted a solid volume-driven gain today hitting a new all-time high and clinching a technical buy signal. It was highlighted in yellow with pivot point cited based on its 1/04/22 high plus 10 cents in the 2/03/22 mid-day report following a gap up, rebounding above its 50 DMA line ($37.92).
>>> FEATURED STOCK ARTICLE : Bullish Action Followed Another Strong Quarterly Report - 2/3/2022 |
View all notes |
Set NEW NOTE alert |
Company Profile |
SEC
News |
Chart |
Request a new note
C
A
S
I |
|
|
|
THESE ARE NOT BUY RECOMMENDATIONS!
Comments contained in the body of this report are technical
opinions only. The material herein has been obtained
from sources believed to be reliable and accurate, however,
its accuracy and completeness cannot be guaranteed.
This site is not an investment advisor, hence it does
not endorse or recommend any securities or other investments.
Any recommendation contained in this report may not
be suitable for all investors and it is not to be deemed
an offer or solicitation on our part with respect to
the purchase or sale of any securities. All trademarks,
service marks and trade names appearing in this report
are the property of their respective owners, and are
likewise used for identification purposes only.
This report is a service available
only to active Paid Premium Members.
You may opt-out of receiving report notifications
at any time. Questions or comments may be submitted
by writing to Premium Membership Services 665 S.E. 10 Street, Suite 201 Deerfield Beach, FL 33441-5634 or by calling 1-800-965-8307
or 954-785-1121.
|
|
|