You are not logged in.
This means you
CAN ONLY VIEW reports that were published prior to Monday, April 14, 2025.
You
MUST UPGRADE YOUR MEMBERSHIP if you want to see any current reports.
AFTER MARKET UPDATE - TUESDAY, FEBRUARY 8TH, 2011
Previous After Market Report Next After Market Report >>>
|
|
|
|
DOW |
+71.52 |
12,233.15 |
+0.59% |
|
Volume |
888,949,170 |
+1% |
|
Volume |
1,753,854,020 |
+1% |
|
NASDAQ |
+13.06 |
2,797.05 |
+0.47% |
|
Advancers |
1,915 |
61% |
|
Advancers |
1,540 |
56% |
|
S&P 500 |
+5.52 |
1,324.57 |
+0.42% |
|
Decliners |
1,101 |
35% |
|
Decliners |
1,114 |
40% |
|
Russell 2000 |
+5.37 |
813.69 |
+0.66% |
|
52 Wk Highs |
266 |
|
|
52 Wk Highs |
168 |
|
|
S&P 600 |
+2.36 |
430.92 |
+0.55% |
|
52 Wk Lows |
11 |
|
|
52 Wk Lows |
19 |
|
|
 |
Major Averages Extend Impressive Winning Streak
Kenneth J. Gruneisen - Passed the CAN SLIM® Master's Exam
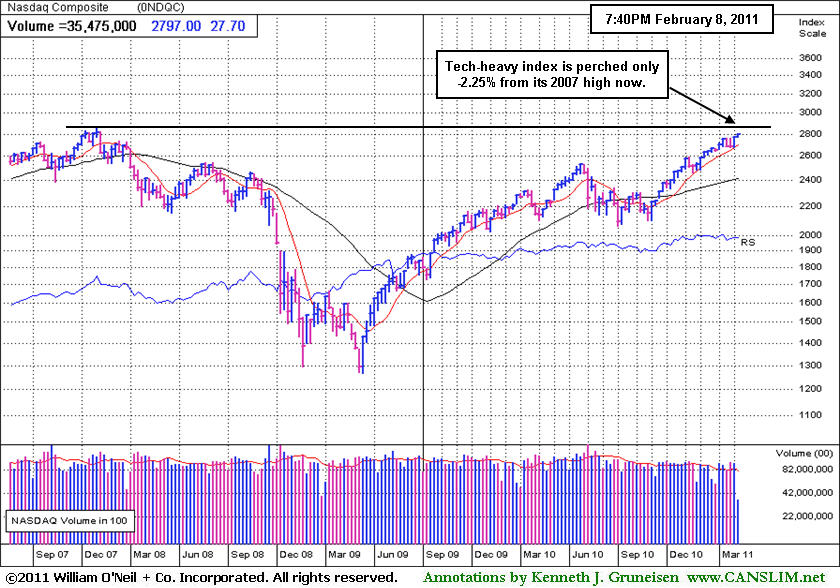
The Dow Jones Industrial Average's winning streak was extended on Tuesday to a 7th straight session, its longest string of daily gains since July. The Nasdaq Composite Index rose to its highest since November of 2007. The volume totals were light, yet they were reported slightly higher on the NYSE and on the Nasdaq exchange versus the prior session totals. Advancing issues beat decliners by 3-2 on the NYSE and by 4-3 on the Nasdaq. New 52-week highs outnumbered new 52-week lows on the NYSE and on the Nasdaq exchange. There was a total of 83 high-ranked companies from the CANSLIM.net Leaders List that made new 52-week highs and appeared on the CANSLIM.net BreakOuts Page, down from the total of 139 on the prior session. On the Featured Stocks Page there were losses for 5 of the 22 high-ranked market leaders.
Retailers advanced after a positive week of sales, and bank shares gained as an analyst predicted dividend hikes soon. The positive trend triumphed over concerns about the effects of another rate hike in China. McDonalds (MCD +2.6%) added 15 points to the Dow Industrials after reporting better-than-expected global sales in January. Tuesday morning a reporter on CNBC pointed out new 52-week highs occurring in 8 of the 30 Dow components.
There was a merger of firms offering rehabilitation services, and both companies' shares rose substantially after Kindred Healthcare (KND +28.34%) announced plans to buy RehabCare Group Inc (RHB +45.47%) . Avon Products Inc (AVP -3%) missed the party, falling on an unexpected drop in profits. Mining stocks gained as gold prices jumped to a two-week high.
After the first positive January in four years, the stock market is off to the races in February while a strong rally remains in progress on Wall Street. This week began with the Dow Jones Industrial Average, Nasdaq Composite Index, S&P 500 Index, and the Mid-Cap S&P 400 Index collectively hitting new recovery highs. Read the February 2011 issue of CANSLIM.net News for a comprehensive overview of current market conditions, leading groups, and the most recent featured stocks.
PICTURED: The Nasdaq Composite Index is now perched only -2.25% from its 2007 high. It is the closest of the 3 major averages to within completely recovering all that was lost in the 2007-2009 Bear Market.
|
 Kenneth J. Gruneisen started out as a licensed stockbroker in August 1987, a couple of months prior to the historic stock market crash that took the Dow Jones Industrial Average down -22.6% in a single day. He has published daily fact-based fundamental and technical analysis on high-ranked stocks online for two decades. Through FACTBASEDINVESTING.COM, Kenneth provides educational articles, news, market commentary, and other information regarding proven investment systems that work in good times and bad.
Comments contained in the body of this report are technical opinions only and are not necessarily those of Gruneisen Growth Corp. The material herein has been obtained from sources believed to be reliable and accurate, however, its accuracy and completeness cannot be guaranteed. Our firm, employees, and customers may effect transactions, including transactions contrary to any recommendation herein, or have positions in the securities mentioned herein or options with respect thereto. Any recommendation contained in this report may not be suitable for all investors and it is not to be deemed an offer or solicitation on our part with respect to the purchase or sale of any securities. |
|
 |
Retail Index Rallies For Recovery High
Kenneth J. Gruneisen - Passed the CAN SLIM® Master's Exam
Defensive groups were standout gainers on Tuesday as the Healthcare Index ($HMO +1.64%) and Gold & Silver Index ($XAU +1.82%) outpaced other groups. The Retail Index ($RLX +1.49%) had a positive influence on the major averages and financial shares rose while the Broker/Dealer Index ($XBD +0.64%) and Bank Index ($BKX +0.75%) enjoyed modest gains. The Internet Index ($IIX +0.77%) and Networking Index ($NWX +0.78%) were the best tech sector gainers while the Biotechnology Index ($BTK +0.17%) edged higher and the Semiconductor Index ($SOX -0.08%) inched lower. The Integrated Oil Index ($XOI +0.01%) held its ground and the Oil Services Index ($OSX -0.59%) lagged.
Charts courtesy www.stockcharts.com
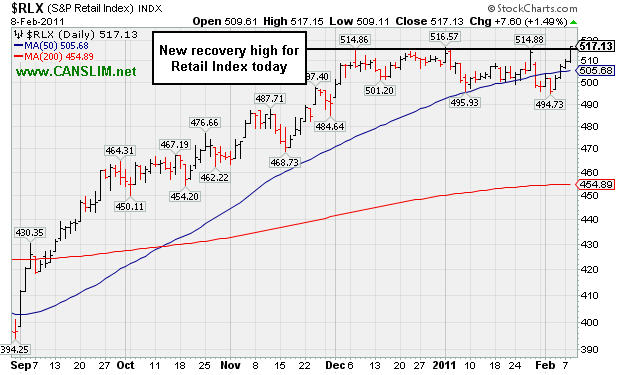
PICTURED: The Retail Index ($RLX +1.49%) posted its 4th consecutive gain and rallied to a new recovery high. As a sign consumers are getting back to full spending mode, for the first time since September 2008, revolving credit increased. There is almost no doubt this happened from demand and not looser lending standards.
| Oil Services |
$OSX |
268.31 |
-1.59 |
-0.59% |
+9.46% |
| Healthcare |
$HMO |
1,945.78 |
+31.40 |
+1.64% |
+15.00% |
| Integrated Oil |
$XOI |
1,309.20 |
+0.14 |
+0.01% |
+7.92% |
| Semiconductor |
$SOX |
460.90 |
-0.35 |
-0.08% |
+11.92% |
| Networking |
$NWX |
315.99 |
+2.46 |
+0.78% |
+12.63% |
| Internet |
$IIX |
328.40 |
+2.51 |
+0.77% |
+6.72% |
| Broker/Dealer |
$XBD |
126.90 |
+0.81 |
+0.64% |
+4.44% |
| Retail |
$RLX |
517.13 |
+7.60 |
+1.49% |
+1.72% |
| Gold & Silver |
$XAU |
209.80 |
+3.75 |
+1.82% |
-7.41% |
| Bank |
$BKX |
55.31 |
+0.41 |
+0.75% |
+5.94% |
| Biotech |
$BTK |
1,285.86 |
+2.22 |
+0.17% |
-0.91% |
|
|
|
 |
Minimal Volume Increase With Gain Just Above Pivot Point
Kenneth J. Gruneisen - Passed the CAN SLIM® Master's Exam
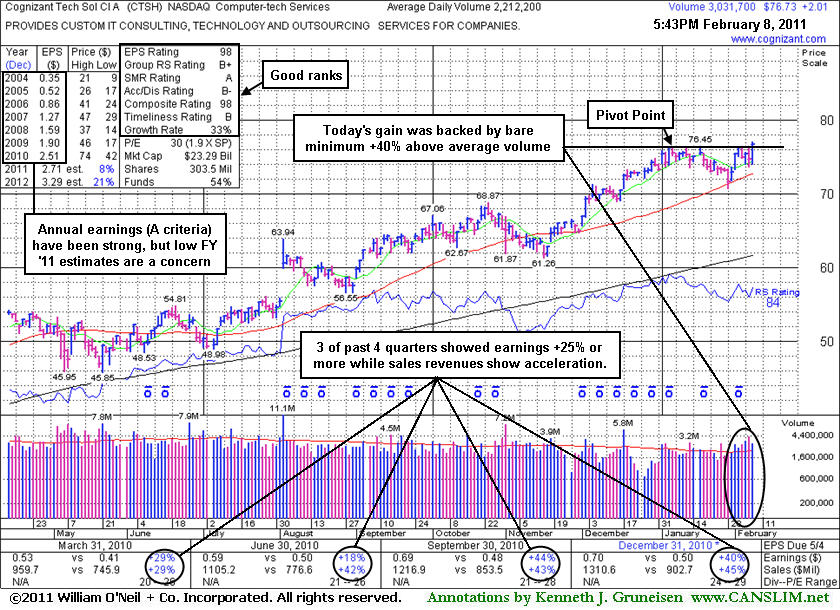
Adding on to winning positions with buy decisions confirmed by market action is advised, especially for those who are set upon employing the smartest tactical approach for accumulating stocks. This was a topic discussed long ago when Cognizant Technology Solutions Corp. (CTSH) made its last appearance in this FSU section on 3/23/07 under the headline "Watching For Another Time to Buy, or Another Sell Signal". It faltered and triggered sell signals in that case and went through a deep consolidation before rebounding impressively, yet the article may be worth revisiting for the purpose of firming up one's education on the fact-based investment system's approach to "force feeding" winners whenever add-on buy signals may occur. At all times, disciplined investors limit losses at 7-8% below their purchase price on all shares bought to properly manage risk. The above mentioned article was published well after its appearance in the Wednesday, September 13, 2006 Mid Day Breakouts Report (read here) when it cleared a pivot point with great volume conviction. The 2:1 stock split that occurred in Oct '07 may confuse those looking back into its history.
Cognizant Technology Solutions Corp. (CTSH +$2.01 or +2.69% to $76.73) posted a gain today with +40% above average volume while rallying from a short flat base above its 50-day moving average (DMA) line. That helped the high-ranked leader hailing from the strong Computer-tech Services group close the session above the pivot point cited when it was color coded yellow in the 2/07/11 mid-day report (read here) with the bare minimum volume required for a new buy signal. In recent months we have seen articles in the paper refer to a +40% above average volume threshold, after primarily standing by a +50% above average volume threshold as the minimum for a proper technical buy signal for as long as this analyst can remember. Additionally, it has been emphasized that the investment system's biggest winners identified in past models commonly showed an undeniable surge in buying demand with volume spiking many-fold over their typical daily volume totals while they posted meaningful gains. Gains with above average volume might offer a welcome reassurance or "confirmation day" of gains before it gets extended beyond its "max buy" level.
Remember to proceed with caution, meaning only buying a small position in the strongest names that are breaking out on heavy volume. Then, if and only if, the stock advances 2-3% take another small position. Repeat this process one more time to round out your entire position. For example, if one wanted to buy $10,000 of stock; $5,000 would be the first buy, then if the stock rallies +2% the next buy would be $3,000, and the final $2,000 worth would be accumulated if the stock advances yet another +2%. This strategy is known as "pyramiding" and is extremely useful when used properly, as it lets the market action help to dictate how heavily you invest. Once meaningful gains are there to provide a profit cushion for investors, if a subsequent base forms, one might consider "force feeding" winners when subsequent buy signals may occur. Never average your cost basis up by buying larger amounts at higher prices, and never average down.
|
|
|
Color Codes Explained :
Y - Better candidates highlighted by our
staff of experts.
G - Previously featured
in past reports as yellow but may no longer be buyable under the
guidelines.
***Last / Change / Volume data in this table is the closing quote data***
Symbol/Exchange
Company Name
Industry Group |
PRICE |
CHANGE
(%Change) |
Day High |
Volume
(% DAV)
(% 50 day avg vol) |
52 Wk Hi
% From Hi |
Featured
Date |
Price
Featured |
Pivot Featured |
|
Max Buy |
BIDU
-
NASDAQ
Baidu Inc Ads
INTERNET - Internet Information Providers
|
$119.84
|
+0.88
0.74% |
$120.16
|
4,289,017
55.45% of 50 DAV
50 DAV is 7,734,500
|
$120.50
-0.55%
|
2/1/2011
|
$117.74
|
PP = $112.08
|
|
MB = $117.68
|
 Most Recent Note - 2/8/2011 8:05:10 PM
G - Inched higher today on light volume, and its color code is changed to green after its close well above its "max buy" level. Held its ground stubbornly since gapping up on 2/01/11 rising from a "double bottom" base pattern.
>>> The latest Featured Stock Update with an annotated graph appeared on 2/2/2011. Click here.
View all notes |
Alert me of new notes |
CANSLIM.net Company Profile |
SEC |
Zacks Reports |
StockTalk |
News |
Chart |
Request a new note
C
A N
S L
I M


|
CRUS
-
NASDAQ
Cirrus Logic Inc
ELECTRONICS - Semiconductor - Specialized
|
$24.37
|
+0.28
1.16% |
$24.58
|
3,419,554
104.65% of 50 DAV
50 DAV is 3,267,700
|
$25.15
-3.10%
|
1/28/2011
|
$20.69
|
PP = $19.17
|
|
MB = $20.13
|
Most Recent Note - 2/7/2011 12:46:11 PM
G - Patience may allow for secondary buy points to develop. Holding its ground after 5 consecutive volume-driven gains, extended from its latest sound base pattern. Prior highs define chart support levels to watch on pullbacks.
>>> The latest Featured Stock Update with an annotated graph appeared on 1/28/2011. Click here.
View all notes |
Alert me of new notes |
CANSLIM.net Company Profile |
SEC |
Zacks Reports |
StockTalk |
News |
Chart |
Request a new note
C
A N
S L
I M
|
CTSH
-
NASDAQ
Cognizant Tech Sol Cl A
COMPUTER SOFTWARE and SERVICES - Business Software and Services
|
$76.73
|
+2.01
2.69% |
$77.08
|
3,038,188
137.34% of 50 DAV
50 DAV is 2,212,200
|
$76.49
0.31%
|
2/7/2011
|
$75.09
|
PP = $76.46
|
|
MB = $80.28
|
Most Recent Note - 2/8/2011 7:32:07 PM
Y - Rallied above its pivot point today from a short flat base with the bare minimum necessary volume to trigger a buy signal while clearing its riskier late-stage base. Recent quarters showed much better sales and earnings increases versus the year earlier and it maintained a strong annual earnings (A criteria) history. It reported earnings +40% on +45% sales for the quarter ended December 31, 2010 versus the year ago period in the interim since noted in the 10/15/10 mid-day report. It is already well-known by the institutional crowd, and decreasing top-rated institutional ownership (I criteria) is a concern after falling from 1,640 in Jun '10 to 1,617 in Dec '10. On 4/11/07 this stock was dropped from the CANSLIM.net Featured Stocks list and it subsequently fell from $40+ to $14 before rebounding impressively. See the latest FSU analysis for details and a new annotated graph.
>>> The latest Featured Stock Update with an annotated graph appeared on 2/8/2011. Click here.
View all notes |
Alert me of new notes |
CANSLIM.net Company Profile |
SEC |
Zacks Reports |
StockTalk |
News |
Chart |
Request a new note
C
A N
S L
I M
|
DECK
-
NASDAQ
Deckers Outdoor Corp
CONSUMER NON-DURABLES - Textile - Apparel Footwear
|
$83.90
|
+1.06
1.28% |
$84.10
|
1,584,937
83.84% of 50 DAV
50 DAV is 1,890,500
|
$87.88
-4.53%
|
2/3/2011
|
$79.61
|
PP = $82.67
|
|
MB = $86.80
|
Most Recent Note - 2/8/2011 8:06:35 PM
Y - Extended its streak to 6 consecutive gains with below average volume today, and it inched further above its pivot point. Color code was changed to yellow with new pivot point cited based on its 1/11/11 high while forming a double bottom base pattern.
>>> The latest Featured Stock Update with an annotated graph appeared on 1/26/2011. Click here.
View all notes |
Alert me of new notes |
CANSLIM.net Company Profile |
SEC |
Zacks Reports |
StockTalk |
News |
Chart |
Request a new note
C
A N
S L
I M
|
EZCH
-
NASDAQ
Ezchip Semiconductor Ltd
ELECTRONICS - Semiconductor - Specialized
|
$32.77
|
+0.37
1.14% |
$33.48
|
593,575
188.68% of 50 DAV
50 DAV is 314,600
|
$33.20
-1.30%
|
12/2/2010
|
$27.53
|
PP = $26.00
|
|
MB = $27.30
|
Most Recent Note - 2/8/2011 8:02:28 PM
G - Gapped up today and hit a new 52-week high with above average volume behind the latest 2 of it 6 consecutive gains. Due to report earnings results for the quarter ended December 31, 2010 before the open on Thursday, Feb 10th. Volume and volatility often increase near corporate earnings news. Recently found support above its 50 DMA line and prior chart highs in the $29 area.
>>> The latest Featured Stock Update with an annotated graph appeared on 1/21/2011. Click here.
View all notes |
Alert me of new notes |
CANSLIM.net Company Profile |
SEC |
Zacks Reports |
StockTalk |
News |
Chart |
Request a new note
C
A N
S L
I M
|
Symbol/Exchange
Company Name
Industry Group |
PRICE |
CHANGE
(%Change) |
Day High |
Volume
(% DAV)
(% 50 day avg vol) |
52 Wk Hi
% From Hi |
Featured
Date |
Price
Featured |
Pivot Featured |
|
Max Buy |
EZPW
-
NASDAQ
Ezcorp Inc Cl A
SPECIALTY RETAIL - Specialty Retail, Other
|
$28.08
|
+0.49
1.78% |
$28.08
|
185,830
44.29% of 50 DAV
50 DAV is 419,600
|
$29.94
-6.21%
|
11/5/2010
|
$24.02
|
PP = $23.85
|
|
MB = $25.04
|
Most Recent Note - 2/4/2011 4:20:39 PM
G - Volume totals have been cooling while consolidating near its 50 DMA line, showing resilience after damaging distribution. It is not near any sound base, and its recent low ($25.56 on 1/25/11) defines an important support level now. See the latest FSU analysis for more details and an annotated graph.
>>> The latest Featured Stock Update with an annotated graph appeared on 2/3/2011. Click here.
View all notes |
Alert me of new notes |
CANSLIM.net Company Profile |
SEC |
Zacks Reports |
StockTalk |
News |
Chart |
Request a new note
C
A N
S L
I M
|
FOSL
-
NASDAQ
Fossil Inc
CONSUMER DURABLES - Recreational Goods, Other
|
$78.21
|
+1.65
2.16% |
$78.25
|
464,674
67.25% of 50 DAV
50 DAV is 691,000
|
$76.94
1.65%
|
2/1/2011
|
$73.30
|
PP = $74.44
|
|
MB = $78.16
|
Most Recent Note - 2/8/2011 4:48:54 PM
G - Hit yet another new 52-week high today with a 4th consecutive gain on light volume. Color code is changed to green after inching up to a quiet close above its "max buy" level, getting extended from a riskier "late-stage" base without confirming a proper new (or add-on) technical buy signal. Recent chart low ($66.05 on 1/25/11) defines important support above its 50 DMA line.
>>> The latest Featured Stock Update with an annotated graph appeared on 1/12/2011. Click here.
View all notes |
Alert me of new notes |
CANSLIM.net Company Profile |
SEC |
Zacks Reports |
StockTalk |
News |
Chart |
Request a new note
C
A N
S L
I M
|
HMSY
-
NASDAQ
H M S Holdings Corp
COMPUTER SOFTWARE and SERVICES - Healthcare Information Service
|
$67.08
|
+0.43
0.65% |
$67.08
|
55,106
38.45% of 50 DAV
50 DAV is 143,300
|
$67.42
-0.50%
|
11/19/2010
|
$61.89
|
PP = $63.01
|
|
MB = $66.16
|
Most Recent Note - 2/4/2011 4:27:23 PM
G - This week's gains with light volume helped it find support at its 50 DMA line and finish only -2.1% off its 52-week high. It is building a base-on-base type pattern, but its waning Relative Strength rank (now 72) has been noted as a concern.
>>> The latest Featured Stock Update with an annotated graph appeared on 1/3/2011. Click here.
View all notes |
Alert me of new notes |
CANSLIM.net Company Profile |
SEC |
Zacks Reports |
StockTalk |
News |
Chart |
Request a new note
C
A N
S L
I M
|
JOBS
-
NASDAQ
Fifty One Job Inc Ads
DIVERSIFIED SERVICES - Staffing and; Outsourcing Service
|
$59.02
|
-0.21
-0.35% |
$60.00
|
95,582
69.92% of 50 DAV
50 DAV is 136,700
|
$61.28
-3.69%
|
2/7/2011
|
$59.23
|
PP = $61.38
|
|
MB = $64.45
|
Most Recent Note - 2/7/2011 6:19:06 PM
Y - Color code is changed to yellow with new pivot point cited after a long ascending base pattern. Posted 6th small gain today and volume picked up to near average while it finished at its second-best close ever. Its 50 DMA line defines important support, where a violation would raise concerns and trigger a technical sell signal. See the latest FSU analysis for more details and an annotated graph.
>>> The latest Featured Stock Update with an annotated graph appeared on 2/7/2011. Click here.
View all notes |
Alert me of new notes |
CANSLIM.net Company Profile |
SEC |
Zacks Reports |
StockTalk |
News |
Chart |
Request a new note
C
A N
S L
I M
|
LULU
-
NASDAQ
Lululemon Athletica
MANUFACTURING - Textile Manufacturing
|
$80.89
|
+2.50
3.19% |
$80.95
|
3,263,133
150.13% of 50 DAV
50 DAV is 2,173,500
|
$79.11
2.25%
|
1/26/2011
|
$68.11
|
PP = $74.70
|
|
MB = $78.44
|
Most Recent Note - 2/8/2011 7:52:41 PM
G - Gapped up again today and hit another new 52-week high, closing above its "max buy" level. Color code is changed to green after getting extended from its latest sound base. Prior highs near $74 that acted as resistance define chart support to watch now.
>>> The latest Featured Stock Update with an annotated graph appeared on 1/14/2011. Click here.
View all notes |
Alert me of new notes |
CANSLIM.net Company Profile |
SEC |
Zacks Reports |
StockTalk |
News |
Chart |
Request a new note
C
A N
S L
I M
|
Symbol/Exchange
Company Name
Industry Group |
PRICE |
CHANGE
(%Change) |
Day High |
Volume
(% DAV)
(% 50 day avg vol) |
52 Wk Hi
% From Hi |
Featured
Date |
Price
Featured |
Pivot Featured |
|
Max Buy |
MWIV
-
NASDAQ
M W I Veterinary Supply
HEALTH SERVICES - Medical Instruments and; Supplies
|
$68.51
|
+1.00
1.48% |
$68.52
|
68,436
113.87% of 50 DAV
50 DAV is 60,100
|
$68.02
0.72%
|
11/4/2010
|
$61.79
|
PP = $59.60
|
|
MB = $62.58
|
Most Recent Note - 2/8/2011 8:10:55 PM
G - Closed near the session high at a new all-time high with average volume behind today's 4th consecutive gain. Reported earnings +38% on +55% sales revenues for the quarter ended December 31, 2010, and found support near its 50 DMA line recently. Sales revenues acceleration (bigger percentage increases sequentially) is a very reassuring sign.
>>> The latest Featured Stock Update with an annotated graph appeared on 2/2/2011. Click here.
View all notes |
Alert me of new notes |
CANSLIM.net Company Profile |
SEC |
Zacks Reports |
StockTalk |
News |
Chart |
Request a new note
C
A N
S L
I M
|
NFLX
-
NASDAQ
Netflix Inc
SPECIALTY RETAIL - Music and Video Stores
|
$217.63
|
-0.40
-0.18% |
$218.39
|
2,483,276
42.18% of 50 DAV
50 DAV is 5,887,300
|
$222.81
-2.33%
|
1/10/2011
|
$187.88
|
PP = $209.34
|
|
MB = $219.81
|
Most Recent Note - 2/4/2011 4:44:01 PM
G - Gain today with average volume led to a close just above its "max buy" level, and its color code is changed to green. Prior highs define support to watch above its 50 DMA line.
>>> The latest Featured Stock Update with an annotated graph appeared on 1/10/2011. Click here.
View all notes |
Alert me of new notes |
CANSLIM.net Company Profile |
SEC |
Zacks Reports |
StockTalk |
News |
Chart |
Request a new note
C
A N
S L
I M
|
NTAP
-
NASDAQ
Netapp Inc
COMPUTER HARDWARE - Data Storage Devices
|
$59.31
|
+0.67
1.14% |
$59.56
|
2,845,966
64.09% of 50 DAV
50 DAV is 4,440,600
|
$59.79
-0.80%
|
1/6/2011
|
$57.49
|
PP = $58.06
|
|
MB = $60.96
|
Most Recent Note - 2/4/2011 4:46:31 PM
G - Gains this week with light volume have it trading up after finding support near its 50 DMA line. More damaging losses below its recent chart low ($53.14 on 1/25/11) could raise greater concerns and trigger a more serious technical sell signal.
>>> The latest Featured Stock Update with an annotated graph appeared on 2/4/2011. Click here.
View all notes |
Alert me of new notes |
CANSLIM.net Company Profile |
SEC |
Zacks Reports |
StockTalk |
News |
Chart |
Request a new note
C
A N
S L
I M
|
OPEN
-
NASDAQ
Opentable Inc
INTERNET - Internet Software and Services
|
$85.28
|
+0.48
0.57% |
$86.20
|
1,940,916
265.44% of 50 DAV
50 DAV is 731,200
|
$86.90
-1.86%
|
1/5/2011
|
$74.05
|
PP = $76.79
|
|
MB = $80.63
|
Most Recent Note - 2/8/2011 7:59:20 PM
G - Posted a third consecutive small gain today with above average volume, rising further above its "max buy" level for another new all-time high. Color code was changed to green after getting extended from its prior base. Reported earnings +114% on +61% sales revenues for the quarter ended December 31, 2010 versus the year-ago period. Recent lows and its 50 DMA line define near-term chart support.
>>> The latest Featured Stock Update with an annotated graph appeared on 1/5/2011. Click here.
View all notes |
Alert me of new notes |
CANSLIM.net Company Profile |
SEC |
Zacks Reports |
StockTalk |
News |
Chart |
Request a new note
C
A N
S L
I M
|
ORCL
-
NASDAQ
Oracle Corp
COMPUTER SOFTWARE and SERVICES - Application Software
|
$33.03
|
+0.05
0.15% |
$33.16
|
15,418,481
55.30% of 50 DAV
50 DAV is 27,881,500
|
$33.56
-1.58%
|
1/20/2011
|
$32.31
|
PP = $32.37
|
|
MB = $33.99
|
Most Recent Note - 2/7/2011 5:38:22 PM
Y - Gain today with quiet volume followed mild distributional pressure. Perched above its pivot point after hitting a new 52-week high last week. Near-term support to watch is its 50 DMA line.
>>> The latest Featured Stock Update with an annotated graph appeared on 1/7/2011. Click here.
View all notes |
Alert me of new notes |
CANSLIM.net Company Profile |
SEC |
Zacks Reports |
StockTalk |
News |
Chart |
Request a new note
C
A N
S L
I M
|
Symbol/Exchange
Company Name
Industry Group |
PRICE |
CHANGE
(%Change) |
Day High |
Volume
(% DAV)
(% 50 day avg vol) |
52 Wk Hi
% From Hi |
Featured
Date |
Price
Featured |
Pivot Featured |
|
Max Buy |
PAY
-
NYSE
Verifone Systems Inc
COMPUTER HARDWARE - Transaction Automation Systems
|
$43.45
|
-0.76
-1.72% |
$44.33
|
1,502,409
99.95% of 50 DAV
50 DAV is 1,503,100
|
$44.87
-3.16%
|
1/27/2011
|
$41.77
|
PP = $44.97
|
|
MB = $47.22
|
Most Recent Note - 2/8/2011 5:03:30 PM
Y - Today's loss on average volume was a sign of mild distributional pressure following 5 consecutive gains with lighter than average volume. Recently found support at its 50 DMA line and rallied toward its pivot point ($44.97 = its 1/13/11 high plus 10 cents). Gains above its pivot point with at least +50% above average volume may trigger a new (or add-on) technical buy signal.
>>> The latest Featured Stock Update with an annotated graph appeared on 1/27/2011. Click here.
View all notes |
Alert me of new notes |
CANSLIM.net Company Profile |
SEC |
Zacks Reports |
StockTalk |
News |
Chart |
Request a new note
C
A N
S L
I M
|
PCLN
-
NASDAQ
Priceline.Com Inc
INTERNET - Internet Software and Services
|
$442.75
|
+5.55
1.27% |
$443.40
|
801,713
85.81% of 50 DAV
50 DAV is 934,300
|
$444.95
-0.49%
|
11/1/2002
|
$399.55
|
PP = $428.20
|
|
MB = $449.61
|
Most Recent Note - 2/8/2011 8:08:38 PM
Y - Inched higher on light volume today for a new high close. Trading in a tight range near its 52-week high since its 1/05/11 technical breakout, consolidating above its 50 DMA line and above its pivot point yet below its "max buy" level.
>>> The latest Featured Stock Update with an annotated graph appeared on 1/2/2011. Click here.
View all notes |
Alert me of new notes |
CANSLIM.net Company Profile |
SEC |
Zacks Reports |
StockTalk |
News |
Chart |
Request a new note
C
A N
S L
I M
|
RAX
-
NYSE
Rackspace Hosting Inc
INTERNET - Internet Software and; Services
|
$36.65
|
-0.14
-0.38% |
$37.42
|
1,412,108
81.93% of 50 DAV
50 DAV is 1,723,500
|
$37.10
-1.21%
|
1/10/2011
|
$22.84
|
PP = $32.76
|
|
MB = $34.40
|
Most Recent Note - 2/7/2011 5:32:40 PM
G - Small gap up on average volume today for a new high close, more extended from any sound base. Found prompt support near its 50 DMA line recently
>>> The latest Featured Stock Update with an annotated graph appeared on 12/31/2010. Click here.
View all notes |
Alert me of new notes |
CANSLIM.net Company Profile |
SEC |
Zacks Reports |
StockTalk |
News |
Chart |
Request a new note
C
A N
S L
I M
|
ROVI
-
NASDAQ
Rovi Corp
COMPUTER SOFTWARE andamp; SERVICES - Security Software andamp; Services
|
$64.49
|
-0.28
-0.43% |
$65.14
|
726,279
43.33% of 50 DAV
50 DAV is 1,676,200
|
$69.50
-7.21%
|
10/29/2010
|
$49.99
|
PP = $53.10
|
|
MB = $55.76
|
Most Recent Note - 2/4/2011 4:57:24 PM
G - Consolidating above its 50 DMA line after finding support near that important short-term average. The 1/10/11 low ($58.51) defines another near-term chart support level to watch.
>>> The latest Featured Stock Update with an annotated graph appeared on 1/25/2011. Click here.
View all notes |
Alert me of new notes |
CANSLIM.net Company Profile |
SEC |
Zacks Reports |
StockTalk |
News |
Chart |
Request a new note
C
A N
S L
I M
|
TIBX
-
NASDAQ
Tibco Software Inc
COMPUTER SOFTWARE and SERVICES - Business Software and Services
|
$24.82
|
+0.25
1.00% |
$24.83
|
1,846,108
66.98% of 50 DAV
50 DAV is 2,756,100
|
$24.77
0.18%
|
2/1/2011
|
$24.35
|
PP = $22.18
|
|
MB = $23.29
|
Most Recent Note - 2/4/2011 5:02:14 PM
G - Small gain today for a new 52-week high with light volume. Rose from an orderly flat base this week and quickly got extended from its "late-stage" or riskier base. Color code is changed to green, meanwhile disciplined investors may watch for light volume pullbacks toward prior resistance. Previously noted its streak of 4 quarterly comparisons with +25% earnings (good C criteria) increases with good sales revenues growth. It also has a good annual earnings (A criteria) history, and leadership (L criteria) in the Computer Software - Database group is reassuring.
>>> The latest Featured Stock Update with an annotated graph appeared on 2/2/2011. Click here.
View all notes |
Alert me of new notes |
CANSLIM.net Company Profile |
SEC |
Zacks Reports |
StockTalk |
News |
Chart |
Request a new note
C
A N
S L
I M
|
Symbol/Exchange
Company Name
Industry Group |
PRICE |
CHANGE
(%Change) |
Day High |
Volume
(% DAV)
(% 50 day avg vol) |
52 Wk Hi
% From Hi |
Featured
Date |
Price
Featured |
Pivot Featured |
|
Max Buy |
UA
-
NYSE
Under Armour Inc Cl A
CONSUMER NON-DURABLES - Textile - Apparel Clothing
|
$66.99
|
+1.48
2.26% |
$67.19
|
1,047,948
138.03% of 50 DAV
50 DAV is 759,200
|
$65.55
2.20%
|
1/27/2011
|
$58.31
|
PP = $56.99
|
|
MB = $59.84
|
Most Recent Note - 2/8/2011 4:53:01 PM
G - Extended its streak of gains with above average volume and hit another new 52-week high today. Prior resistance in the $60 area defines initial support to watch above its 50 DMA line.
>>> The latest Featured Stock Update with an annotated graph appeared on 2/1/2011. Click here.
View all notes |
Alert me of new notes |
CANSLIM.net Company Profile |
SEC |
Zacks Reports |
StockTalk |
News |
Chart |
Request a new note
C
A N
S L
I M
|
ULTA
-
NASDAQ
Ulta Salon Cosm & Frag
SPECIALTY RETAIL - Specialty Retail, Other
|
$41.20
|
+0.81
2.01% |
$41.24
|
291,787
46.16% of 50 DAV
50 DAV is 632,100
|
$40.63
1.40%
|
1/6/2011
|
$36.12
|
PP = $37.34
|
|
MB = $39.21
|
Most Recent Note - 2/8/2011 4:55:46 PM
G - Up on even lighter volume today, closing near the session high and further above its "max buy" level for another new 52-week high. Its color code was changed to green after getting extended from a sound base pattern. Confirming gain on 2/03/11 with +79% above average volume. Its 50 DMA line defines important chart support to watch.
>>> The latest Featured Stock Update with an annotated graph appeared on 1/6/2011. Click here.
View all notes |
Alert me of new notes |
CANSLIM.net Company Profile |
SEC |
Zacks Reports |
StockTalk |
News |
Chart |
Request a new note
C
A N
S L
I M
|
|
|
|
THESE ARE NOT BUY RECOMMENDATIONS!
Comments contained in the body of this report are technical
opinions only. The material herein has been obtained
from sources believed to be reliable and accurate, however,
its accuracy and completeness cannot be guaranteed.
This site is not an investment advisor, hence it does
not endorse or recommend any securities or other investments.
Any recommendation contained in this report may not
be suitable for all investors and it is not to be deemed
an offer or solicitation on our part with respect to
the purchase or sale of any securities. All trademarks,
service marks and trade names appearing in this report
are the property of their respective owners, and are
likewise used for identification purposes only.
This report is a service available
only to active Paid Premium Members.
You may opt-out of receiving report notifications
at any time. Questions or comments may be submitted
by writing to Premium Membership Services 665 S.E. 10 Street, Suite 201 Deerfield Beach, FL 33441-5634 or by calling 1-800-965-8307
or 954-785-1121.
|
|
|

