Symbol/Exchange
Company Name
Industry Group |
PRICE |
CHANGE
(%Change) |
Day High |
Volume
(% DAV)
(% 50 day avg vol) |
52 Wk Hi
% From Hi |
Featured
Date |
Price
Featured |
Pivot Featured |
|
Max Buy |
BIDU
-
NASDAQ
Baidu Inc Ads
INTERNET - Internet Information Providers
|
$123.01
|
+3.17
2.65% |
$124.55
|
8,517,695
110.19% of 50 DAV
50 DAV is 7,730,200
|
$120.50
2.08%
|
2/1/2011
|
$117.74
|
PP = $112.08
|
|
MB = $117.68
|
 Most Recent Note - 2/9/2011 9:13:40 PM
G - Gapped up today for a new all-time high with its gain on slightly above average volume. Prior highs in the $112-115 area define initial chart support to watch now.
>>> The latest Featured Stock Update with an annotated graph appeared on 2/2/2011. Click here.
View all notes |
Alert me of new notes |
CANSLIM.net Company Profile |
SEC |
Zacks Reports |
StockTalk |
News |
Chart |
Request a new note
C
A N
S L
I M


|
CRUS
-
NASDAQ
Cirrus Logic Inc
ELECTRONICS - Semiconductor - Specialized
|
$24.08
|
-0.29
-1.19% |
$24.39
|
2,595,693
78.47% of 50 DAV
50 DAV is 3,307,900
|
$25.15
-4.25%
|
1/28/2011
|
$20.69
|
PP = $19.17
|
|
MB = $20.13
|
Most Recent Note - 2/7/2011 12:46:11 PM
G - Patience may allow for secondary buy points to develop. Holding its ground after 5 consecutive volume-driven gains, extended from its latest sound base pattern. Prior highs define chart support levels to watch on pullbacks.
>>> The latest Featured Stock Update with an annotated graph appeared on 1/28/2011. Click here.
View all notes |
Alert me of new notes |
CANSLIM.net Company Profile |
SEC |
Zacks Reports |
StockTalk |
News |
Chart |
Request a new note
C
A N
S L
I M
|
CTSH
-
NASDAQ
Cognizant Tech Sol Cl A
COMPUTER SOFTWARE and SERVICES - Business Software and Services
|
$74.22
|
-2.51
-3.27% |
$76.42
|
2,734,649
121.20% of 50 DAV
50 DAV is 2,256,400
|
$77.08
-3.71%
|
2/7/2011
|
$75.09
|
PP = $76.46
|
|
MB = $80.28
|
Most Recent Note - 2/9/2011 2:13:28 PM
Y - Small gap down today, erasing all of the prior session's gain, raising concerns. Rallied above its pivot point on 2/08/11 from a short flat base with the bare minimum necessary volume to trigger a buy signal while clearing its riskier late-stage base. Recent quarters showed much better sales and earnings increases versus the year earlier and it maintained a strong annual earnings (A criteria) history. It reported earnings +40% on +45% sales for the quarter ended December 31, 2010 versus the year ago period in the interim since noted in the 10/15/10 mid-day report. It is already well-known by the institutional crowd, and decreasing top-rated institutional ownership (I criteria) is a concern after falling from 1,640 in Jun '10 to 1,617 in Dec '10. On 4/11/07 this stock was dropped from the CANSLIM.net Featured Stocks list and it subsequently fell from $40+ to $14 before rebounding impressively. See the latest FSU analysis for details and a new annotated graph.
>>> The latest Featured Stock Update with an annotated graph appeared on 2/8/2011. Click here.
View all notes |
Alert me of new notes |
CANSLIM.net Company Profile |
SEC |
Zacks Reports |
StockTalk |
News |
Chart |
Request a new note
C
A N
S L
I M
|
DECK
-
NASDAQ
Deckers Outdoor Corp
CONSUMER NON-DURABLES - Textile - Apparel Footwear
|
$83.93
|
+0.03
0.04% |
$84.69
|
1,184,484
62.08% of 50 DAV
50 DAV is 1,908,000
|
$87.88
-4.49%
|
2/3/2011
|
$79.61
|
PP = $82.67
|
|
MB = $86.80
|
Most Recent Note - 2/8/2011 8:06:35 PM
Y - Extended its streak to 6 consecutive gains with below average volume today, and it inched further above its pivot point. Color code was changed to yellow with new pivot point cited based on its 1/11/11 high while forming a double bottom base pattern.
>>> The latest Featured Stock Update with an annotated graph appeared on 1/26/2011. Click here.
View all notes |
Alert me of new notes |
CANSLIM.net Company Profile |
SEC |
Zacks Reports |
StockTalk |
News |
Chart |
Request a new note
C
A N
S L
I M
|
EZCH
-
NASDAQ
Ezchip Semiconductor Ltd
ELECTRONICS - Semiconductor - Specialized
|
$32.08
|
-0.69
-2.11% |
$32.70
|
353,096
108.95% of 50 DAV
50 DAV is 324,100
|
$33.48
-4.18%
|
12/2/2010
|
$27.53
|
PP = $26.00
|
|
MB = $27.30
|
Most Recent Note - 2/8/2011 8:02:28 PM
G - Gapped up today and hit a new 52-week high with above average volume behind the latest 2 of it 6 consecutive gains. Due to report earnings results for the quarter ended December 31, 2010 before the open on Thursday, Feb 10th. Volume and volatility often increase near corporate earnings news. Recently found support above its 50 DMA line and prior chart highs in the $29 area.
>>> The latest Featured Stock Update with an annotated graph appeared on 1/21/2011. Click here.
View all notes |
Alert me of new notes |
CANSLIM.net Company Profile |
SEC |
Zacks Reports |
StockTalk |
News |
Chart |
Request a new note
C
A N
S L
I M
|
Symbol/Exchange
Company Name
Industry Group |
PRICE |
CHANGE
(%Change) |
Day High |
Volume
(% DAV)
(% 50 day avg vol) |
52 Wk Hi
% From Hi |
Featured
Date |
Price
Featured |
Pivot Featured |
|
Max Buy |
EZPW
-
NASDAQ
Ezcorp Inc Cl A
SPECIALTY RETAIL - Specialty Retail, Other
|
$27.47
|
-0.61
-2.17% |
$27.88
|
205,383
49.17% of 50 DAV
50 DAV is 417,700
|
$29.94
-8.25%
|
11/5/2010
|
$24.02
|
PP = $23.85
|
|
MB = $25.04
|
Most Recent Note - 2/9/2011 9:20:25 PM
G - Small gap down today led to a close just below its 50 DMA line again after showing resilience recently. It is not near any sound base, and its recent low ($25.56 on 1/25/11) defines an important support level now. Volume totals have been cooling while consolidating in recent weeks near its short-term average.
>>> The latest Featured Stock Update with an annotated graph appeared on 2/3/2011. Click here.
View all notes |
Alert me of new notes |
CANSLIM.net Company Profile |
SEC |
Zacks Reports |
StockTalk |
News |
Chart |
Request a new note
C
A N
S L
I M
|
FOSL
-
NASDAQ
Fossil Inc
CONSUMER DURABLES - Recreational Goods, Other
|
$79.66
|
+1.45
1.85% |
$80.15
|
1,275,399
183.93% of 50 DAV
50 DAV is 693,400
|
$78.25
1.80%
|
2/1/2011
|
$73.30
|
PP = $74.44
|
|
MB = $78.16
|
Most Recent Note - 2/9/2011 9:22:01 PM
G - Hit yet another new 52-week high today with above average volume behind today's 5th consecutive gain. Color code was changed to green after inching up to a quiet close above its "max buy" level, getting extended from a riskier "late-stage" base without confirming a proper new (or add-on) technical buy signal. Recent chart low ($66.05 on 1/25/11) defines important support above its 50 DMA line.
>>> The latest Featured Stock Update with an annotated graph appeared on 1/12/2011. Click here.
View all notes |
Alert me of new notes |
CANSLIM.net Company Profile |
SEC |
Zacks Reports |
StockTalk |
News |
Chart |
Request a new note
C
A N
S L
I M
|
HMSY
-
NASDAQ
H M S Holdings Corp
COMPUTER SOFTWARE and SERVICES - Healthcare Information Service
|
$67.41
|
+0.33
0.49% |
$67.64
|
84,897
59.04% of 50 DAV
50 DAV is 143,800
|
$67.42
-0.01%
|
11/19/2010
|
$61.89
|
PP = $63.01
|
|
MB = $66.16
|
Most Recent Note - 2/4/2011 4:27:23 PM
G - This week's gains with light volume helped it find support at its 50 DMA line and finish only -2.1% off its 52-week high. It is building a base-on-base type pattern, but its waning Relative Strength rank (now 72) has been noted as a concern.
>>> The latest Featured Stock Update with an annotated graph appeared on 1/3/2011. Click here.
View all notes |
Alert me of new notes |
CANSLIM.net Company Profile |
SEC |
Zacks Reports |
StockTalk |
News |
Chart |
Request a new note
C
A N
S L
I M
|
JOBS
-
NASDAQ
Fifty One Job Inc Ads
DIVERSIFIED SERVICES - Staffing and; Outsourcing Service
|
$56.29
|
-2.73
-4.63% |
$59.58
|
95,838
69.70% of 50 DAV
50 DAV is 137,500
|
$61.28
-8.14%
|
2/7/2011
|
$59.23
|
PP = $61.38
|
|
MB = $64.45
|
Most Recent Note - 2/9/2011 9:18:03 PM
Y - Down today on light volume. Its 50 DMA line defines important support, where a violation would raise concerns and trigger a technical sell signal. Color code was changed to yellow with new pivot point cited after a long ascending base pattern. See the latest FSU analysis for more details and an annotated graph.
>>> The latest Featured Stock Update with an annotated graph appeared on 2/7/2011. Click here.
View all notes |
Alert me of new notes |
CANSLIM.net Company Profile |
SEC |
Zacks Reports |
StockTalk |
News |
Chart |
Request a new note
C
A N
S L
I M
|
LULU
-
NASDAQ
Lululemon Athletica
MANUFACTURING - Textile Manufacturing
|
$81.50
|
+0.61
0.75% |
$82.86
|
2,778,170
124.69% of 50 DAV
50 DAV is 2,228,000
|
$80.95
0.68%
|
1/26/2011
|
$68.11
|
PP = $74.70
|
|
MB = $78.44
|
Most Recent Note - 2/8/2011 7:52:41 PM
G - Gapped up again today and hit another new 52-week high, closing above its "max buy" level. Color code is changed to green after getting extended from its latest sound base. Prior highs near $74 that acted as resistance define chart support to watch now.
>>> The latest Featured Stock Update with an annotated graph appeared on 1/14/2011. Click here.
View all notes |
Alert me of new notes |
CANSLIM.net Company Profile |
SEC |
Zacks Reports |
StockTalk |
News |
Chart |
Request a new note
C
A N
S L
I M
|
Symbol/Exchange
Company Name
Industry Group |
PRICE |
CHANGE
(%Change) |
Day High |
Volume
(% DAV)
(% 50 day avg vol) |
52 Wk Hi
% From Hi |
Featured
Date |
Price
Featured |
Pivot Featured |
|
Max Buy |
MWIV
-
NASDAQ
M W I Veterinary Supply
HEALTH SERVICES - Medical Instruments and; Supplies
|
$68.16
|
-0.35
-0.51% |
$69.04
|
62,672
102.24% of 50 DAV
50 DAV is 61,300
|
$68.52
-0.53%
|
11/4/2010
|
$61.79
|
PP = $59.60
|
|
MB = $62.58
|
Most Recent Note - 2/8/2011 8:10:55 PM
G - Closed near the session high at a new all-time high with average volume behind today's 4th consecutive gain. Reported earnings +38% on +55% sales revenues for the quarter ended December 31, 2010, and found support near its 50 DMA line recently. Sales revenues acceleration (bigger percentage increases sequentially) is a very reassuring sign.
>>> The latest Featured Stock Update with an annotated graph appeared on 2/2/2011. Click here.
View all notes |
Alert me of new notes |
CANSLIM.net Company Profile |
SEC |
Zacks Reports |
StockTalk |
News |
Chart |
Request a new note
C
A N
S L
I M
|
NFLX
-
NASDAQ
Netflix Inc
SPECIALTY RETAIL - Music and Video Stores
|
$222.29
|
+4.67
2.14% |
$223.98
|
4,141,978
70.49% of 50 DAV
50 DAV is 5,876,200
|
$222.81
-0.23%
|
1/10/2011
|
$187.88
|
PP = $209.34
|
|
MB = $219.81
|
Most Recent Note - 2/9/2011 9:16:01 PM
G - Gain today with below average volume for a new all-time high. Rallying further above its "max buy" level after its color code was changed to green. Prior highs define support to watch above its 50 DMA line.
>>> The latest Featured Stock Update with an annotated graph appeared on 1/10/2011. Click here.
View all notes |
Alert me of new notes |
CANSLIM.net Company Profile |
SEC |
Zacks Reports |
StockTalk |
News |
Chart |
Request a new note
C
A N
S L
I M
|
NTAP
-
NASDAQ
Netapp Inc
COMPUTER HARDWARE - Data Storage Devices
|
$59.77
|
+0.46
0.78% |
$59.99
|
4,024,302
90.18% of 50 DAV
50 DAV is 4,462,400
|
$59.79
-0.03%
|
1/6/2011
|
$57.49
|
PP = $58.06
|
|
MB = $60.96
|
Most Recent Note - 2/4/2011 4:46:31 PM
G - Gains this week with light volume have it trading up after finding support near its 50 DMA line. More damaging losses below its recent chart low ($53.14 on 1/25/11) could raise greater concerns and trigger a more serious technical sell signal.
>>> The latest Featured Stock Update with an annotated graph appeared on 2/4/2011. Click here.
View all notes |
Alert me of new notes |
CANSLIM.net Company Profile |
SEC |
Zacks Reports |
StockTalk |
News |
Chart |
Request a new note
C
A N
S L
I M
|
OPEN
-
NASDAQ
Opentable Inc
INTERNET - Internet Software and Services
|
$85.85
|
+0.57
0.67% |
$87.75
|
4,620,141
610.65% of 50 DAV
50 DAV is 756,600
|
$86.90
-1.21%
|
1/5/2011
|
$74.05
|
PP = $76.79
|
|
MB = $80.63
|
Most Recent Note - 2/9/2011 1:27:34 PM
G - Churning heavy volume at an all-time high today, enduring distributional pressure while not making meaningful price progress above prior highs this week. Reported earnings +114% on +61% sales revenues for the quarter ended December 31, 2010 versus the year-ago period. Recent lows and its 50 DMA line define near-term chart support.
>>> The latest Featured Stock Update with an annotated graph appeared on 1/5/2011. Click here.
View all notes |
Alert me of new notes |
CANSLIM.net Company Profile |
SEC |
Zacks Reports |
StockTalk |
News |
Chart |
Request a new note
C
A N
S L
I M
|
ORCL
-
NASDAQ
Oracle Corp
COMPUTER SOFTWARE and SERVICES - Application Software
|
$32.89
|
-0.14
-0.43% |
$33.10
|
17,112,792
61.27% of 50 DAV
50 DAV is 27,932,100
|
$33.56
-2.00%
|
1/20/2011
|
$32.31
|
PP = $32.37
|
|
MB = $33.99
|
Most Recent Note - 2/7/2011 5:38:22 PM
Y - Gain today with quiet volume followed mild distributional pressure. Perched above its pivot point after hitting a new 52-week high last week. Near-term support to watch is its 50 DMA line.
>>> The latest Featured Stock Update with an annotated graph appeared on 1/7/2011. Click here.
View all notes |
Alert me of new notes |
CANSLIM.net Company Profile |
SEC |
Zacks Reports |
StockTalk |
News |
Chart |
Request a new note
C
A N
S L
I M
|
Symbol/Exchange
Company Name
Industry Group |
PRICE |
CHANGE
(%Change) |
Day High |
Volume
(% DAV)
(% 50 day avg vol) |
52 Wk Hi
% From Hi |
Featured
Date |
Price
Featured |
Pivot Featured |
|
Max Buy |
PAY
-
NYSE
Verifone Systems Inc
COMPUTER HARDWARE - Transaction Automation Systems
|
$43.43
|
-0.02
-0.05% |
$43.85
|
589,549
38.71% of 50 DAV
50 DAV is 1,523,100
|
$44.87
-3.21%
|
1/27/2011
|
$41.77
|
PP = $44.97
|
|
MB = $47.22
|
Most Recent Note - 2/8/2011 5:03:30 PM
Y - Today's loss on average volume was a sign of mild distributional pressure following 5 consecutive gains with lighter than average volume. Recently found support at its 50 DMA line and rallied toward its pivot point ($44.97 = its 1/13/11 high plus 10 cents). Gains above its pivot point with at least +50% above average volume may trigger a new (or add-on) technical buy signal.
>>> The latest Featured Stock Update with an annotated graph appeared on 1/27/2011. Click here.
View all notes |
Alert me of new notes |
CANSLIM.net Company Profile |
SEC |
Zacks Reports |
StockTalk |
News |
Chart |
Request a new note
C
A N
S L
I M
|
PCLN
-
NASDAQ
Priceline.Com Inc
INTERNET - Internet Software and Services
|
$451.11
|
+8.36
1.89% |
$459.10
|
1,364,499
144.79% of 50 DAV
50 DAV is 942,400
|
$444.95
1.38%
|
11/1/2002
|
$399.55
|
PP = $428.20
|
|
MB = $449.61
|
Most Recent Note - 2/9/2011 1:32:18 PM
G - Color code is changed to green after rising above its "max buy" level with today's gain on higher volume. Traded in a tight range near its 52-week high since its 1/05/11 technical breakout.
>>> The latest Featured Stock Update with an annotated graph appeared on 1/2/2011. Click here.
View all notes |
Alert me of new notes |
CANSLIM.net Company Profile |
SEC |
Zacks Reports |
StockTalk |
News |
Chart |
Request a new note
C
A N
S L
I M
|
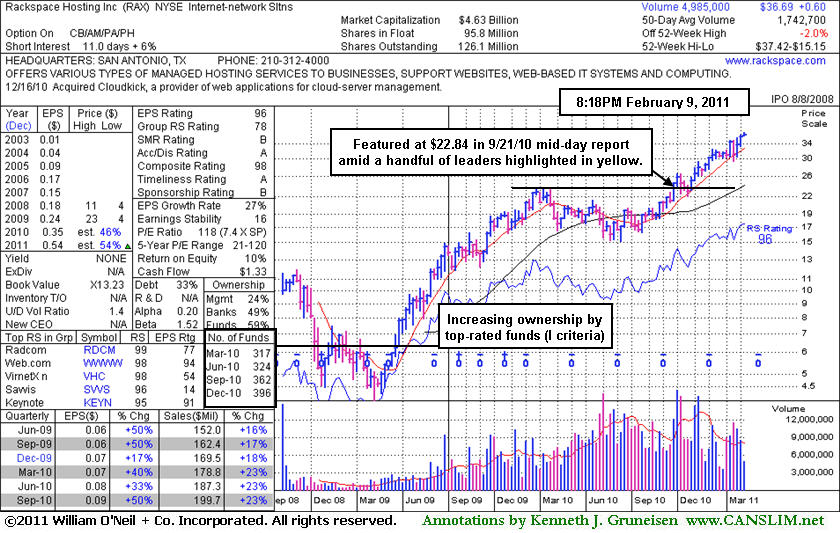
RAX
-
NYSE
Rackspace Hosting Inc
INTERNET - Internet Software and; Services
|
$36.69
|
+0.04
0.11% |
$37.11
|
1,820,237
104.45% of 50 DAV
50 DAV is 1,742,700
|
$37.42
-1.95%
|
1/10/2011
|
$22.84
|
PP = $32.76
|
|
MB = $34.40
|
Most Recent Note - 2/9/2011 9:43:36 PM
G - Small gain on average volume today, extended from any sound base. Found prompt support near its 50 DMA line recently. See the latest FSU analysis for details and a new annotated weekly graph.
>>> The latest Featured Stock Update with an annotated graph appeared on 2/9/2011. Click here.
View all notes |
Alert me of new notes |
CANSLIM.net Company Profile |
SEC |
Zacks Reports |
StockTalk |
News |
Chart |
Request a new note
C
A N
S L
I M
|
ROVI
-
NASDAQ
Rovi Corp
COMPUTER SOFTWARE andamp; SERVICES - Security Software andamp; Services
|
$63.37
|
-1.12
-1.74% |
$64.43
|
819,368
48.59% of 50 DAV
50 DAV is 1,686,400
|
$69.50
-8.82%
|
10/29/2010
|
$49.99
|
PP = $53.10
|
|
MB = $55.76
|
Most Recent Note - 2/9/2011 9:46:00 PM
G - Consolidating above its 50 DMA line with volume totals cooling after recently finding support near that important short-term average. The 1/31/11 low ($60.15) now defines another near-term chart support level to watch.
>>> The latest Featured Stock Update with an annotated graph appeared on 1/25/2011. Click here.
View all notes |
Alert me of new notes |
CANSLIM.net Company Profile |
SEC |
Zacks Reports |
StockTalk |
News |
Chart |
Request a new note
C
A N
S L
I M
|
TIBX
-
NASDAQ
Tibco Software Inc
COMPUTER SOFTWARE and SERVICES - Business Software and Services
|
$24.52
|
-0.30
-1.19% |
$24.78
|
1,862,610
66.87% of 50 DAV
50 DAV is 2,785,300
|
$24.83
-1.25%
|
2/1/2011
|
$24.35
|
PP = $22.18
|
|
MB = $23.29
|
Most Recent Note - 2/4/2011 5:02:14 PM
G - Small gain today for a new 52-week high with light volume. Rose from an orderly flat base this week and quickly got extended from its "late-stage" or riskier base. Color code is changed to green, meanwhile disciplined investors may watch for light volume pullbacks toward prior resistance. Previously noted its streak of 4 quarterly comparisons with +25% earnings (good C criteria) increases with good sales revenues growth. It also has a good annual earnings (A criteria) history, and leadership (L criteria) in the Computer Software - Database group is reassuring.
>>> The latest Featured Stock Update with an annotated graph appeared on 2/2/2011. Click here.
View all notes |
Alert me of new notes |
CANSLIM.net Company Profile |
SEC |
Zacks Reports |
StockTalk |
News |
Chart |
Request a new note
C
A N
S L
I M
|
Symbol/Exchange
Company Name
Industry Group |
PRICE |
CHANGE
(%Change) |
Day High |
Volume
(% DAV)
(% 50 day avg vol) |
52 Wk Hi
% From Hi |
Featured
Date |
Price
Featured |
Pivot Featured |
|
Max Buy |
UA
-
NYSE
Under Armour Inc Cl A
CONSUMER NON-DURABLES - Textile - Apparel Clothing
|
$66.47
|
-0.52
-0.78% |
$68.65
|
958,625
123.66% of 50 DAV
50 DAV is 775,200
|
$67.19
-1.07%
|
1/27/2011
|
$58.31
|
PP = $56.99
|
|
MB = $59.84
|
Most Recent Note - 2/8/2011 4:53:01 PM
G - Extended its streak of gains with above average volume and hit another new 52-week high today. Prior resistance in the $60 area defines initial support to watch above its 50 DMA line.
>>> The latest Featured Stock Update with an annotated graph appeared on 2/1/2011. Click here.
View all notes |
Alert me of new notes |
CANSLIM.net Company Profile |
SEC |
Zacks Reports |
StockTalk |
News |
Chart |
Request a new note
C
A N
S L
I M
|
ULTA
-
NASDAQ
Ulta Salon Cosm & Frag
SPECIALTY RETAIL - Specialty Retail, Other
|
$41.21
|
+0.01
0.02% |
$41.82
|
497,275
78.35% of 50 DAV
50 DAV is 634,700
|
$41.24
-0.07%
|
1/6/2011
|
$36.12
|
PP = $37.34
|
|
MB = $39.21
|
Most Recent Note - 2/8/2011 4:55:46 PM
G - Up on even lighter volume today, closing near the session high and further above its "max buy" level for another new 52-week high. Its color code was changed to green after getting extended from a sound base pattern. Confirming gain on 2/03/11 with +79% above average volume. Its 50 DMA line defines important chart support to watch.
>>> The latest Featured Stock Update with an annotated graph appeared on 1/6/2011. Click here.
View all notes |
Alert me of new notes |
CANSLIM.net Company Profile |
SEC |
Zacks Reports |
StockTalk |
News |
Chart |
Request a new note
C
A N
S L
I M
|