You are not logged in.
This means you
CAN ONLY VIEW reports that were published prior to Sunday, February 25, 2024.
You
MUST UPGRADE YOUR MEMBERSHIP if you want to see any current reports.
AFTER MARKET UPDATE - MONDAY, FEBRUARY 7TH, 2022
Previous After Market Report Next After Market Report >>>
|
|
|
|
DOW |
+1.39 |
35,091.13 |
+0.00% |
|
Volume |
881,625,441 |
-7% |
|
Volume |
4,219,893,400 |
+4% |
|
NASDAQ |
-82.34 |
14,015.67 |
-0.58% |
|
Advancers |
1,720 |
53% |
|
Advancers |
2,617 |
58% |
|
S&P 500 |
-16.66 |
4,483.87 |
-0.37% |
|
Decliners |
1,553 |
47% |
|
Decliners |
1,866 |
42% |
|
Russell 2000 |
+10.24 |
2,012.60 |
+0.51% |
|
52 Wk Highs |
53 |
|
|
52 Wk Highs |
50 |
|
|
S&P 600 |
+1.20 |
1,284.82 |
+0.09% |
|
52 Wk Lows |
199 |
|
|
52 Wk Lows |
238 |
|
|
Since the Monday, January 31st follow-through day in the market (M criteria) confirmed a new uptrend, new buying efforts may be made in stocks fitting all key criteria of the fact-based investment system.
|
 |
Indecisive Major Indices Ended Mixed Again
Kenneth J. Gruneisen - Passed the CAN SLIM® Master's Exam
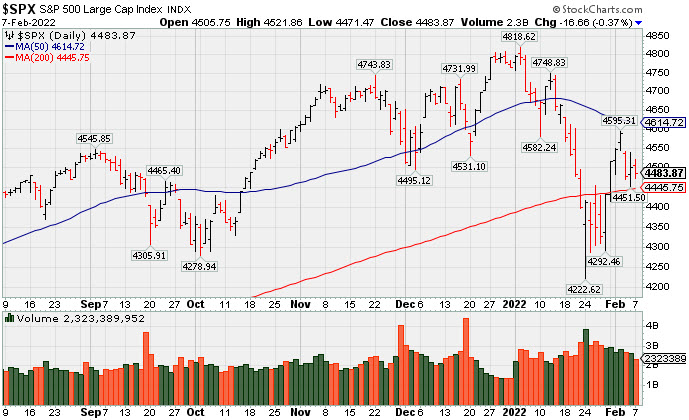
The S&P fell 0.4%, while the Nasdaq Composite dropped 0.6% on the heels of their best week of 2022 (+1.6% and +2.4%, respectively). The Dow ended just above the flat line following last week’s 1.1% advance. Volume totals reported were mixed, lighter than the prior session on the NYSE and higher on the Nasdaq exchange. Advancers led decliners by a very narrow margin on the NYSE and by about 5-4 on the Nasdaq exchange. There were 15 high-ranked companies from the Leaders List that hit new 52-week highs and were listed on the BreakOuts Page, versus 19 on the prior session. New 52-week lows solidly outnumbered new highs on the NYSE and on the Nasdaq exchange. A follow-through day on Monday, January 31st confirmed a new uptrend for the market averages (M criteria). PICTURED: The S&P 500 Index met resistance near its 50-day moving average (DMA) line and fell back near its 200 DMA line.
U.S. stocks finished mostly lower in choppy trading Monday. The major averages fluctuated between gains and losses as investors contended with the prospect of reduced monetary stimulus from global central banks. Seven of 11 S&P 500 sectors closed in negative territory, with Communication Services leading the decline amid weakness in mega-cap internet names and social media companies. Energy bucked the downtrend despite West Texas Intermediate crude slipping 1% to $91.35/barrel, still near a seven-year peak. In earnings, Tyson Foods Inc. (TSN +12.23%) following upbeat results, helped by price increases for its meat products. In merger and acquisition news, Spirit Airlines Inc. (SAVE +17.17%) rose after announcing plans to merge with Frontier Group Holdings (ULCC +3.47%) in a deal worth $6.6 billion. Elsewhere, Peloton Interactive Inc. (PTON +20.93%) rose on reports the fitness equipment maker was mulling takeover options.
Meanwhile, Treasuries stabilized, though market participants braced for imminent Federal Reserve rate hikes. On Friday, a stronger-than-expected monthly jobs report reignited concerns surrounding a faster pace of monetary policy tightening, while an update this Thursday is anticipated to reflect still-elevated consumer price inflation. The yield on the 10-year note increased one basis point (0.01%) to 1.92%, its highest level since December 2019. Overseas, Germany’s 10-year bund yield rose for a 10th straight session—its longest such streak since 2000—as investors assessed perceived hawkish remarks from a European Central Bank (ECB) official. |
 Kenneth J. Gruneisen started out as a licensed stockbroker in August 1987, a couple of months prior to the historic stock market crash that took the Dow Jones Industrial Average down -22.6% in a single day. He has published daily fact-based fundamental and technical analysis on high-ranked stocks online for two decades. Through FACTBASEDINVESTING.COM, Kenneth provides educational articles, news, market commentary, and other information regarding proven investment systems that work in good times and bad.
Comments contained in the body of this report are technical opinions only and are not necessarily those of Gruneisen Growth Corp. The material herein has been obtained from sources believed to be reliable and accurate, however, its accuracy and completeness cannot be guaranteed. Our firm, employees, and customers may effect transactions, including transactions contrary to any recommendation herein, or have positions in the securities mentioned herein or options with respect thereto. Any recommendation contained in this report may not be suitable for all investors and it is not to be deemed an offer or solicitation on our part with respect to the purchase or sale of any securities. |
|
 |
Bank, Biotech, and Commodity-Linked Groups Rose
Kenneth J. Gruneisen - Passed the CAN SLIM® Master's Exam
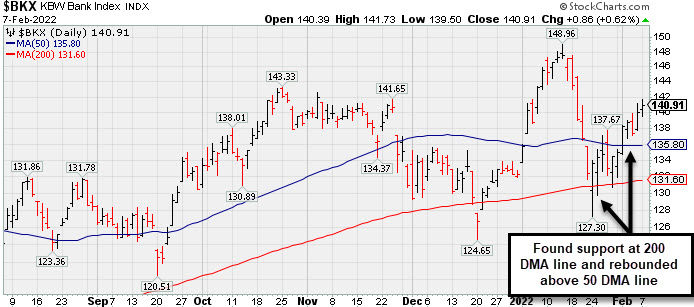
The Bank Index ($BKX +0.62%) posted a modest gain while the Broker/Dealer Index ($XBD -0.22%) and Retail Index ($RLX -0.17%) both edged lower. The Biotech Index ($BTK +0.92%) posted a solid gain while the Semiconductor Index ($SOX -0.02%) and Networking Index ($NWX -0.07%) both finished flat. Commodity-linked groups had a positive bias as the Gold & Silver Index ($XAU +3.45%) outpaced the Oil Services Index ($OSX +0.48%) and the Integrated Oil Index ($XOI +0.96%).
PICTURED: The Bank Index ($BKX +0.62%) found support at its 200-day moving average (DMA) line and rebounded above its 50 DMA line while posting 9 gains in the past 11 sessions.
| Oil Services |
$OSX |
67.38 |
+0.32 |
+0.48% |
+27.81% |
| Integrated Oil |
$XOI |
1,464.55 |
+13.93 |
+0.96% |
+24.30% |
| Semiconductor |
$SOX |
3,452.33 |
-0.74 |
-0.02% |
-12.51% |
| Networking |
$NWX |
849.13 |
-0.61 |
-0.07% |
-12.56% |
| Broker/Dealer |
$XBD |
493.53 |
-1.10 |
-0.22% |
+1.37% |
| Retail |
$RLX |
3,860.70 |
-6.63 |
-0.17% |
-8.65% |
| Gold & Silver |
$XAU |
128.87 |
+4.29 |
+3.45% |
-2.70% |
| Bank |
$BKX |
140.91 |
+0.86 |
+0.62% |
+6.57% |
| Biotech |
$BTK |
5,130.29 |
+46.67 |
+0.92% |
-7.03% |
|
|
|
 |
Featured Stocks
Kenneth J. Gruneisen - Passed the CAN SLIM® Master's Exam
|
|
|
Color Codes Explained :
Y - Better candidates highlighted by our
staff of experts.
G - Previously featured
in past reports as yellow but may no longer be buyable under the
guidelines.
***Last / Change / Volume data in this table is the closing quote data***
Symbol/Exchange
Company Name
Industry Group |
PRICE |
CHANGE
(%Change) |
Day High |
Volume
(% DAV)
(% 50 day avg vol) |
52 Wk Hi
% From Hi |
Featured
Date |
Price
Featured |
Pivot Featured |
|
Max Buy |
 REGN
-
NASDAQ
REGN
-
NASDAQ
Regeneron Pharmaceutical
DRUGS - Biotechnology
|
$622.36
|
-0.60
-0.10% |
$625.11
|
901,202
115.10% of 50 DAV
50 DAV is 783,000
|
$686.62
-9.36%
|
12/13/2021
|
$647.95
|
PP = $686.72
|
|
MB = $721.06
|
 Most Recent Note - 2/7/2022 12:26:25 PM
G - Met resistance near its 50 DMA line ($627). Gains above that important short-term average are needed for its outlook to improve. Reported Dec '21 quarterly earnings +149% on +104% sales revenues versus the year ago period. Recently holding its ground in a tight range above prior lows and above its 200 DMA line ($593) which define the important near-term support.
>>> FEATURED STOCK ARTICLE : Earnings News Due While Consolidating Above 200 DMA Line - 2/1/2022 |
View all notes |
Set NEW NOTE alert |
Company Profile |
SEC
News |
Chart |
Request a new note
C
A
S
I |
SF
-
NYSE
Stifel Financial Corp
FINANCIAL SERVICES - Investment Brokerage - Regiona
|
$77.37
|
-0.37
-0.48% |
$78.20
|
650,069
117.77% of 50 DAV
50 DAV is 552,000
|
$78.60
-1.56%
|
1/27/2022
|
$74.17
|
PP = $76.23
|
|
MB = $80.04
|
Most Recent Note - 2/7/2022 5:15:09 PM
Y - Still holding its ground after matching its 52-week high last week with a 6th consecutive gains backed by above average volume. Made little headway since it rose from a noted "double bottom" base. Disciplined investors may note Monday's follow-through day in the market (M criteria) confirmed a new uptrend. Bullish action has come since it reported strong results for the Dec '21 quarter versus the year ago period, its 5th strong quarterly comparison. Annual earnings (A criteria) history has been good.
>>> FEATURED STOCK ARTICLE : Formed Double Bottom Base and Faces Little Resistance - 1/27/2022 |
View all notes |
Set NEW NOTE alert |
Company Profile |
SEC
News |
Chart |
Request a new note
C
A
S
I |
TGH
-
NYSE
Textainer Group Holdings
TRANSPORTATION - Logistics
|
$38.22
|
+0.31
0.82% |
$38.66
|
514,956
150.57% of 50 DAV
50 DAV is 342,000
|
$41.24
-7.32%
|
1/31/2022
|
$36.68
|
PP = $41.34
|
|
MB = $43.41
|
Most Recent Note - 2/7/2022 12:32:41 PM
Y - Still hovering above its 50 DMA line ($36) and perched within close striking distance of its 52-week high. Subsequent gains above the pivot point backed by at least +40% above average volume are needed to trigger a technical buy signal. Highlighted in yellow with pivot point cited based on its 11/05/21 high plus 10 cents in the 1/31/22 mid-day report. Disciplined investors may note a follow-through day in the market (M criteria) confirmed a new uptrend. Fundamentals remain strong.
>>> FEATURED STOCK ARTICLE : Consolidating Above 50-Day Moving Average - 1/31/2022 |
View all notes |
Set NEW NOTE alert |
Company Profile |
SEC
News |
Chart |
Request a new note
C
A
S
I |
HWKN
-
NASDAQ
Hawkins Inc
CHEMICALS - Basic Chemicals
|
$39.65
|
-0.38
-0.95% |
$40.61
|
104,453
200.87% of 50 DAV
50 DAV is 52,000
|
$41.38
-4.18%
|
2/3/2022
|
$39.81
|
PP = $41.07
|
|
MB = $43.12
|
Most Recent Note - 2/7/2022 5:12:59 PM
Y - Churned above average volume and ended lower for a 2nd consecutive session, retreating after it hit a new all-time high. It was highlighted in yellow with pivot point cited based on its 1/04/22 high plus 10 cents in the 2/03/22 mid-day report following a gap up, rebounding above its 50 DMA line ($37.76). Subsequent gains and a strong close above the pivot point backed by at least +40% above average volume may trigger a technical buy signal. Bullish action came after it reported Dec '21 quarterly earnings +26% on +31% sales revenues versus the year ago period. Three of the 4 latest quarterly comparisons showed earnings increases above the +25% minimum guideline (C criteria) with a strong sales revenues growth rate. Annual earnings growth (A criteria) has been strong after a downturn in FY '18.
>>> FEATURED STOCK ARTICLE : Bullish Action Followed Another Strong Quarterly Report - 2/3/2022 |
View all notes |
Set NEW NOTE alert |
Company Profile |
SEC
News |
Chart |
Request a new note
C
A
S
I |
|
|
|
THESE ARE NOT BUY RECOMMENDATIONS!
Comments contained in the body of this report are technical
opinions only. The material herein has been obtained
from sources believed to be reliable and accurate, however,
its accuracy and completeness cannot be guaranteed.
This site is not an investment advisor, hence it does
not endorse or recommend any securities or other investments.
Any recommendation contained in this report may not
be suitable for all investors and it is not to be deemed
an offer or solicitation on our part with respect to
the purchase or sale of any securities. All trademarks,
service marks and trade names appearing in this report
are the property of their respective owners, and are
likewise used for identification purposes only.
This report is a service available
only to active Paid Premium Members.
You may opt-out of receiving report notifications
at any time. Questions or comments may be submitted
by writing to Premium Membership Services 665 S.E. 10 Street, Suite 201 Deerfield Beach, FL 33441-5634 or by calling 1-800-965-8307
or 954-785-1121.
|
|
|