You are not logged in.
This means you
CAN ONLY VIEW reports that were published prior to Tuesday, February 27, 2024.
You
MUST UPGRADE YOUR MEMBERSHIP if you want to see any current reports.
AFTER MARKET UPDATE - THURSDAY, FEBRUARY 7TH, 2019
Previous After Market Report Next After Market Report >>>
|
|
|
|
DOW |
-220.77 |
25,169.53 |
-0.87% |
|
Volume |
947,587,000 |
+19% |
|
Volume |
2,279,155,530 |
+6% |
|
NASDAQ |
-86.93 |
7,288.35 |
-1.18% |
|
Advancers |
922 |
31% |
|
Advancers |
988 |
33% |
|
S&P 500 |
-25.56 |
2,706.05 |
-0.94% |
|
Decliners |
2,024 |
69% |
|
Decliners |
2,043 |
67% |
|
Russell 2000 |
-12.40 |
1,505.63 |
-0.82% |
|
52 Wk Highs |
60 |
|
|
52 Wk Highs |
35 |
|
|
S&P 600 |
-8.86 |
935.46 |
-0.94% |
|
52 Wk Lows |
24 |
|
|
52 Wk Lows |
35 |
|
|
 |
Breadth Negative and Volume Higher as Major Indices Fell
Kenneth J. Gruneisen - Passed the CAN SLIM® Master's Exam
Stocks finished firmly lower Thursday. The Dow lost 220 points to 25,169 while the S&P 500 fell 25 points to 2,706. The Nasdaq Composite slipped 86 points to 7,288. The volume totals were higher than the prior session on both the NYSE and the Nasdaq exchange. Breadth was negative as decliners led advancers by more than a 2-1 margin on the NYSE and on the Nasdaq exchange. There were 17 high-ranked companies from the Leaders List that made a new 52-week high and were listed on the BreakOuts Page, versus the total of 26 on the prior session. New 52-week highs solidly outnumbered new 52-week lows on the NYSE while there were even totals on the Nasdaq exchange. The major indices are in a confirmed uptrend after recently noted improvements helped to signal a change in market direction (M criteria) back to a bullish stance. The Featured Stocks Page provides the most timely analysis on high-ranked leaders. Charts used courtesy of www.stockcharts.com
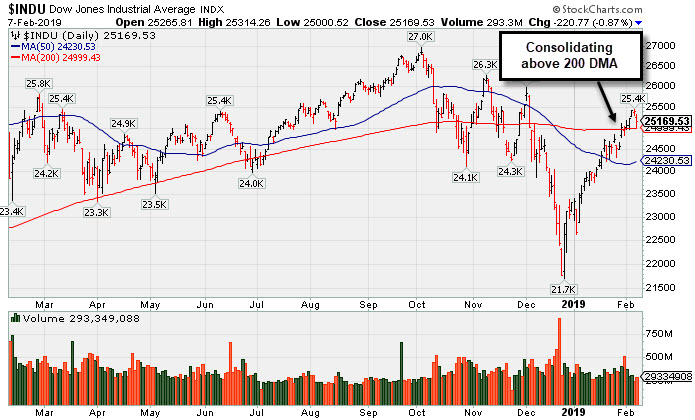
PICTURED: The Dow Jones Industrial Average is consolidating above its 200-day moving average (DMA) line.
The major averages declined as investors digested the latest trade updates. White House officials indicated that the proposed meeting between President Trump and Chinese President Xi is “highly unlikely” ahead of the March 1 deadline. Concerns of a slowdown in global economic growth also weighed on sentiment after the European Commission cut its 2019 growth outlook for the Eurozone. On the data front, a report showed initial jobless claims eased to 234,000 in the most recent week. A separate update showed consumer credit rose less than anticipated to $16.6 billion in December.
Nine of 11 S&P 500 sectors finished in negative territory with the “defensive” Real Estate and Utilities the only groups ending in positive territory. Energy shares led declines in sympathy with WTI crude falling 2.6% to $52.59/barrel. Technology shares were also broadly lower with Apple (AAPL -1.89%) fell. In M&A news, SunTrust Bank (STI +10.13%) and BB&T (BBT +3.98%) after announcing the largest bank merger since the financial crisis, a deal valued around $66 billion.
Treasuries strengthened along the curve with the yield on the 10-year note slipping three basis points to 2.66%. In commodities, COMEX gold fell 0.1% to $1,308.90/ounce amid a stronger dollar. |
 Kenneth J. Gruneisen started out as a licensed stockbroker in August 1987, a couple of months prior to the historic stock market crash that took the Dow Jones Industrial Average down -22.6% in a single day. He has published daily fact-based fundamental and technical analysis on high-ranked stocks online for two decades. Through FACTBASEDINVESTING.COM, Kenneth provides educational articles, news, market commentary, and other information regarding proven investment systems that work in good times and bad.
Comments contained in the body of this report are technical opinions only and are not necessarily those of Gruneisen Growth Corp. The material herein has been obtained from sources believed to be reliable and accurate, however, its accuracy and completeness cannot be guaranteed. Our firm, employees, and customers may effect transactions, including transactions contrary to any recommendation herein, or have positions in the securities mentioned herein or options with respect thereto. Any recommendation contained in this report may not be suitable for all investors and it is not to be deemed an offer or solicitation on our part with respect to the purchase or sale of any securities. |
|
 |
Energy, Tech, Retail, and Broker/Dealer Index Fell
Kenneth J. Gruneisen - Passed the CAN SLIM® Master's Exam
The Retail Index ($RLX -0.84%) and the Broker/Dealer Index ($XBD -1.04%) fell while the Bank Index ($BKX +0.46%) posted a modest gain. The tech sector had a negative bias as the Semiconductor Index ($SOX -2.24%), Networking Index ($NWX -1.53%) and the Biotech Index ($BTK -2.38%) ended lower. The Integrated Oil Index ($XOI -2.44%) and Oil Services Index ($OSX -4.60%) outpaced the Gold & Silver Index ($XAU -0.80%) to the downside.
Charts courtesy of www.stockcharts.com
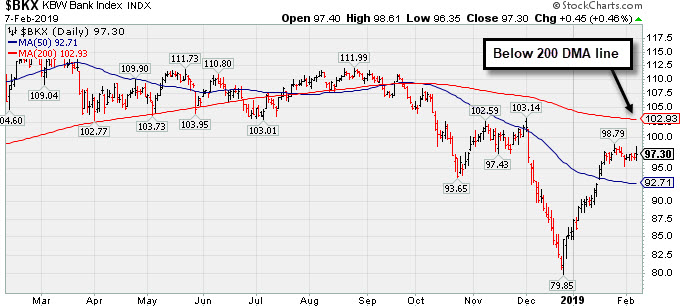 PICTURED: The Bank Index ($BKX +0.46%) rebounded impressively from its December low yet remains below its 200-day moving average (DMA) line.
| Oil Services |
$OSX |
94.24 |
-4.55 |
-4.61% |
+16.92% |
| Integrated Oil |
$XOI |
1,260.32 |
-31.58 |
-2.44% |
+8.73% |
| Semiconductor |
$SOX |
1,303.92 |
-29.84 |
-2.24% |
+12.88% |
| Networking |
$NWX |
537.01 |
-8.37 |
-1.53% |
+9.89% |
| Broker/Dealer |
$XBD |
260.13 |
-2.72 |
-1.04% |
+9.60% |
| Retail |
$RLX |
2,101.50 |
-17.85 |
-0.84% |
+7.69% |
| Gold & Silver |
$XAU |
74.76 |
-0.60 |
-0.80% |
+5.80% |
| Bank |
$BKX |
97.30 |
+0.45 |
+0.46% |
+13.42% |
| Biotech |
$BTK |
4,788.49 |
-116.61 |
-2.38% |
+13.45% |
|
|
|
 |
Closed Near Pivot Point After Gap Up and Big Volume-Driven Gain
Kenneth J. Gruneisen - Passed the CAN SLIM® Master's Exam
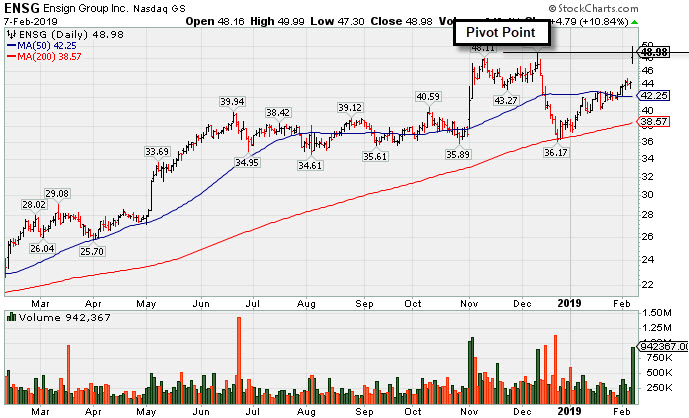
Ensign Group Inc (ENSG +$4.79 or +10.84% to $48.98) gapped up today hitting new 52-week and all-time highs with a considerable volume-driven gain. It was highlighted in yellow with pivot point cited based on its 12/12/18 high plus 10 cents. Subsequent confirming gains backed by at least +40% above average volume and a close above the pivot point ($49.06) may trigger a proper technical buy signal.
The 5 most recent quarters through Dec '18 showed earnings increases above the +25% minimum guideline (C criteria) while its sales revenues growth rate has been in the 9-11% range. Annual earnings (A criteria) history has improved steadily after downturn in FY '13 and '14.
The number of top-rated funds owning its shares rose from 324 in Mar '18 to 443 in Dec '18, a reassuring sign concerning the I criteria. It has a Timeliness Rating of A and Sponsorship Rating of C. Its small supply of 52.3 million shares outstanding (S criteria) can contribute to greater volatility in the event of institutional buying or selling. .
Charts courtesy of www.stockcharts.com
 |
|
|
Color Codes Explained :
Y - Better candidates highlighted by our
staff of experts.
G - Previously featured
in past reports as yellow but may no longer be buyable under the
guidelines.
***Last / Change / Volume data in this table is the closing quote data***
Symbol/Exchange
Company Name
Industry Group |
PRICE |
CHANGE
(%Change) |
Day High |
Volume
(% DAV)
(% 50 day avg vol) |
52 Wk Hi
% From Hi |
Featured
Date |
Price
Featured |
Pivot Featured |
|
Max Buy |
MLR
-
NYSE
Miller Industries Inc
AUTOMOTIVE - Auto Parts
|
$29.84
|
-0.36
-1.19% |
$30.35
|
14,314
42.10% of 50 DAV
50 DAV is 34,000
|
$30.84
-3.24%
|
11/30/2018
|
$28.35
|
PP = $29.50
|
|
MB = $30.98
|
 Most Recent Note - 2/7/2019 5:37:12 PM
Y - Volume totals have been cooling while holding its ground near its all-time high. Subsequent gains above the pivot point backed by at least +40% above average volume may help clinch a proper technical buy signal. Its 50 DMA line and recent low define near-term support to watch on pullbacks.
>>> FEATURED STOCK ARTICLE : Traded Above Pivot Point Recently Without Great Volume - 1/29/2019 |
View all notes |
Set NEW NOTE alert |
Company Profile |
SEC
News |
Chart |
Request a new note
C
A
S
I |
LHCG
-
NASDAQ
L H C Group Inc
HEALTH SERVICES - Home Health Care
|
$109.83
|
-0.04
-0.04% |
$111.97
|
293,339
110.28% of 50 DAV
50 DAV is 266,000
|
$112.22
-2.13%
|
1/23/2019
|
$107.29
|
PP = $107.61
|
|
MB = $112.99
|
Most Recent Note - 2/6/2019 5:38:35 PM
Y - Pulled back today with higher (near average) volume. Subsequent gains above the pivot point backed by at least +40% above average volume may help clinch a convincing technical buy signal.
>>> FEATURED STOCK ARTICLE : Healthcare Services Firm Reached a New High - 1/23/2019 |
View all notes |
Set NEW NOTE alert |
Company Profile |
SEC
News |
Chart |
Request a new note
C
A
S
I |
ENSG
-
NASDAQ
Ensign Group Inc
HEALTH SERVICES - Long-Term Care Facilities
|
$48.98
|
+4.79
10.84% |
$49.99
|
939,763
273.98% of 50 DAV
50 DAV is 343,000
|
$48.96
0.04%
|
2/7/2019
|
$48.71
|
PP = $49.06
|
|
MB = $51.51
|
Most Recent Note - 2/7/2019 5:27:55 PM
Y - Closed in the middle of its intra-day range after a gap up for a new all-time high. Color code was changed to yellow with pivot point cited based on its 12/12/18 high plus 10 cents. The 5 most recent quarters through Dec '18 showed earnings increases above the +25% minimum guideline (C criteria) while its sales revenues growth rate has been in the 9-11% range. Annual earnings (A criteria) history has improved steadily after downturn in FY '13 and '14. See the latest FSU analysis for more details and a new annotated graph.
>>> FEATURED STOCK ARTICLE : Closed Near Pivot Point After Gap Up and Big Volume-Driven Gain - 2/7/2019 |
View all notes |
Set NEW NOTE alert |
Company Profile |
SEC
News |
Chart |
Request a new note
C
A
S
I |
BSTC
-
NASDAQ
Biospecifics Technologie
Medical-Biomed/Biotech
|
$67.30
|
-0.97
-1.42% |
$68.81
|
30,829
75.19% of 50 DAV
50 DAV is 41,000
|
$70.25
-4.20%
|
1/18/2019
|
$67.40
|
PP = $66.31
|
|
MB = $69.63
|
Most Recent Note - 2/6/2019 5:42:52 PM
Y - Perched near its 52-week high. The thinly traded Biomed/Biotech firm rose above its pivot point on 2/04/19 with a big gain backed by +148% above average volume, a reassuring sign of institutional accumulation clinching a technical buy signal. See the latest FSU analysis for more details and an annotated graph.
>>> FEATURED STOCK ARTICLE : Reversed Into Red After Hitting a New High - 2/5/2019 |
View all notes |
Set NEW NOTE alert |
Company Profile |
SEC
News |
Chart |
Request a new note
C
A
S
I |
UBNT
-
NASDAQ
Ubiquiti Networks
TELECOMMUNICATIONS - Diversified Communication Serv
|
$107.28
|
-2.31
-2.11% |
$109.75
|
280,133
86.46% of 50 DAV
50 DAV is 324,000
|
$115.44
-7.07%
|
11/9/2018
|
$108.20
|
PP = $101.43
|
|
MB = $106.50
|
Most Recent Note - 2/5/2019 3:59:16 PM
G - Encountering mild distributional pressure today while reversing an early gain. Still quietly consolidating above its 50 DMA line ($105.18). Faces some resistance due to overhead supply up to the $115 level. Prior low ($92.08 on 12/24/18) defines the next important support.
>>> FEATURED STOCK ARTICLE : Consolidating Above 50-Day Moving Average - 1/31/2019 |
View all notes |
Set NEW NOTE alert |
Company Profile |
SEC
News |
Chart |
Request a new note
C
A
S
I |
Symbol/Exchange
Company Name
Industry Group |
PRICE |
CHANGE
(%Change) |
Day High |
Volume
(% DAV)
(% 50 day avg vol) |
52 Wk Hi
% From Hi |
Featured
Date |
Price
Featured |
Pivot Featured |
|
Max Buy |
NOW
-
NYSE
Servicenow Inc
Computer Sftwr-Enterprse
|
$226.96
|
+1.40
0.62% |
$228.04
|
1,470,292
63.93% of 50 DAV
50 DAV is 2,300,000
|
$229.50
-1.11%
|
1/31/2019
|
$218.14
|
PP = $206.40
|
|
MB = $216.72
|
Most Recent Note - 2/7/2019 5:35:15 PM
G - Stubbornly holding its ground above its "max buy" level and near its all-time high with volume totals cooling. Prior high ($206) defines initial support to watch on pullbacks.
>>> FEATURED STOCK ARTICLE : Breakaway Gap Followed Strong Earnings Report - 2/1/2019 |
View all notes |
Set NEW NOTE alert |
Company Profile |
SEC
News |
Chart |
Request a new note
C
A
S
I |
PAYC
-
NYSE
Paycom Software Inc
COMPUTER SOFTWARE and SERVICES - Application Software
|
$168.17
|
-0.97
-0.57% |
$172.46
|
1,257,032
209.16% of 50 DAV
50 DAV is 601,000
|
$179.22
-6.17%
|
2/6/2019
|
$171.66
|
PP = $164.18
|
|
MB = $172.39
|
Most Recent Note - 2/7/2019 12:36:51 PM
Y - Holding its ground today. Highlighted in yellow with new pivot point cited based on its 9/14/18 high plus 10 cents in the 2/06/19 mid-day report. The "breakaway gap" with +388% above average volume cleared all overhead supply and triggered a technical buy signal. Reported earnings +24% on +32% sales revenues for the Dec '18 quarter, one notch below the +25% minimum earnings guideline (C criteria). Found support after a deep slump below its 200 DMA line since dropped from the Featured Stocks list on 10/10/18. See the latest FSU analysis for more details and an annotated graph.
>>> FEATURED STOCK ARTICLE : Breakaway Gap Backed by Volume +388% Above Average - 2/6/2019 |
View all notes |
Set NEW NOTE alert |
Company Profile |
SEC
News |
Chart |
Request a new note
C
A
S
I |
PYPL
-
NASDAQ
Paypal Holdings Inc
Finance-CrdtCard/PmtPr
|
$90.85
|
-1.40
-1.52% |
$91.71
|
6,866,679
74.90% of 50 DAV
50 DAV is 9,168,000
|
$94.58
-3.94%
|
1/24/2019
|
$92.56
|
PP = $93.80
|
|
MB = $98.49
|
Most Recent Note - 2/5/2019 3:55:30 PM
Y - Rebounding after a gap down on 1/31/19 following earnings news. Reported +25% earnings on +13% sales revenues for the Dec '18 quarter. Disciplined investors note that the recent gains above the pivot point lacked the +40% above average volume needed to trigger a proper technical buy signal.
>>> FEATURED STOCK ARTICLE : Perched Within Striking Distance of High Ahead of Earnings News - 1/24/2019 |
View all notes |
Set NEW NOTE alert |
Company Profile |
SEC
News |
Chart |
Request a new note
C
A
S
I |
ALRM
-
NASDAQ
Alarm.com Holdings Inc
Security/Sfty
|
$63.02
|
-1.38
-2.14% |
$64.60
|
373,502
71.69% of 50 DAV
50 DAV is 521,000
|
$65.45
-3.71%
|
1/22/2019
|
$60.52
|
PP = $60.30
|
|
MB = $63.32
|
Most Recent Note - 2/6/2019 5:41:26 PM
G - Color code is changed to green after rallying for a new all-time high above its "max buy" level with above average volume. Stubbornly held its ground after recent gains for new highs lacked great volume conviction. Prior highs in the $60 area define initial support to watch on pullbacks.
>>> FEATURED STOCK ARTICLE : Pullback Broke Steak of Gains and Reversed From New High - 1/22/2019 |
View all notes |
Set NEW NOTE alert |
Company Profile |
SEC
News |
Chart |
Request a new note
C
A
S
I |
PLNT
-
NYSE
Planet Fitness Inc Cl A
Leisure-Services
|
$57.50
|
-0.42
-0.73% |
$57.81
|
1,093,491
86.37% of 50 DAV
50 DAV is 1,266,000
|
$59.91
-4.02%
|
11/7/2018
|
$57.10
|
PP = $55.45
|
|
MB = $58.22
|
Most Recent Note - 2/5/2019 12:30:22 PM
G - Color code is changed to green after rising above its "max buy" level with above average volume today, hitting a new all-time high. Its 50 DMA line ($55.53) defines important near-term support to watch above the recent low ($48).
>>> FEATURED STOCK ARTICLE : Hovering in a Tight Range Near All-Time High - 1/25/2019 |
View all notes |
Set NEW NOTE alert |
Company Profile |
SEC
News |
Chart |
Request a new note
C
A
S
I |
Symbol/Exchange
Company Name
Industry Group |
PRICE |
CHANGE
(%Change) |
Day High |
Volume
(% DAV)
(% 50 day avg vol) |
52 Wk Hi
% From Hi |
Featured
Date |
Price
Featured |
Pivot Featured |
|
Max Buy |
TEAM
-
NASDAQ
Atlassian Corp Plc Cl A
Comp Sftwr-Spec Enterprs
|
$102.35
|
-1.19
-1.15% |
$103.72
|
1,178,109
67.47% of 50 DAV
50 DAV is 1,746,000
|
$104.31
-1.88%
|
1/7/2019
|
$94.68
|
PP = $98.31
|
|
MB = $103.23
|
Most Recent Note - 2/5/2019 3:58:03 PM
G - Color code is changed to green while posting a 5th consecutive gain today, rising above its "max buy" level and hitting new all-time highs, however gains have lacked great volume conviction. Gains and a strong close above the pivot point backed by at least +40% above average volume are needed to clinch a proper technical buy signal. Its 50 DMA line ($87.97) and prior low define near-term support to watch on pullbacks. Fundamentals remain strong.
>>> FEATURED STOCK ARTICLE : Volume Light While Hovering Near High - 1/28/2019 |
View all notes |
Set NEW NOTE alert |
Company Profile |
SEC
News |
Chart |
Request a new note
C
A
S
I |
TTD
-
NASDAQ
The Trade Desk Inc Cl A
Comml Svcs-Advertising
|
$142.04
|
-5.46
-3.70% |
$145.40
|
1,328,403
121.09% of 50 DAV
50 DAV is 1,097,000
|
$161.50
-12.05%
|
2/6/2019
|
$148.65
|
PP = $149.00
|
|
MB = $156.45
|
Most Recent Note - 2/7/2019 12:50:58 PM
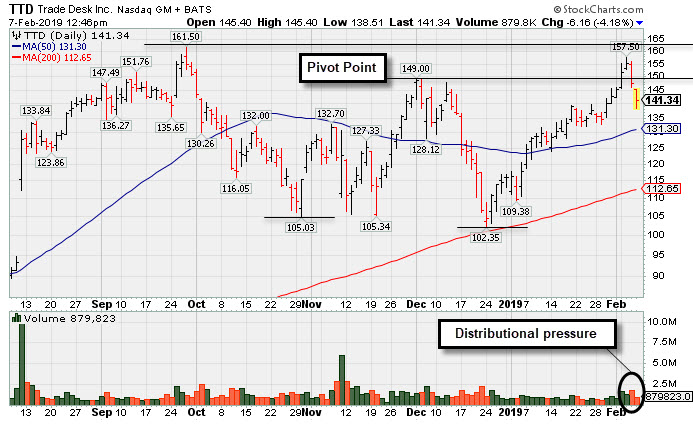
Y - Pulling back for a 2nd consecutive session with higher volume, action indicative of distributional pressure. Color code was changed to yellow with pivot point cited based on its 12/03/18 high. Faces resistance due to overhead supply up to the $161 level. Gain on 2/04/19 was backed by +48% above average volume while clearing a "double bottom" base. Reported earnings +86% on +50% sales revenues for the Sep '18 quarter. Three of the past 4 quarterly comparisons were well above the +25% minimum guideline (C criteria).
 There are no Featured Stock Updates™ available for this stock at this time. You may request one by clicking the Request a New Note link below |
View all notes |
Set NEW NOTE alert |
Company Profile |
SEC
News |
Chart |
Request a new note
C
A
S
I
There are no Featured Stock Updates™ available for this stock at this time. You may request one by clicking the Request a New Note link below |
View all notes |
Set NEW NOTE alert |
Company Profile |
SEC
News |
Chart |
Request a new note
C
A
S
I |
MEDP
-
NASDAQ
Medpace Holdings Inc
Medical-Research Eqp/Svc
|
$64.69
|
-1.35
-2.04% |
$65.97
|
719,100
94.99% of 50 DAV
50 DAV is 757,000
|
$69.71
-7.20%
|
1/30/2019
|
$64.10
|
PP = $65.19
|
|
MB = $68.45
|
Most Recent Note - 2/7/2019 5:29:35 PM
Y - Pulled back today for a 3rd consecutive loss. Subsequent gains above the pivot point backed by at least +40% above average volume may trigger a technical buy signal. Fundamentals remain strong. The 200 DMA line acted as support above the prior low and it has rebounded since dropped from the Featured Stocks list on 12/19/18.
>>> FEATURED STOCK ARTICLE : Rallied Near 52-Week High With a Volume-Driven Gain - 1/30/2019 |
View all notes |
Set NEW NOTE alert |
Company Profile |
SEC
News |
Chart |
Request a new note
C
A
S
I |
INVA
-
NASDAQ
Innoviva Inc
Medical-Biomed/Biotech
|
$15.78
|
+0.44
2.87% |
$15.93
|
2,103,575
170.77% of 50 DAV
50 DAV is 1,231,800
|
$20.54
-23.17%
|
11/23/2018
|
$17.74
|
PP = $18.09
|
|
MB = $18.99
|
Most Recent Note - 2/7/2019 5:32:42 PM
Found prompt support today at its 200 DMA line. Reported earnings +9% on +15% sales revenues for the Dec '18 quarter, below the +25% minimum guideline (C criteria) raising fundamental concerns. Damaging volume-driven losses last week triggered technical sell signals. A rebound above the 50 DMA line is ($17.82) needed for its outlook to improve. It will be dropped from the Featured Stocks list tonight.
>>> FEATURED STOCK ARTICLE : Volume Heavy Behind Damaging Losses Negating Breakout - 2/4/2019 |
View all notes |
Set NEW NOTE alert |
Company Profile |
SEC
News |
Chart |
Request a new note
C
A
S
I |
|
|
|
THESE ARE NOT BUY RECOMMENDATIONS!
Comments contained in the body of this report are technical
opinions only. The material herein has been obtained
from sources believed to be reliable and accurate, however,
its accuracy and completeness cannot be guaranteed.
This site is not an investment advisor, hence it does
not endorse or recommend any securities or other investments.
Any recommendation contained in this report may not
be suitable for all investors and it is not to be deemed
an offer or solicitation on our part with respect to
the purchase or sale of any securities. All trademarks,
service marks and trade names appearing in this report
are the property of their respective owners, and are
likewise used for identification purposes only.
This report is a service available
only to active Paid Premium Members.
You may opt-out of receiving report notifications
at any time. Questions or comments may be submitted
by writing to Premium Membership Services 665 S.E. 10 Street, Suite 201 Deerfield Beach, FL 33441-5634 or by calling 1-800-965-8307
or 954-785-1121.
|
|
|

