You are not logged in.
This means you
CAN ONLY VIEW reports that were published prior to Monday, April 14, 2025.
You
MUST UPGRADE YOUR MEMBERSHIP if you want to see any current reports.
AFTER MARKET UPDATE - THURSDAY, FEBRUARY 7TH, 2013
Previous After Market Report Next After Market Report >>>
|
|
|
|
DOW |
-42.47 |
13,944.05 |
-0.30% |
|
Volume |
663,726,710 |
-3% |
|
Volume |
1,868,873,000 |
-2% |
|
NASDAQ |
-3.35 |
3,165.13 |
-0.11% |
|
Advancers |
1,283 |
41% |
|
Advancers |
934 |
36% |
|
S&P 500 |
-2.73 |
1,509.39 |
-0.18% |
|
Decliners |
1,706 |
55% |
|
Decliners |
1,519 |
59% |
|
Russell 2000 |
-3.19 |
908.10 |
-0.35% |
|
52 Wk Highs |
223 |
|
|
52 Wk Highs |
134 |
|
|
S&P 600 |
-0.78 |
509.19 |
-0.15% |
|
52 Wk Lows |
9 |
|
|
52 Wk Lows |
17 |
|
|
 |
Major Averages Edged Lower on Lighter Volume
Kenneth J. Gruneisen - Passed the CAN SLIM® Master's Exam
The major averages ended with small losses on Thursday. The volume totals were reported lighter on the NYSE and on the Nasdaq exchange, indicating no great conviction from the institutional crowd. Breadth was negative as decliners led advancers by nearly a 3-2 margin on the NYSE and on the Nasdaq exchange. The total number of stocks hitting new 52-week highs easily outnumbered new 52-week lows on the NYSE and on the Nasdaq exchange. There were 72 high-ranked companies from the CANSLIM.net Leaders List making new 52-week highs and appearing on the CANSLIM.net BreakOuts Page, up from the prior session total of 58 stocks. There were gains for only 2 of the 11 high-ranked companies currently included on the Featured Stocks Page.
The major averages were firmly in negative territory as investors digested the latest economic data. Before the open, weekly jobless claims fell 5,000 in the prior week to 366,000, slightly above the consensus estimate of 360,000. Separate reports showed non-farm productivity fell -2.0% and unit labor costs increased +4.5% in the fourth quarter. Over in Europe, the ECB maintained its benchmark interest rate at 0.75%. At a press conference, ECB President Mario Draghi said a recovery for the region should begin later this year.
Materials and energy were the worst performing sectors as coal producer Cliff Natural Resources Inc (CLF -2.89%) and Exxon Mobil Corp (XOM -1.09%) lost ground. Retailers were also weak with Gap Inc (GPS -2.98%) despite reporting January sales that beat analyst projections. Consumer staples were the best performing group. Philip Morris International Inc (PM +2.43%) rose after quarterly results topped consensus estimates. Over in tech, Apple Inc (AAPL +2.97%) rallied after hedge fund Greenlight Capital urged the company to return more cash to shareholders.
On the earnings front, O’Reilly Automotive (ORLY +8.05%) rallied following its better-than-expected quarterly results. Sprint Nextel Corp (S -0.52%) edged lower after its earnings report showed a larger-than-expected decline in subscribers. News Corp (NWS -2.75%), Visa Inc (V -2.34%) and Yelp Inc (YELP -4.607%) pulled back after their latest earnings reports.
The 10-year note was unchanged to yield 1.96%.
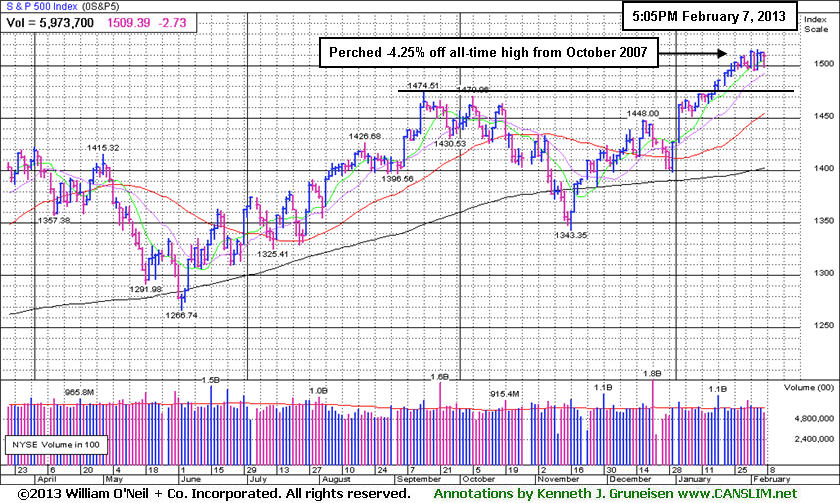
The latest rally has produced a few action worthy candidates meeting all of the fact-based investment system's criteria. Selectivity and discipline are required, as always. Investors may consider new buying efforts in stocks meeting all key criteria, as the market's (M criteria) confirmed uptrend has been comprised by great leadership (stocks hitting new 52-week highs) in the broader market. Widespread gains helped all of the major averages blast higher, and the benchmark S&P 500 Index is perched at its best level in more than five years and only -4% off its October 2007 all-time high.
Watch for an announcement via email concerning the next WEBCAST. The webcast will also be available via an updated link highlighted at the top of the Premium Member Homepage.
PICTURED: The benchmark S&P 500 Index is currently perched only -4.25% off its October 2007 all-time high. Subsequent gains into new high territory may help the broader market gain more momentum and may attract greater interest in stocks overall.
|
 Kenneth J. Gruneisen started out as a licensed stockbroker in August 1987, a couple of months prior to the historic stock market crash that took the Dow Jones Industrial Average down -22.6% in a single day. He has published daily fact-based fundamental and technical analysis on high-ranked stocks online for two decades. Through FACTBASEDINVESTING.COM, Kenneth provides educational articles, news, market commentary, and other information regarding proven investment systems that work in good times and bad.
Comments contained in the body of this report are technical opinions only and are not necessarily those of Gruneisen Growth Corp. The material herein has been obtained from sources believed to be reliable and accurate, however, its accuracy and completeness cannot be guaranteed. Our firm, employees, and customers may effect transactions, including transactions contrary to any recommendation herein, or have positions in the securities mentioned herein or options with respect thereto. Any recommendation contained in this report may not be suitable for all investors and it is not to be deemed an offer or solicitation on our part with respect to the purchase or sale of any securities. |
|
 |
Defensive Groups Edged Higher Amid Mostly Weak Group Action
Kenneth J. Gruneisen - Passed the CAN SLIM® Master's Exam
Defensive groups posted small gains as the Gold & Silver Index ($XAU +0.17%) and Healthcare Index ($HMO +0.32%) bucked a mostly negative market on Thursday. Meanwhile, there were modest losses for the tech sector as the Biotechnology Index ($BTK -1.03%), Internet Index ($IIX -0.69%), Semiconductor Index ($SOX -0.55%), and Networking Index ($NWX -0.36%) finished unanimously lower. There was a small loss for the Integrated Oil Index ($XOI -0.62%) while the Oil Services Index ($OSX -0.07%) finished virtually flat. The Bank Index ($BKX -0.36%) and Retail Index ($RLX -0.28%) edged lower and also created a drag on thew major averages while the Broker/Dealer Index ($XBD +0.00%) ended unchanged.
Charts courtesy www.stockcharts.com
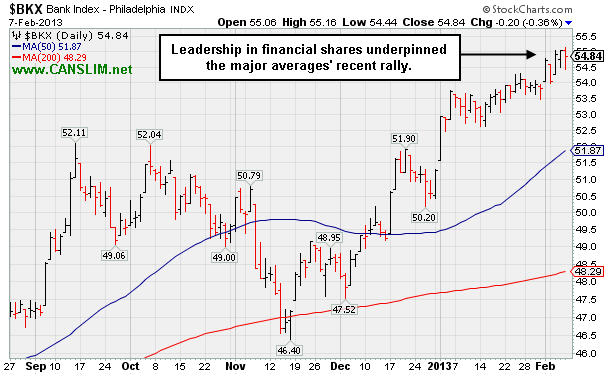
PICTURED: The Bank Index ($BKX -0.36%) has been influential as the major averages have recently rallied. This important financial group has a history of being a reliable "leading indicator" and its ongoing strength bodes well for the broader market's outlook.
| Oil Services |
$OSX |
246.26 |
-0.17 |
-0.07% |
+11.86% |
| Healthcare |
$HMO |
2,764.49 |
+8.95 |
+0.32% |
+9.96% |
| Integrated Oil |
$XOI |
1,347.86 |
-8.39 |
-0.62% |
+8.54% |
| Semiconductor |
$SOX |
419.26 |
-2.30 |
-0.55% |
+9.17% |
| Networking |
$NWX |
245.76 |
-0.90 |
-0.36% |
+8.48% |
| Internet |
$IIX |
356.65 |
-2.46 |
-0.69% |
+9.07% |
| Broker/Dealer |
$XBD |
106.82 |
+0.00 |
+0.00% |
+13.24% |
| Retail |
$RLX |
699.13 |
-1.98 |
-0.28% |
+7.05% |
| Gold & Silver |
$XAU |
153.23 |
+0.26 |
+0.17% |
-7.47% |
| Bank |
$BKX |
54.84 |
-0.20 |
-0.36% |
+6.94% |
| Biotech |
$BTK |
1,667.25 |
-17.31 |
-1.03% |
+7.77% |
|
|
|
 |
Base Building Continues After Positive Reversal Near 50 Day Average
Kenneth J. Gruneisen - Passed the CAN SLIM® Master's Exam
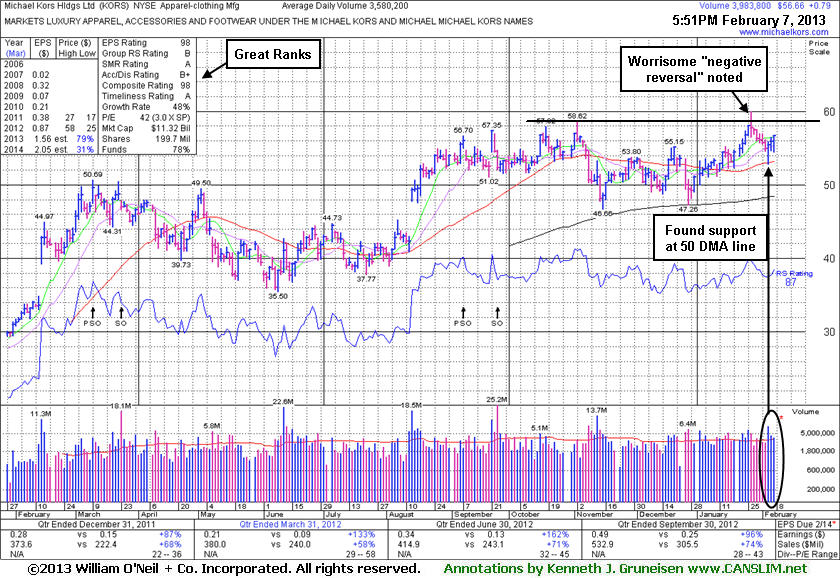
Michael Kors Hldgs Ltd (KORS +$0.79 or +1.41% to $56.66) managed an impressive "positive reversal" with a gain on heavy volume after a weak start on 2/05/13 as it tested and found prompt support at its 50-day moving average (DMA) line following 6 consecutive losses. It had slumped since a noted "negative reversal" after touching a new 52-week high on 1/28/13. It was previously noted repeatedly with caution - "Disciplined investors may watch for volume-driven gains above the pivot point to trigger a proper technical buy signal before taking action."
KORS was last shown in this FSU section on 1/23/13 with an annotated weekly graph under the headline, "High-Ranked Luxury Apparel Firm Worthy For Watchlist". This high-ranked Apparel - Clothing Manufacturing firm headquartered in Hong Kong met stubborn resistance and failed to close above the pivot point cited based on its 11/02/12 high plus 10 cents and, instead, it encountered distributional pressure.
Its strong quarterly and annual earnings history (C and A criteria) meet the fundamental guidelines of the fact-based investment system. It has traded up considerably from its 12/15/11 IPO priced at $20. The number of top-rated funds owning its shares rose from 328 n Mar '12 to 521 in Dec '12, a reassuring sign concerning the I criteria. Its current Up/Down Volume Ratio of 1.4 is an unbiased indication that its shares have been under accumulation over the past 50 days.
The graph below shows its current base still being built. As previously noted - "It could spend more time base building. There is no advantage gained by jumping in 'early' before definitive proof of meaningful new buying demand from the institutional crowd, yet it is an ideal candidate for investors to have on their watchlist until a decisive breakout might warrant action."
|
|
|
Color Codes Explained :
Y - Better candidates highlighted by our
staff of experts.
G - Previously featured
in past reports as yellow but may no longer be buyable under the
guidelines.
***Last / Change / Volume data in this table is the closing quote data***
Symbol/Exchange
Company Name
Industry Group |
PRICE |
CHANGE
(%Change) |
Day High |
Volume
(% DAV)
(% 50 day avg vol) |
52 Wk Hi
% From Hi |
Featured
Date |
Price
Featured |
Pivot Featured |
|
Max Buy |
CELG
-
NASDAQ
Celgene Corp
DRUGS - Drug Manufacturers - Major
|
$97.84
|
-0.06
-0.06% |
$99.20
|
2,927,105
78.53% of 50 DAV
50 DAV is 3,727,600
|
$102.29
-4.36%
|
12/11/2012
|
$82.24
|
PP = $81.34
|
|
MB = $85.41
|
Most Recent Note - 2/4/2013 6:19:32 PM
G - Perched near its all-time high, very extended from its prior base. See latest FSU analysis for more details and a new annotated graph.
>>> The latest Featured Stock Update with an annotated graph appeared on 2/4/2013. Click here.
View all notes |
Alert me of new notes |
CANSLIM.net Company Profile |
SEC |
Zacks Reports |
StockTalk |
News |
Chart |
Request a new note
C
A N
S L
I M


|
CFNL
-
NASDAQ
Cardinal Financial Corp
BANKING - Regional - Southeast Banks
|
$16.16
|
-0.14
-0.86% |
$16.35
|
61,285
28.01% of 50 DAV
50 DAV is 218,800
|
$16.90
-4.38%
|
12/3/2012
|
$15.20
|
PP = $16.31
|
|
MB = $17.13
|
Most Recent Note - 2/5/2013 3:49:27 PM
Y - Rebounding today with below average volume while rising back above its pivot point and still consolidating just above its 50 DMA line defining important near-term support. Subsequent losses leading to a damaging violation and a slump below the recent low ($15.74 on 1/18/13) would raise concerns and trigger technical sell signals.
>>> The latest Featured Stock Update with an annotated graph appeared on 1/31/2013. Click here.
View all notes |
Alert me of new notes |
CANSLIM.net Company Profile |
SEC |
Zacks Reports |
StockTalk |
News |
Chart |
Request a new note
C
A N
S L
I M
|
CMCSA
-
NASDAQ
Comcast Corp Cl A
MEDIA - CATV Systems
|
$38.62
|
-0.11
-0.28% |
$38.74
|
13,031,247
108.96% of 50 DAV
50 DAV is 11,959,400
|
$40.28
-4.12%
|
12/3/2012
|
$37.08
|
PP = $38.06
|
|
MB = $39.96
|
Most Recent Note - 2/5/2013 3:39:08 PM
Y - Rallying up from support near prior highs and its 50 DMA line with a solid volume-driven gain today. A subsequent violation of the latest low ($37.81 on 2/04/13) would trigger a technical sell signal.
>>> The latest Featured Stock Update with an annotated graph appeared on 1/29/2013. Click here.
View all notes |
Alert me of new notes |
CANSLIM.net Company Profile |
SEC |
Zacks Reports |
StockTalk |
News |
Chart |
Request a new note
C
A N
S L
I M
|
KORS
-
NYSE
Michael Kors Hldgs Ltd
RETAIL - Apparel Stores
|
$56.66
|
+0.79
1.41% |
$56.70
|
3,984,233
111.29% of 50 DAV
50 DAV is 3,580,200
|
$60.00
-5.57%
|
1/23/2013
|
$54.98
|
PP = $58.72
|
|
MB = $61.66
|
 Most Recent Note - 2/7/2013 6:12:57 PM
Y - Managed an impressive "positive reversal" after testing support at its 50 DMA line on 2/05/13. Recently noted repeatedly with caution - "Disciplined investors may watch for volume-driven gains above the pivot point to trigger a proper technical buy signal before taking action." See the latest FSU analysis for more details and a new annotated graph.
>>> The latest Featured Stock Update with an annotated graph appeared on 2/7/2013. Click here.
View all notes |
Alert me of new notes |
CANSLIM.net Company Profile |
SEC |
Zacks Reports |
StockTalk |
News |
Chart |
Request a new note
C
A N
S L
I M
|
MIDD
-
NASDAQ
Middleby Corp
MANUFACTURING - Diversified Machinery
|
$147.56
|
-0.59
-0.40% |
$148.86
|
80,266
87.15% of 50 DAV
50 DAV is 92,100
|
$149.37
-1.21%
|
10/8/2012
|
$118.46
|
PP = $122.67
|
|
MB = $128.80
|
Most Recent Note - 2/5/2013 3:36:13 PM
G - Volume is above average while rallying and hitting another new all-time high today, getting even more extended from any sound base. Prior highs and its 50 DMA line define important near-term chart support in the $132-134 area.
>>> The latest Featured Stock Update with an annotated graph appeared on 1/30/2013. Click here.
View all notes |
Alert me of new notes |
CANSLIM.net Company Profile |
SEC |
Zacks Reports |
StockTalk |
News |
Chart |
Request a new note
C
A N
S L
I M
|
Symbol/Exchange
Company Name
Industry Group |
PRICE |
CHANGE
(%Change) |
Day High |
Volume
(% DAV)
(% 50 day avg vol) |
52 Wk Hi
% From Hi |
Featured
Date |
Price
Featured |
Pivot Featured |
|
Max Buy |
N
-
NYSE
Netsuite Inc
DIVERSIFIED SERVICES - Business/Management Services
|
$66.34
|
-1.46
-2.15% |
$67.80
|
254,363
69.01% of 50 DAV
50 DAV is 368,600
|
$75.75
-12.42%
|
12/12/2012
|
$64.75
|
PP = $67.12
|
|
MB = $70.48
|
Most Recent Note - 2/7/2013 5:29:30 PM
G - Fell again today with lighter volume and finished near its 50 DMA line ($65.92 now). Following a worrisome "negative reversal" on 2/01/13 after initially gapping up for a new 52-week high, the mid-day report cautioned - "Reported earnings +20% on +33% sales revenues for the Dec '12 quarter, below the +25% minimum earnings guideline (C criteria) raising fundamental concerns." See the latest FSU analysis for more details and a new annotated graph.
>>> The latest Featured Stock Update with an annotated graph appeared on 2/5/2013. Click here.
View all notes |
Alert me of new notes |
CANSLIM.net Company Profile |
SEC |
Zacks Reports |
StockTalk |
News |
Chart |
Request a new note
C
A N
S L
I M
|
NP
-
NYSE
Neenah Paper Inc
CONSUMER NON-DURABLES - Paper and Paper Products
|
$29.53
|
-0.79
-2.61% |
$30.45
|
72,316
92.24% of 50 DAV
50 DAV is 78,400
|
$32.57
-9.33%
|
1/25/2013
|
$31.80
|
PP = $31.76
|
|
MB = $33.35
|
Most Recent Note - 2/7/2013 5:31:18 PM
Y - Slumped further below its pivot point with today's 4th consecutive loss, closing near its 50 DMA line defining important chart support. A "negative reversal" for a loss on heavy volume after hitting a new 52-week high on 1/25/13 was noted as a worrisome sign of distributional pressure as it failed to finish strong and did not clinch a technical buy signal.
>>> The latest Featured Stock Update with an annotated graph appeared on 1/25/2013. Click here.
View all notes |
Alert me of new notes |
CANSLIM.net Company Profile |
SEC |
Zacks Reports |
StockTalk |
News |
Chart |
Request a new note
C
A N
S L
I M
|
NSR
-
NYSE
Neustar Inc
TELECOMMUNICATIONS - Diversified Communication Serv
|
$46.53
|
-0.54
-1.15% |
$47.24
|
345,668
77.24% of 50 DAV
50 DAV is 447,500
|
$47.07
-1.15%
|
12/11/2012
|
$41.85
|
PP = $41.41
|
|
MB = $43.48
|
Most Recent Note - 2/6/2013 12:33:30 PM
G - Today's volume-driven gain helped it touch another new 52-week high, getting more extended from its prior base. Its 50 DMA line (now $42.69)defines near-term support above its prior base.
>>> The latest Featured Stock Update with an annotated graph appeared on 2/1/2013. Click here.
View all notes |
Alert me of new notes |
CANSLIM.net Company Profile |
SEC |
Zacks Reports |
StockTalk |
News |
Chart |
Request a new note
C
A N
S L
I M
|
RAX
-
NYSE
Rackspace Hosting Inc
INTERNET - Internet Software and; Services
|
$73.11
|
-2.01
-2.68% |
$75.19
|
2,254,757
193.33% of 50 DAV
50 DAV is 1,166,300
|
$81.36
-10.14%
|
12/18/2012
|
$71.88
|
PP = $70.10
|
|
MB = $73.61
|
Most Recent Note - 2/7/2013 5:21:20 PM
G - Damaging loss today with almost 2 times average volume raised concerns and led to a close testing important chart support at an upward trendline and its 50 DMA line. Recently noted with caution - "It is extended from the previously noted base. Company will announce its fourth quarter 2012 financial results on Tuesday, February 12, 2013 after the close." See the latest FSU analysis for more details and a new annotated graph.
>>> The latest Featured Stock Update with an annotated graph appeared on 2/6/2013. Click here.
View all notes |
Alert me of new notes |
CANSLIM.net Company Profile |
SEC |
Zacks Reports |
StockTalk |
News |
Chart |
Request a new note
C
A N
S L
I M
|
RNF
-
NYSE
Rentech Nitrogen Ptnr Lp
CHEMICALS - Agricultural Chemicals
|
$47.48
|
-0.32
-0.67% |
$48.40
|
380,403
121.34% of 50 DAV
50 DAV is 313,500
|
$49.18
-3.46%
|
11/1/2012
|
$39.11
|
PP = $40.15
|
|
MB = $42.16
|
Most Recent Note - 2/5/2013 3:47:45 PM
G - Retreating from its 52-week high today with its 2nd loss on above average volume in the span of 3 sessions, a sign it is encountering more distributional pressure. Previously noted - "Extended from its prior base. Prior highs and 50 DMA line coincide near $41 defining important chart support to watch on pullbacks."
>>> The latest Featured Stock Update with an annotated graph appeared on 1/24/2013. Click here.
View all notes |
Alert me of new notes |
CANSLIM.net Company Profile |
SEC |
Zacks Reports |
StockTalk |
News |
Chart |
Request a new note
C
A N
S L
I M
|
Symbol/Exchange
Company Name
Industry Group |
PRICE |
CHANGE
(%Change) |
Day High |
Volume
(% DAV)
(% 50 day avg vol) |
52 Wk Hi
% From Hi |
Featured
Date |
Price
Featured |
Pivot Featured |
|
Max Buy |
VRX
-
NYSE
Valeant Pharmaceuticals
DRUGS - Drug Manufacturers - Other
|
$67.24
|
+0.33
0.49% |
$67.25
|
689,491
44.64% of 50 DAV
50 DAV is 1,544,500
|
$67.65
-0.61%
|
12/20/2012
|
$60.24
|
PP = $61.21
|
|
MB = $64.27
|
Most Recent Note - 2/4/2013 6:35:07 PM
G - Retreated from its 52-week high with higher (near average) volume behind today's loss. It is extended from its prior base, and its 50 DMA coincides with prior highs near $61 defining near-term chart support to watch on pullbacks.
>>> The latest Featured Stock Update with an annotated graph appeared on 1/28/2013. Click here.
View all notes |
Alert me of new notes |
CANSLIM.net Company Profile |
SEC |
Zacks Reports |
StockTalk |
News |
Chart |
Request a new note
C
A N
S L
I M
|
|
|
|
THESE ARE NOT BUY RECOMMENDATIONS!
Comments contained in the body of this report are technical
opinions only. The material herein has been obtained
from sources believed to be reliable and accurate, however,
its accuracy and completeness cannot be guaranteed.
This site is not an investment advisor, hence it does
not endorse or recommend any securities or other investments.
Any recommendation contained in this report may not
be suitable for all investors and it is not to be deemed
an offer or solicitation on our part with respect to
the purchase or sale of any securities. All trademarks,
service marks and trade names appearing in this report
are the property of their respective owners, and are
likewise used for identification purposes only.
This report is a service available
only to active Paid Premium Members.
You may opt-out of receiving report notifications
at any time. Questions or comments may be submitted
by writing to Premium Membership Services 665 S.E. 10 Street, Suite 201 Deerfield Beach, FL 33441-5634 or by calling 1-800-965-8307
or 954-785-1121.
|
|
|

