You are not logged in.
This means you
CAN ONLY VIEW reports that were published prior to Monday, April 14, 2025.
You
MUST UPGRADE YOUR MEMBERSHIP if you want to see any current reports.
AFTER MARKET UPDATE - FRIDAY, FEBRUARY 5TH, 2010
Previous After Market Report Next After Market Report >>>
|
|
|
|
DOW |
+10.05 |
10,012.23 |
+0.10% |
|
Volume |
1,562,238,770 |
+5% |
|
Volume |
2,883,650,300 |
-0% |
|
NASDAQ |
+15.69 |
2,141.12 |
+0.74% |
|
Advancers |
1,317 |
42% |
|
Advancers |
1,462 |
52% |
|
S&P 500 |
+3.08 |
1,066.19 |
+0.29% |
|
Decliners |
1,747 |
55% |
|
Decliners |
1,227 |
44% |
|
Russell 2000 |
+3.30 |
592.98 |
+0.56% |
|
52 Wk Highs |
19 |
|
|
52 Wk Highs |
14 |
|
|
S&P 600 |
+1.25 |
315.33 |
+0.40% |
|
52 Wk Lows |
26 |
|
|
52 Wk Lows |
46 |
|
|
 |
Major Averages Overcame Intra-day Losses To Close With Small Gains
Adam Sarhan, Contributing Writer,
Stocks got smacked for the fourth consecutive week as the dollar rallied and fears spread that the economic recovery may slow. Volume was heavier than the prior session on the NYSE and near the prior session total on the Nasdaq exchange. Decliners led advancers narrowly on the NYSE while advancers slightly outnumbered decliners on the Nasdaq exchange. There were only 3 high-ranked companies from the CANSLIM.net Leaders List that made a new 52-week high and appeared on the CANSLIM.net BreakOuts Page, lower than the 10 issues that appeared on the prior session. New 52-week lows outnumbered new 52-week highs on the NYSE and also on the Nasdaq exchange for the first time in many weeks.
Stocks rallied on Monday continuing the recent string of a strong start to the week before the bears show up and send stocks lower by Friday. This week was no exception. Stocks rose on Monday after several strong manufacturing reports in the US, Europe and China were released. The Institute for Supply Management said that US manufacturing enjoyed its largest gain since August 2004 which was a welcomed sign. On Tuesday, stocks and commodities rallied as the dollar fell after healthy news from the ailing housing front was released and the Australian central bank unexpectedly left interest rates steady.
Stocks ended mixed on Wednesday, after the ADP said US employers cut -22,000 jobs last month which matched forecasts and the ISM said its non manufacturing index (a.k.a service-index) rose to 50.5, which signaled growth but trailed estimates. Readings above 50 suggest growth while reading below 50 indicate contraction. Even though the number topped 50, it trailed estimates which led many to question the health of this recovery.
The three day rally attempt abruptly ended on Thursday when all of the major averages took out Monday's lows on heavy volume. Both stocks and commodities got smacked as the dollar rallied after concern spread that the global economic recovery may slow. Before Thursday's opening bell, the Labor Department reported that US jobless claims unexpectedly rose last week and concern spread that growing sovereign debt may derail the recovery. The euro plunged to its lowest level since May 2009 as the dollar soared well above its longer term 200 day moving average line. Lackluster bond auctions in Portugal and Spain triggered the sell off and led many to question the underlying health of the European Union. In other news, the European Central Bank (ECB) held rates steady at a record low of 1%. ECB president Jean-Claude Trichet said he is "confident" that Greece is moving in the right direction as it tries to curb its ballooning deficit but did not address the broader concerns.
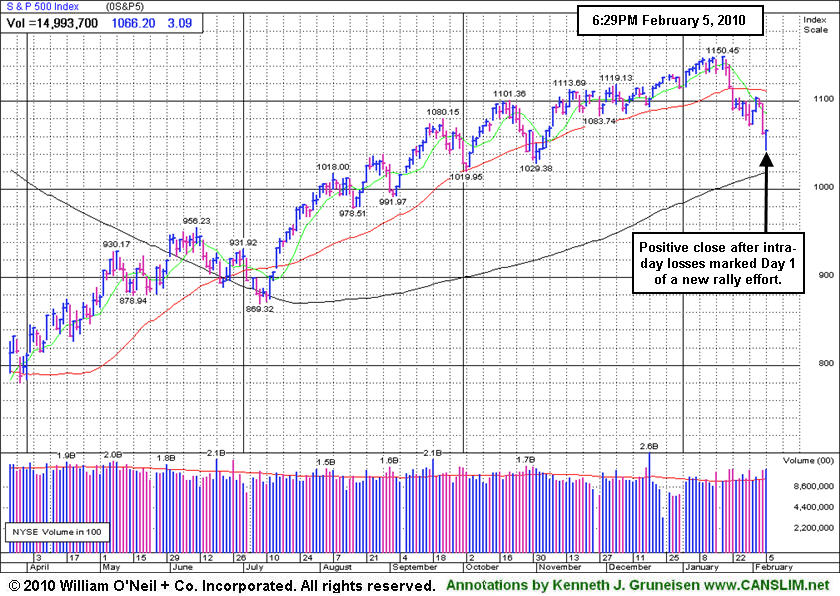
Stocks overcame intra-day losses and ended with small gains on Friday after the Labor Department said US employers cut -22,000 jobs in January and issued its annual benchmark update. The latest data shows that since the recession began in 2007, the country shed a whopping 8.4 million jobs which topped the prior estimate of just over 7 million. On the earnings front, so far, over half of the companies in the S&P 500 have released their Q4 results and nearly 80% of those companies have topped estimates. Barring some unforeseen event, the S&P 500 will snap a record nine-quarter earnings slump as earnings are expected to have grown +76% in the last three months of 2009 as the global economy continues to rebound from its worst recession since WWII! However, the fact that the market and most leading stocks experienced sharp losses since earnings season began suggests large investors are clearly concerned.
Looking at the market, Thursday's ominous action took out Monday's lows and effectively ended the brief rally attempt, which suggested a steeper correction may unfold and reset the day count for a proper follow-through day to emerge. It is also important to see how the major averages react to their respective 50-day moving average (DMA) lines which were support and are now resistance. Until they all close above that important level the technical damage remaining on the charts is a concern. So far, the market's reaction has been tepid at best to the latest round of economic and earnings data. Remember that the recent series of distribution days coupled with the deleterious action in the major averages suggests large institutions are aggressively selling stocks. Disciplined investors will now wait for a new follow-through day to be produced before resuming any buying efforts. Until then, patience is paramount.
Professional Money Management Services - A Winning System - Inquire today!
Our skilled team of portfolio managers knows how to follow the rules of this fact-based investment system. We do not follow opinion or the "conviction list" of some large Wall Street institution which would have us fully invested even during horrific bear markets. Instead, we remain fluid and only buy the best stocks when they are triggering proper technical buy signals. If you are not completely satisfied with the way your portfolio is being managed, Click here to submit your inquiry. *Accounts over $250,000 please. ** Serious inquires only, please.
PICTURED: The benchmark S&P 500 Index overcame intra-day weakness and closed with a gain which marks Day 1 of another new rally effort.
|
|
|
 |
Consolidation Above Prior Highs While Market Correction Continues
Kenneth J. Gruneisen - Passed the CAN SLIM® Master's Exam
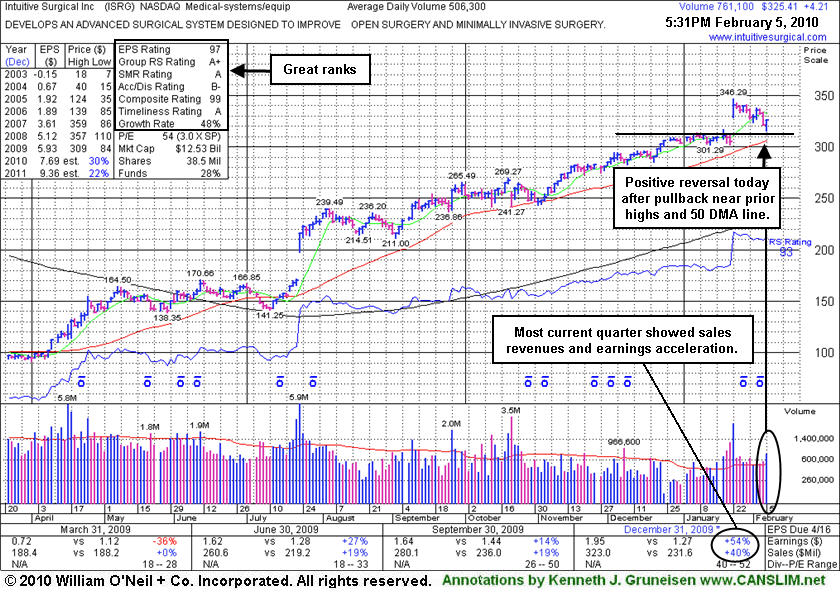
Intuitive Surgical Inc. (ISRG +$4.21 or +1.31% to $325.41) positively reversed for a gain today on above average volume after pulling back near its prior chart highs and 50-day moving average (DMA) line intra-day. That area defines an important chart support level now, where any deeper losses would raise more serious concerns. ISRG was featured again most recently in the 1/22/10 mid-day report (read here), returning after some time off the Featured Stocks list. More detailed analysis the evening of 1/22/10 appeared under the headline "Breakaway Gap Prompts Return To Featured Stocks Page" as an annotated graph illustrated its "breakaway gap" to a new 52-week high following 4-weeks of tight consolidation. It had just reported accelerating sales revenues and earnings increases for the period ended Dec 31, 2009, making its turnaround story all the more impressive.
Breakaway gaps were noted previously as, "a rare exception in which chasing a stock as much as +10% above prior highs is permitted under the investment system's guidelines" while we went on to say that "patience may allow investors to accumulate shares on ordinary pullbacks toward recent chart highs." Its recent consolidation has taken it down to within less than +5% of its prior highs. The heavier volume behind the latest gain indicates institutional (the I criteria) support and accumulation. Keep in mind that distribution days have recently been hurting the market outlook (M criteria), and 3 out of 4 stocks are likely to follow the direction of the major averages. Always limit losses by selling any stock that falls more than -7% from your purchase price, following Rule #1 of the investment system - keep your losses small!
Its annual earnings history (the A criteria) has been very impressive. Although quarterly comparisons have not shown perfectly steady increases above the +25% guideline, the latest period ended December 31, 2009 showed an impressive acceleration in sales revenues and earnings growth. ISRG rebounded impressively from its March low ($84.86) and may be on course for its all-time high ($359 in 2007). Notes outlined technical deterioration before and when it was last dropped from the Featured Stocks list on 6/10/08. ISRG traded up more than 13-fold since first featured in yellow in CANSLIM.net reports in the summer of 2004.
| Oil Services |
$OSX |
189.73 |
-1.38 |
-0.72% |
-2.66% |
| Healthcare |
$HMO |
1,409.63 |
-7.02 |
-0.50% |
-4.30% |
| Integrated Oil |
$XOI |
998.28 |
-3.20 |
-0.32% |
-6.55% |
| Semiconductor |
$SOX |
320.01 |
+7.48 |
+2.39% |
-11.09% |
| Networking |
$NWX |
223.19 |
+0.90 |
+0.40% |
-3.41% |
| Internet |
$IIX |
219.36 |
+1.82 |
+0.84% |
-6.20% |
| Broker/Dealer |
$XBD |
110.15 |
+1.37 |
+1.26% |
-4.26% |
| Retail |
$RLX |
392.84 |
+0.65 |
+0.17% |
-4.45% |
| Gold & Silver |
$XAU |
154.25 |
+7.83 |
+5.35% |
-8.32% |
| Bank |
$BKX |
44.80 |
+0.59 |
+1.33% |
+4.89% |
| Biotech |
$BTK |
966.86 |
-6.40 |
-0.66% |
+2.62% |
|
|
|
 |
Consolidation Above Prior Highs While Market Correction Continues
Kenneth J. Gruneisen - Passed the CAN SLIM® Master's Exam
Intuitive Surgical Inc. (ISRG +$4.21 or +1.31% to $325.41) positively reversed for a gain today on above average volume after pulling back near its prior chart highs and 50-day moving average (DMA) line intra-day. That area defines an important chart support level now, where any deeper losses would raise more serious concerns. ISRG was featured again most recently in the 1/22/10 mid-day report (read here), returning after some time off the Featured Stocks list. More detailed analysis the evening of 1/22/10 appeared under the headline "Breakaway Gap Prompts Return To Featured Stocks Page" as an annotated graph illustrated its "breakaway gap" to a new 52-week high following 4-weeks of tight consolidation. It had just reported accelerating sales revenues and earnings increases for the period ended Dec 31, 2009, making its turnaround story all the more impressive.
Breakaway gaps were noted previously as, "a rare exception in which chasing a stock as much as +10% above prior highs is permitted under the investment system's guidelines" while we went on to say that "patience may allow investors to accumulate shares on ordinary pullbacks toward recent chart highs." Its recent consolidation has taken it down to within less than +5% of its prior highs. The heavier volume behind the latest gain indicates institutional (the I criteria) support and accumulation. Keep in mind that distribution days have recently been hurting the market outlook (M criteria), and 3 out of 4 stocks are likely to follow the direction of the major averages. Always limit losses by selling any stock that falls more than -7% from your purchase price, following Rule #1 of the investment system - keep your losses small!
Its annual earnings history (the A criteria) has been very impressive. Although quarterly comparisons have not shown perfectly steady increases above the +25% guideline, the latest period ended December 31, 2009 showed an impressive acceleration in sales revenues and earnings growth. ISRG rebounded impressively from its March low ($84.86) and may be on course for its all-time high ($359 in 2007). Notes outlined technical deterioration before and when it was last dropped from the Featured Stocks list on 6/10/08. ISRG traded up more than 13-fold since first featured in yellow in CANSLIM.net reports in the summer of 2004.
|
|
|
Color Codes Explained :
Y - Better candidates highlighted by our
staff of experts.
G - Previously featured
in past reports as yellow but may no longer be buyable under the
guidelines.
***Last / Change / Volume quote data in this table corresponds with the timestamp on the note***
Symbol/Exchange
Company Name
Industry Group |
Last |
Chg. |
Vol
% DAV |
Date Featured |
Price Featured |
Latest Pivot Point
Featured |
Status |
| Latest Max Buy Price |
ARST
-
|
$23.86
|
+0.93
|
536,237
111% DAV
484,800
|
12/22/2009
(Date
Featured) |
$25.94
(Price
Featured) |
PP = $27.20 |
G |
| MB = $28.56 |
Most Recent Note - 2/5/2010 5:15:02 PM
G - Gain today with average volume, rallying back after sinking near its December lows and toward its 200 DMA line. It would need to rebound above its 50 DMA line for its outlook to improve. ARST was first featured in yellow at $19.91 in the 9/01/09 mid-day report with an annotated daily graph (read here).
>>> The latest Featured Stock Update with an annotated graph appeared on 2/4/2010. click here.
|
|
C
A
S
I |
News |
Chart |
SEC
View all notes Alert
me of new notes
Company
Profile
|
BIDU
- NASDAQ
Baidu Inc Ads
INTERNET - Internet Information Providers
|
$448.80
|
+7.94
|
1,778,375
97% DAV
1,825,500
|
1/13/2010
(Date
Featured) |
$431.25
(Price
Featured) |
PP = $426.75 |
G |
| MB = $448.09 |
Most Recent Note - 2/5/2010 5:17:41 PM
G - Holding its ground near all-time highs, consolidating above its 50 DMA line and its prior chart highs. Due to report earnings after the close on February 9th.
>>> The latest Featured Stock Update with an annotated graph appeared on 2/3/2010. click here.
|
|
C
A
S
I |
News |
Chart |
SEC
View all notes Alert
me of new notes
Company
Profile
|
CACC
- NASDAQ
Credit Acceptance Corp
FINANCIAL SERVICES - Credit Services
|
$42.79
|
-1.21
|
65,634
113% DAV
58,200
|
9/29/2009
(Date
Featured) |
$33.48
(Price
Featured) |
PP = $37.10 |
G |
| MB = $38.96 |
Most Recent Note - 2/5/2010 5:21:03 PM
G - After reporting earnings it traded down today for its 5th consecutive loss. The high-ranked Financial firm closed near its 50 DMA line.
>>> The latest Featured Stock Update with an annotated graph appeared on 1/28/2010. click here.
|
|
C
A
S
I |
News |
Chart |
SEC
View all notes Alert
me of new notes
Company
Profile
|
CRM
- NYSE
Salesforce.com Inc
INTERNET - Internet Software & Services
|
$62.08
|
-0.35
|
3,110,181
172% DAV
1,805,900
|
12/18/2009
(Date
Featured) |
$67.32
(Price
Featured) |
PP = $67.82 |
G |
| MB = $71.21 |
Most Recent Note - 2/5/2010 5:24:37 PM
G - Started weak then rebounded to finish near the session high today. Distributional pressure led to a breach of its recent chart lows in the $63 area while recent gains lacked volume. It would need to rebound above its 50 DMA line for its outlook to improve.
>>> The latest Featured Stock Update with an annotated graph appeared on 1/27/2010. click here.
|
|
C
A
S
I |
News |
Chart |
SEC
View all notes Alert
me of new notes
Company
Profile
|
GMCR
- NASDAQ
Green Mtn Coffee Roastrs
FOOD & BEVERAGE - Processed & Packaged Goods
|
$82.60
|
-0.08
|
1,012,899
67% DAV
1,520,100
|
12/28/2009
(Date
Featured) |
$77.49
(Price
Featured) |
PP = $76.50 |
G |
| MB = $80.33 |
Most Recent Note - 2/5/2010 5:26:24 PM
G - Started weak but rebounded to finish near the session high today. Consolidating near its all-time highs, while recent chart lows in the $78 area are an important support level to watch now.
>>> The latest Featured Stock Update with an annotated graph appeared on 2/2/2010. click here.
|
|
C
A
S
I |
News |
Chart |
SEC
View all notes Alert
me of new notes
Company
Profile
|
ISRG
- NASDAQ
Intuitive Surgical Inc
HEALTH SERVICES - Medical Appliances & Equipment
|
$325.41
|
+4.21
|
772,664
153% DAV
506,300
|
1/22/2010
(Date
Featured) |
$340.40
(Price
Featured) |
PP = $314.00 |
G |
| MB = $329.70 |
Most Recent Note - 2/5/2010 5:37:15 PM
G - Positively reversed for a gain on above average volume after pulling back near its prior chart highs and 50 DMA line intra-day. ISRG was featured again most recently in the 1/22/10 mid-day report (read here), returning after some time off the Featured Stocks list. Its annual earnings history (the A criteria) has been very impressive. ISRG has rebounded impressively from its March low ($84.86) and may be on course for its all-time high ($359 in 2007). Notes outlined technical deterioration before and when it was last dropped from the Featured Stocks list on 6/10/08. ISRG traded up more than 13-fold since first featured in yellow in CANSLIM.net reports in the summer of 2004.
>>> The latest Featured Stock Update with an annotated graph appeared on 2/5/2010. click here.
|
|
C
A
S
I |
News |
Chart |
SEC
View all notes Alert
me of new notes
Company
Profile
|
PEGA
- NASDAQ
Pegasystems Inc
COMPUTER SOFTWARE & SERVICES - Business Software & Services
|
$34.75
|
-0.83
|
411,274
221% DAV
186,000
|
1/4/2010
(Date
Featured) |
$34.00
(Price
Featured) |
PP = $36.19 |
G |
| MB = $38.00 |
Most Recent Note - 2/5/2010 5:40:26 PM
G - Down today for a 3rd consecutive loss on ever-increasing and above average volume. Wider than usual intra-day price swings in the past 2 weeks were noted as signs of uncertainty. Found support at its 50 DMA line after 2 big losses completely negated its 1/27/10 breakout. Its recent chart lows near $32.50 help define important technical support, where violations would trigger more worrisome sell signals. Negative market conditions (M criteria) are currently an overriding concern prompting great caution, since a follow-through day is still needed to confirm a new rally. After a hiatus from the Featured Stocks list, PEGA was featured again in the January 2010 issue of CANSLIM.net News (read here).
>>> The latest Featured Stock Update with an annotated graph appeared on 1/25/2010. click here.
|
|
C
A
S
I |
News |
Chart |
SEC
View all notes Alert
me of new notes
Company
Profile
|
|
|
|
THESE ARE NOT BUY RECOMMENDATIONS!
Comments contained in the body of this report are technical
opinions only. The material herein has been obtained
from sources believed to be reliable and accurate, however,
its accuracy and completeness cannot be guaranteed.
This site is not an investment advisor, hence it does
not endorse or recommend any securities or other investments.
Any recommendation contained in this report may not
be suitable for all investors and it is not to be deemed
an offer or solicitation on our part with respect to
the purchase or sale of any securities. All trademarks,
service marks and trade names appearing in this report
are the property of their respective owners, and are
likewise used for identification purposes only.
This report is a service available
only to active Paid Premium Members.
You may opt-out of receiving report notifications
at any time. Questions or comments may be submitted
by writing to Premium Membership Services 665 S.E. 10 Street, Suite 201 Deerfield Beach, FL 33441-5634 or by calling 1-800-965-8307
or 954-785-1121.
|
|
|


