You are not logged in.
This means you
CAN ONLY VIEW reports that were published prior to Monday, April 14, 2025.
You
MUST UPGRADE YOUR MEMBERSHIP if you want to see any current reports.
AFTER MARKET UPDATE - TUESDAY, FEBRUARY 4TH, 2014
Previous After Market Report Next After Market Report >>>
|
|
|
|
DOW |
+72.44 |
15,445.24 |
+0.47% |
|
Volume |
820,210,520 |
-9% |
|
Volume |
2,015,345,090 |
-17% |
|
NASDAQ |
+34.28 |
4,031.24 |
+0.86% |
|
Advancers |
2,087 |
66% |
|
Advancers |
1,625 |
60% |
|
S&P 500 |
+13.31 |
1,755.20 |
+0.76% |
|
Decliners |
980 |
31% |
|
Decliners |
975 |
36% |
|
Russell 2000 |
+8.26 |
1,102.84 |
+0.75% |
|
52 Wk Highs |
19 |
|
|
52 Wk Highs |
30 |
|
|
S&P 600 |
+4.05 |
624.31 |
+0.65% |
|
52 Wk Lows |
64 |
|
|
52 Wk Lows |
47 |
|
|
 |
Major Averages Tallied Gains on Lighter Volume Totals
Kenneth J. Gruneisen - Passed the CAN SLIM® Master's Exam
Stocks rose on Tuesday's session. The volume totals was reported lighter than the prior trading session's volume totals on the Nasdaq exchange and on the NYSE, a sign that institutional investors were not aggressively buying shares. Breadth was positive as advancers led decliners by more than a 2-1 ratio on the NYSE and by more than 3-2 on the Nasdaq exchange. There were only 3 high-ranked companies from the CANSLIM.net Leaders List that made new 52-week highs and appeared on the CANSLIM.net BreakOuts Page, down from the total of 7 stocks on the prior session. The list of stocks hitting new 52-week lows outnumbered new 52-week highs on the Nasdaq exchange and on the NYSE. There were gains for all of the 13 high-ranked companies currently included on the Featured Stocks Page, a list that has recently been waning. The Market (M criteria) has encountered distributional pressure and leadership (stocks hitting new highs) has waned, earning the label of being in another "correction". Such weakness serves as a reminder for investors to use caution and remain disciplined in following proper sell rules under the fact-based investment system to reduce market exposure.
The major averages staged a rebound from Monday's biggest one-day decline since June attributed to bargain hunting and positive earnings releases. Michael Kors (KORS +17.27%) jumped after posting quarterly results above consensus and raising its full-year outlook. Yum Brands (YUM +8.92%) rose as profits and international sales topped projections. Shares of Archer Daniels Midland (ADM -1.75%) slipped after revenues came in below estimates.
The latest economic data showed factory orders fell less-than-expected in December. On the Fed front, Richmond President Jeffrey Lacker said the decline in global markets is unlikely to keep the central bank from reducing its asset purchases further.
Nine of 10 sectors in the S&P 500 were up on the session. Health care was the best performing group as Gilead Sciences (GILD +4.05%) and Pfizer (PFE +2.75%) rallied. Over in tech, Twitter (TWTR +1.64%) edged higher ahead of its first quarterly earnings report Wednesday. Utilities were the lone sector in negative territory with Dominion Resources (D -1.89%) down.
Treasuries snapped a three-day winning streak. The benchmark 10-year note was down 12/32 to yield 2.62%.
Investors should be watchful for any individual issues flashing technical sell signals. The CANSLIM.net Featured Stocks Page shows the most action-worthy candidates and their latest notes and a Headline Link directs members to the latest detailed analysis with data-packed graphs annotated by a Certified expert along with links to additional resources. The Premium Member Homepage includes "dynamic archives" to all prior pay reports published. Watch for an announcement via email concerning the next WEBCAST.
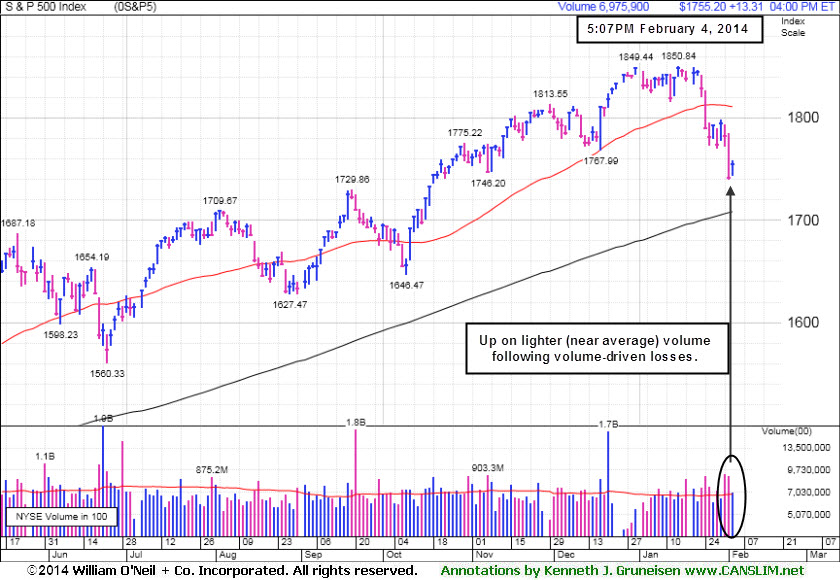
PICTURED: The S&P 500 Index posted a gain on lighter (near average) volume following damaging volume-driven losses. Its 50-day moving average (DMA) line is now downward sloping. A rebound above the 50 DMA line would be an encouraging sign, but for now it has a lot of work to do to reclaim lost ground. Meanwhile, its 200 DMA line defines the next important support level.
|
 Kenneth J. Gruneisen started out as a licensed stockbroker in August 1987, a couple of months prior to the historic stock market crash that took the Dow Jones Industrial Average down -22.6% in a single day. He has published daily fact-based fundamental and technical analysis on high-ranked stocks online for two decades. Through FACTBASEDINVESTING.COM, Kenneth provides educational articles, news, market commentary, and other information regarding proven investment systems that work in good times and bad.
Comments contained in the body of this report are technical opinions only and are not necessarily those of Gruneisen Growth Corp. The material herein has been obtained from sources believed to be reliable and accurate, however, its accuracy and completeness cannot be guaranteed. Our firm, employees, and customers may effect transactions, including transactions contrary to any recommendation herein, or have positions in the securities mentioned herein or options with respect thereto. Any recommendation contained in this report may not be suitable for all investors and it is not to be deemed an offer or solicitation on our part with respect to the purchase or sale of any securities. |
|
 |
Financial Groups Among Influential Gainers
Kenneth J. Gruneisen - Passed the CAN SLIM® Master's Exam
Financial shares were a positive influence on the major averages on Tuesday as the Broker/Dealer Index ($XBD +1.63%) and the Bank Index ($BKX +1.04%) both rose. The Networking Index ($NWX +1.77%) led the tech sector while the Biotechnology Index ($BTK +0.65%) and the Semiconductor Index ($SOX +0.17%) posted smaller gains. The Retail Index ($RLX +0.27%) also edged higher. Commodity-linked groups had a positive bias as the Oil Services Index ($OSX +1.06%) outpaced the Integrated Oil Index ($XOI +0.28%) and the Gold & Silver Index ($XAU +0.69%).
Charts courtesy www.stockcharts.com
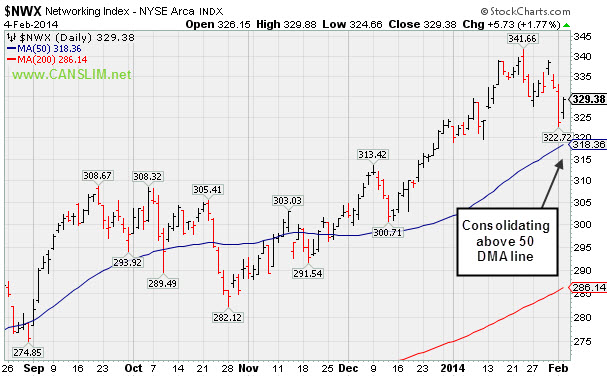
PICTURED: The Networking Index ($NWX +1.77%) is consolidating above its 50-day moving average (DMA) line.
| Oil Services |
$OSX |
262.75 |
+2.76 |
+1.06% |
-6.50% |
| Integrated Oil |
$XOI |
1,384.50 |
+3.82 |
+0.28% |
-7.89% |
| Semiconductor |
$SOX |
518.34 |
+0.88 |
+0.17% |
-3.12% |
| Networking |
$NWX |
329.38 |
+5.73 |
+1.77% |
+1.68% |
| Broker/Dealer |
$XBD |
150.69 |
+2.42 |
+1.63% |
-6.15% |
| Retail |
$RLX |
848.09 |
+2.32 |
+0.27% |
-9.76% |
| Gold & Silver |
$XAU |
90.55 |
+0.62 |
+0.69% |
+7.61% |
| Bank |
$BKX |
66.18 |
+0.68 |
+1.04% |
-4.45% |
| Biotech |
$BTK |
2,470.68 |
+16.04 |
+0.65% |
+6.02% |
|
|
|
 |
Slumped Into Prior Base Negating Breakout and Violated 50-Day Average
Kenneth J. Gruneisen - Passed the CAN SLIM® Master's Exam
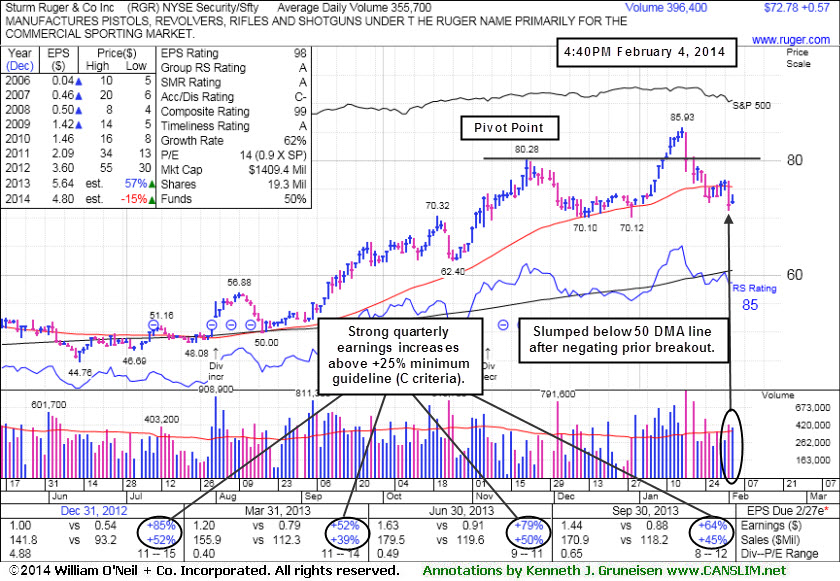
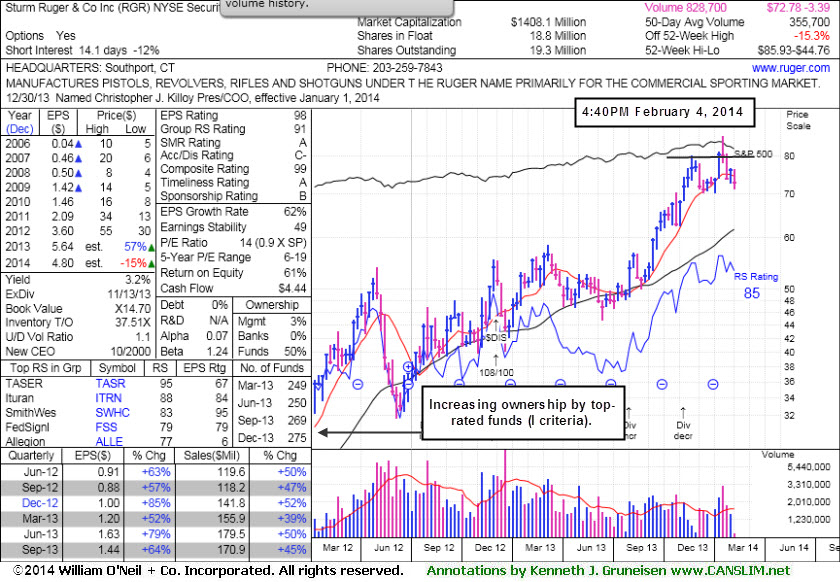
Sturm Ruger & Co Inc (RGR +$0.57 or +0.79% to $72.78) slumped further below its 50-day moving average (DMA) line on the prior session, enduring more worrisome distributional pressure. It recently negated the prior breakout and slumped back into the prior base raising concerns. Disciplined investors always limit losses if ever any stock falls more than -7% from where it was purchased. The Security/Safety firm now faces overhead supply up through the $85 level which may act as resistance. It made limited headway after last shown in this FSU section on 1/13/14 with an annotated graph under the headline, "Hit New Highs With 6th Consecutive Gain", as a solid gain above its pivot point was backed by +75% above average volume confirming a technical buy signal.
It reported earnings +64% on +45% sales revenues for the quarter ended September 30, 2013 versus the year ago period, the 10th consecutive quarterly comparison with a strong earnings increase well above the +25% minimum guideline (C criteria) backed by strong sales revenues growth. It also has a good annual earnings (A criteria) history. The number of top-rated funds owning its shares rose from 248 in Mar '13 to 275 in Dec '13, a slightly reassuring sign concerning the I criteria. Keep in mind that some mutual fund managers are also restricted by their fund family's rules from buying companies that make firearms, tobacco, or alcohol products.
See additional details in the article "Ken's Mailbag Q&A 12/10/12 - Challenges of when to lock in a profit or accumulate more shares".
|
|
|
Color Codes Explained :
Y - Better candidates highlighted by our
staff of experts.
G - Previously featured
in past reports as yellow but may no longer be buyable under the
guidelines.
***Last / Change / Volume data in this table is the closing quote data***
Symbol/Exchange
Company Name
Industry Group |
PRICE |
CHANGE
(%Change) |
Day High |
Volume
(% DAV)
(% 50 day avg vol) |
52 Wk Hi
% From Hi |
Featured
Date |
Price
Featured |
Pivot Featured |
|
Max Buy |
EGOV
-
NASDAQ
N I C Inc
INTERNET - Internet Software and Services
|
$21.55
|
+0.12
0.56% |
$21.77
|
269,566
106.51% of 50 DAV
50 DAV is 253,100
|
$25.99
-17.08%
|
12/20/2013
|
$24.00
|
PP = $26.09
|
|
MB = $27.39
|
 Most Recent Note - 2/4/2014 5:34:34 PM
Finding support near its 200 DMA line. Its Relative Strength (RS) rating has fallen to 65, below the 80+ minimum guideline for buy candidates. A rally above recent resistance in the $25-26 area is needed for its technical stance to turn bullish. It will be dropped from the Featured Stocks list tonight
>>> FEATURED STOCK ARTICLE : Relative Strength Rating Wanes While Slumping on Higher Volume - 1/28/2014
View all notes |
Set NEW NOTE alert |
CANSLIM.net Company Profile |
SEC
News |
Chart |
Request a new note
C
A N
S L
I M


|
EQM
-
NYSE
E Q T Midstream Partners
ENERGY - Oil and Gas Pipelines
|
$60.80
|
+0.30
0.50% |
$61.40
|
44,388
41.48% of 50 DAV
50 DAV is 107,000
|
$63.82
-4.73%
|
12/12/2013
|
$53.17
|
PP = $56.51
|
|
MB = $59.34
|
Most Recent Note - 1/31/2014 2:43:21 PM
G - Making gradual progress and stubbornly holding its ground, getting more extended from any sound base pattern. Prior highs in the $56 area define support to watch on pullbacks.
>>> FEATURED STOCK ARTICLE : Extended From Base After Six Consecutive Weekly Gains - 1/17/2014
View all notes |
Set NEW NOTE alert |
CANSLIM.net Company Profile |
SEC
News |
Chart |
Request a new note
C
A N
S L
I M
|
FB
-
NASDAQ
Facebook Inc Cl A
INTERNET
|
$62.75
|
+1.27
2.07% |
$63.14
|
45,968,011
71.88% of 50 DAV
50 DAV is 63,948,100
|
$63.77
-1.60%
|
12/12/2013
|
$51.40
|
PP = $54.93
|
|
MB = $57.68
|
Most Recent Note - 1/30/2014 12:40:38 PM
Y - Reported earnings +82% on +63% sales revenues for the Dec '13 quarter. Gapped up and hit a new 52-week high today after finding support at its 50 DMA line during its latest consolidation. Color code is changed to yellow. Market conditions argue against new buying efforts until a FTD from at least one of the major averages confirms a new rally. One may consider a valid secondary buy point from its successful test of the 10 week average up to +5% above the recent high ($59.31 on 1/22/14).
>>> FEATURED STOCK ARTICLE : Following New Offering Prior Highs Acted As Support - 1/15/2014
View all notes |
Set NEW NOTE alert |
CANSLIM.net Company Profile |
SEC
News |
Chart |
Request a new note
C
A N
S L
I M
|
JAZZ
-
NASDAQ
Jazz Pharmaceuticals Plc
DRUGS - Biotechnology
|
$147.28
|
+0.01
0.01% |
$150.00
|
1,072,434
137.46% of 50 DAV
50 DAV is 780,200
|
$159.14
-7.45%
|
9/30/2013
|
$93.20
|
PP = $89.10
|
|
MB = $93.56
|
Most Recent Note - 2/3/2014 6:34:37 PM
G - Retreating from its 52-week high with 2 consecutive losses on above average volume. Its 50 DMA line ($129.39 now) defines important support to watch on pullbacks.
>>> FEATURED STOCK ARTICLE : Very Extended From Sound Base Following Big Volume-Driven Gains - 1/14/2014
View all notes |
Set NEW NOTE alert |
CANSLIM.net Company Profile |
SEC
News |
Chart |
Request a new note
C
A N
S L
I M
|
KORS
-
NYSE
Michael Kors Hldgs Ltd
RETAIL - Apparel Stores
|
$89.91
|
+13.24
17.27% |
$93.18
|
23,021,278
548.41% of 50 DAV
50 DAV is 4,197,800
|
$84.58
6.30%
|
2/4/2014
|
$90.92
|
PP = $84.68
|
|
MB = $88.91
|
Most Recent Note - 2/4/2014 12:58:47 PM
Y - Breakaway gap today for new all-time highs followed strong earnings news for the Dec '13 quarter. Color code is changed to yellow with new pivot point cited based on its 12/19/13 high plus 10 cents. Considerable volume-driven gain has triggered a technical buy signal, however the broader market (M criteria) environment still argues for caution until at least one of the major averages produces a solid follow-through day of gains on higher volume.
>>> FEATURED STOCK ARTICLE : Down on Higher Volume Ahead of Quarterly Earnings Report - 2/3/2014
View all notes |
Set NEW NOTE alert |
CANSLIM.net Company Profile |
SEC
News |
Chart |
Request a new note
C
A N
S L
I M
|
Symbol/Exchange
Company Name
Industry Group |
PRICE |
CHANGE
(%Change) |
Day High |
Volume
(% DAV)
(% 50 day avg vol) |
52 Wk Hi
% From Hi |
Featured
Date |
Price
Featured |
Pivot Featured |
|
Max Buy |
MRLN
-
NASDAQ
Marlin Business Services
DIVERSIFIED SERVICES - Rental and Leasing Services
|
$24.92
|
+0.44
1.80% |
$25.24
|
22,979
71.81% of 50 DAV
50 DAV is 32,000
|
$29.58
-15.75%
|
12/19/2013
|
$26.69
|
PP = $28.74
|
|
MB = $30.18
|
Most Recent Note - 2/3/2014 1:17:48 PM
G - Color code is changed to green while slumping below its 50 DMA line raising more serious concerns. Disciplined investor always limit losses by selling any stock that falls more than -7% from their purchase price.
>>> FEATURED STOCK ARTICLE : Hovering Near 52-Week High Following Technical Breakout - 1/22/2014
View all notes |
Set NEW NOTE alert |
CANSLIM.net Company Profile |
SEC
News |
Chart |
Request a new note
C
A N
S L
I M
|
PCLN
-
NASDAQ
Priceline.Com Inc
INTERNET - Internet Software and Services
|
$1,126.12
|
+12.63
1.13% |
$1,128.83
|
552,968
93.52% of 50 DAV
50 DAV is 591,300
|
$1,214.97
-7.31%
|
12/18/2013
|
$1,156.20
|
PP = $1,198.85
|
|
MB = $1,258.79
|
Most Recent Note - 1/29/2014 5:57:38 PM
G - Slumped further below its 50 DMA line today with slightly higher volume. Prior low ($1,113.01 on 1/06/13) defines near-term support to watch. See the latest FSU analysis for more details and new annotated graphs.
>>> FEATURED STOCK ARTICLE : Violation of 50-Day Average After Failing to Trigger New Buy Signal - 1/29/2014
View all notes |
Set NEW NOTE alert |
CANSLIM.net Company Profile |
SEC
News |
Chart |
Request a new note
C
A N
S L
I M
|
RGR
-
NYSE
Sturm Ruger & Co Inc
CONSUMER DURABLES - Sporting Goods
|
$72.78
|
+0.57
0.79% |
$74.20
|
396,521
116.80% of 50 DAV
50 DAV is 339,500
|
$85.93
-15.30%
|
1/8/2014
|
$78.87
|
PP = $80.38
|
|
MB = $84.40
|
Most Recent Note - 2/4/2014 5:32:53 PM
G- Slumped further below its 50 DMA line with losses on higher volume after recently negating the prior breakout. Faces overhead supply up through the $85 level which may act as resistance. See the latest FSU analysis for more details and new annotated graphs.
>>> FEATURED STOCK ARTICLE : Slumped Into Prior Base Negating Breakout and Violated 50-Day Average - 2/4/2014
View all notes |
Set NEW NOTE alert |
CANSLIM.net Company Profile |
SEC
News |
Chart |
Request a new note
C
A N
S L
I M
|
SFUN
-
NYSE
Soufun Hldgs Ltd Ads A
INTERNET - Internet Information Providers
|
$79.34
|
+0.76
0.97% |
$80.24
|
1,084,352
92.65% of 50 DAV
50 DAV is 1,170,400
|
$95.39
-16.83%
|
10/17/2013
|
$58.02
|
PP = $53.87
|
|
MB = $56.56
|
Most Recent Note - 2/3/2014 6:33:16 PM
G - Fell just below its 50 DMA line with today's loss on slightly higher than average volume. More damaging losses would raise greater concerns. It is extended from any sound base.
>>> FEATURED STOCK ARTICLE : 50-Day Moving Average Defines Near Term Support After Great Rally - 1/31/2014
View all notes |
Set NEW NOTE alert |
CANSLIM.net Company Profile |
SEC
News |
Chart |
Request a new note
C
A N
S L
I M
|
SILC
-
NASDAQ
Silicom Ltd
COMPUTER HARDWARE - Networking andamp; Communication Dev
|
$62.28
|
+0.30
0.48% |
$62.60
|
41,354
120.22% of 50 DAV
50 DAV is 34,400
|
$63.91
-2.55%
|
12/23/2013
|
$44.62
|
PP = $46.25
|
|
MB = $48.56
|
Most Recent Note - 2/3/2014 12:42:58 PM
G - Still hovering near its 52-week high, extended from any sound base. Stubbornly holding its ground since a considerable gap up on 1/23/14 after reporting earnings +92% on +52% sales for the Dec '13 quarter, beating consensus estimates.
>>> FEATURED STOCK ARTICLE : Considerable Gap Up Following Strong Earnings Report - 1/23/2014
View all notes |
Set NEW NOTE alert |
CANSLIM.net Company Profile |
SEC
News |
Chart |
Request a new note
C
A N
S L
I M
|
Symbol/Exchange
Company Name
Industry Group |
PRICE |
CHANGE
(%Change) |
Day High |
Volume
(% DAV)
(% 50 day avg vol) |
52 Wk Hi
% From Hi |
Featured
Date |
Price
Featured |
Pivot Featured |
|
Max Buy |
SSNC
-
NASDAQ
S S & C Technologies
COMPUTER SOFTWARE and SERVICES - Application Software
|
$38.47
|
+0.63
1.66% |
$38.83
|
225,648
85.73% of 50 DAV
50 DAV is 263,200
|
$46.61
-17.46%
|
10/22/2013
|
$39.17
|
PP = $40.04
|
|
MB = $42.04
|
Most Recent Note - 1/29/2014 3:12:07 PM
G- Gapped down today, raising greater concerns while slumping further below its 50 DMA line with above average volume behind its damaging 4th consecutive loss. A rebound above the 50 DMA line is needed for its outlook improve.
>>> FEATURED STOCK ARTICLE : Enduring Distributional Pressure While Retreating Near Prior Highs - 1/16/2014
View all notes |
Set NEW NOTE alert |
CANSLIM.net Company Profile |
SEC
News |
Chart |
Request a new note
C
A N
S L
I M
|
ULTI
-
NASDAQ
Ultimate Software Group
INTERNET - Internet Software and Services
|
$159.72
|
+2.31
1.47% |
$160.68
|
520,830
383.53% of 50 DAV
50 DAV is 135,800
|
$165.50
-3.49%
|
1/27/2014
|
$153.75
|
PP = $162.98
|
|
MB = $171.13
|
Most Recent Note - 2/4/2014 1:08:16 PM
Y - Consolidating above its 50 DMA line after retreating abruptly from its 52-week high with a "negative reversal" on the prior session. Prior gains confirmed a technical buy signal, yet recent reports cautioned members - "Broader market conditions (M criteria) argue for caution until at least one of the major averages produces a convincing follow through day of gains on higher volume."
>>> FEATURED STOCK ARTICLE : Forming New Base But Enduring Distributional Pressure - 1/27/2014
View all notes |
Set NEW NOTE alert |
CANSLIM.net Company Profile |
SEC
News |
Chart |
Request a new note
C
A N
S L
I M
|
VRX
-
NYSE
Valeant Pharmaceuticals
DRUGS - Drug Manufacturers - Other
|
$135.56
|
+2.20
1.65% |
$135.92
|
1,160,163
100.44% of 50 DAV
50 DAV is 1,155,100
|
$140.36
-3.42%
|
9/11/2013
|
$100.26
|
PP = $105.50
|
|
MB = $110.78
|
Most Recent Note - 2/4/2014 5:35:43 PM
G - Holding its ground perched near all-time highs, extended from any sound base. Its 50 DMA line ($120) defines near-term support to watch.
>>> FEATURED STOCK ARTICLE : Bullish Action Has Continued Despite Fundamental Concerns - 1/21/2014
View all notes |
Set NEW NOTE alert |
CANSLIM.net Company Profile |
SEC
News |
Chart |
Request a new note
C
A N
S L
I M
|
|
|
|
THESE ARE NOT BUY RECOMMENDATIONS!
Comments contained in the body of this report are technical
opinions only. The material herein has been obtained
from sources believed to be reliable and accurate, however,
its accuracy and completeness cannot be guaranteed.
This site is not an investment advisor, hence it does
not endorse or recommend any securities or other investments.
Any recommendation contained in this report may not
be suitable for all investors and it is not to be deemed
an offer or solicitation on our part with respect to
the purchase or sale of any securities. All trademarks,
service marks and trade names appearing in this report
are the property of their respective owners, and are
likewise used for identification purposes only.
This report is a service available
only to active Paid Premium Members.
You may opt-out of receiving report notifications
at any time. Questions or comments may be submitted
by writing to Premium Membership Services 665 S.E. 10 Street, Suite 201 Deerfield Beach, FL 33441-5634 or by calling 1-800-965-8307
or 954-785-1121.
|
|
|

