You are not logged in.
This means you
CAN ONLY VIEW reports that were published prior to Monday, April 14, 2025.
You
MUST UPGRADE YOUR MEMBERSHIP if you want to see any current reports.
AFTER MARKET UPDATE - FRIDAY, FEBRUARY 3RD, 2012
Previous After Market Report Next After Market Report >>>
|
|
|
|
DOW |
+155.46 |
12,860.87 |
+1.22% |
|
Volume |
905,308,980 |
+12% |
|
Volume |
2,083,988,270 |
+12% |
|
NASDAQ |
+45.98 |
2,905.66 |
+1.61% |
|
Advancers |
2,347 |
76% |
|
Advancers |
2,036 |
77% |
|
S&P 500 |
+19.25 |
1,344.80 |
+1.45% |
|
Decliners |
662 |
21% |
|
Decliners |
511 |
19% |
|
Russell 2000 |
+18.21 |
831.10 |
+2.24% |
|
52 Wk Highs |
299 |
|
|
52 Wk Highs |
252 |
|
|
S&P 600 |
+9.72 |
463.55 |
+2.14% |
|
52 Wk Lows |
4 |
|
|
52 Wk Lows |
14 |
|
|
 |
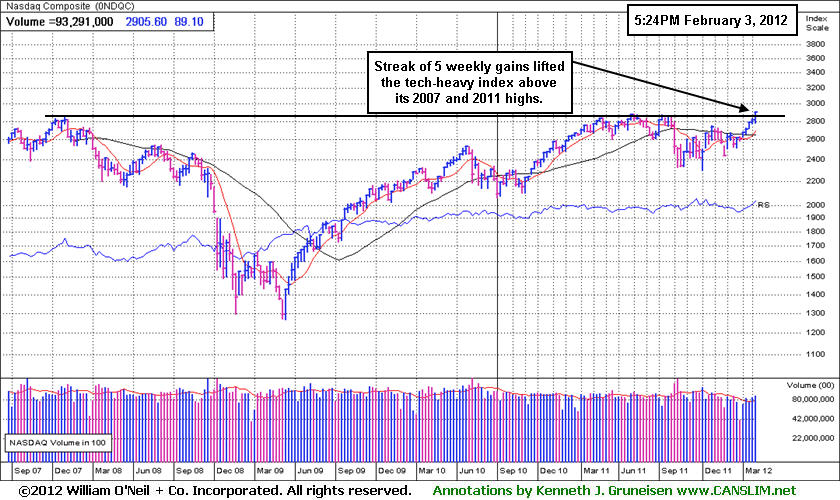
Small Cap Index Hits All-Time High; Nasdaq Tops '07 & '11 Highs
Kenneth J. Gruneisen - Passed the CAN SLIM® Master's Exam
For the week, the Dow Jones Industrial Average finished up +1.5%, the S&P 500 Index rose just over +2%, and the Nasdaq Composite Index was the outperformer, adding on over +3%. The volume totals on Friday were reported higher than the prior session on both the NYSE and on the Nasdaq exchange, indicating that institutional investors had an increased appetite for buying shares. Breadth on the exchanges was solidly positive as the NYSE and Nasdaq exchange both saw advancers leading decliners by about 4-1. Stocks hitting new 52-week highs trounced new 52-week lows on both exchanges. There were 156 high-ranked companies from the CANSLIM.net Leaders List that made new 52-week highs and appeared on the CANSLIM.net BreakOuts Page, surging well into the triple digits from the prior session total of 95 stocks. There were gains for 19 of the 23 high-ranked companies currently included on the Featured Stocks Page.
Wall Street capped off the week with an impressive rally. The S&P 500 Index extended its best start to a year since 1989 as positive employment data brought bids to risk assets. Non-farm payrolls in January increased 243,000, well above the consensus projection of 140,000, marking the largest gain since April of last year. In turn, the unemployment rate dropped to its lowest level since February 2009 at 8.3%. Meanwhile, an ISM report on non-manufacturing industries showed its best growth since February of 2011 and separately, factory orders increased +1.1% in December.
The Dow closed at its highest level in almost 3 1/2 years, and the Blue Chip index continued to be buoyed by large gains in financials as Bank of America (BAC +5.23%) and JP Morgan Chase & Co (JPM +1.94%) rallied. Shares of Estee Lauder Companies Inc (EL -2.33%) were down after providing disappointing third-quarter guidance. Acme Packet Inc (APKT +9.06%) managed a positive reversal following weak early action after earnings missed analyst projections. Insurance broker AON Inc (AON -2.65%) was off after reporting a slightly better than expected quarter. Brocade Communications Systems (BRCD +1.37%) gained amid reports private equity firm Blackstone may make a bid to acquire the company.
The further expansion in leadership (stocks making new 52-week highs) has maintained and improved the current confirmed market uptrend. As this commentary has repeated, the M criteria requires a healthy crop of strong leaders for any sustained market advance. While the market has recently produced a larger crop of stocks hitting new highs, it always remains important for investors to be selective in choosing high-ranked buy candidates while being disciplined and following sound rules for buying and selling.
The most timely stocks worthy of consideration under the fact-based system are included on the Featured Stocks Page. There members can drill down and review all prior analysis and annotated graphs via the links provided. Via the Premium Member Homepage links to all prior reports and webcasts are always available.
PICTURED 1: The Nasdaq Composite Index finished near an 11-year high as its streak of 5 weekly gains lifted the tech-heavy index above its 2007 and 2011 highs.
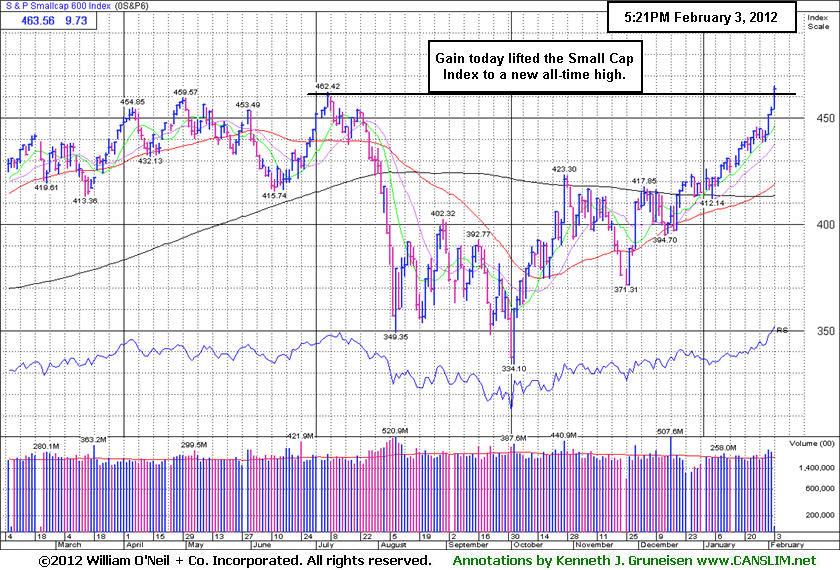
PICTURED 2: The S&P Small Cap 600 Index has rallied to a new all-time high. This news bodes well for fans of the fact-based system supported at CANSLIM.net, since our focus is on growth-oriented companies which typically are small-cap stocks.
|
 Kenneth J. Gruneisen started out as a licensed stockbroker in August 1987, a couple of months prior to the historic stock market crash that took the Dow Jones Industrial Average down -22.6% in a single day. He has published daily fact-based fundamental and technical analysis on high-ranked stocks online for two decades. Through FACTBASEDINVESTING.COM, Kenneth provides educational articles, news, market commentary, and other information regarding proven investment systems that work in good times and bad.
Comments contained in the body of this report are technical opinions only and are not necessarily those of Gruneisen Growth Corp. The material herein has been obtained from sources believed to be reliable and accurate, however, its accuracy and completeness cannot be guaranteed. Our firm, employees, and customers may effect transactions, including transactions contrary to any recommendation herein, or have positions in the securities mentioned herein or options with respect thereto. Any recommendation contained in this report may not be suitable for all investors and it is not to be deemed an offer or solicitation on our part with respect to the purchase or sale of any securities. |
|
 |
Strong Financials, and Tech, Retail, and Energy Groups Rise
Kenneth J. Gruneisen - Passed the CAN SLIM® Master's Exam
Financial shares helped spearhead Friday's bug gains for the major averages as the Bank Index ($BKX +3.28%) and Broker/Dealer Index ($XBD +3.52%) posted big gains. The Networking Index ($NWX +4.74%) led the tech sector, followed by the Semiconductor Index ($SOX +1.77%), Internet Index ($IIX +1.92%), and the Biotechnology Index ($BTK +0.84%). The Retail Index ($RLX +1.73%) rose, and strength in energy-related shares gave the Oil Services Index ($OSX +1.75%) and Integrated Oil Index ($XOI +2.10%) a solid boost. While investors showed a greater appetite for risk, defensive groups slumped again, with the Healthcare Index ($HMO -1.27%) and Gold & Silver Index ($XAU -1.18%) as the session's standout decliners.
Charts courtesy www.stockcharts.com
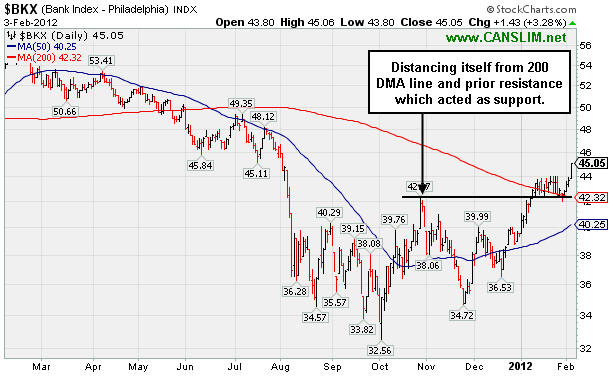
PICTURED 1: The Bank Index's ($BKX +3.28%) gain helped it distance itself from the 200-day moving average (DMA) line and prior resistance which now acted as support. Regular readers of this commentary should recognize that the continuation of bullish action recently noted in the financial group bodes very well for the broader market outlook. This is because the financial groups have established a reliable track record as leading indicators.
Charts courtesy www.stockcharts.com
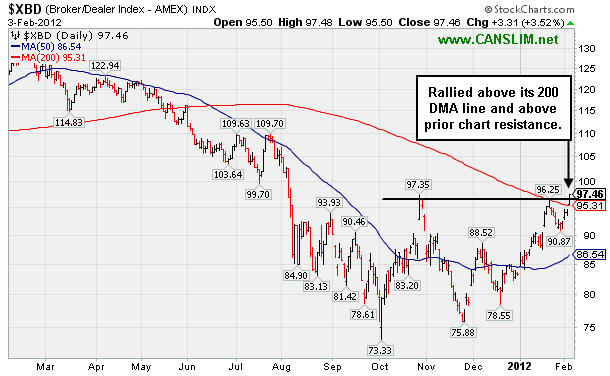
PICTURED 2: The Broker/Dealer Index's ($XBD +3.52%) gain helped it rally above its 200 DMA line and above prior resistance. Regular readers of this commentary should recognize that the continuation of bullish action recently noted in the financial group bodes very well for the broader market outlook. This is because the financial groups have established a reliable track record as leading indicators.
| Oil Services |
$OSX |
248.25 |
+4.27 |
+1.75% |
+14.78% |
| Healthcare |
$HMO |
2,532.36 |
-32.58 |
-1.27% |
+10.99% |
| Integrated Oil |
$XOI |
1,295.01 |
+26.65 |
+2.10% |
+5.36% |
| Semiconductor |
$SOX |
427.99 |
+7.43 |
+1.77% |
+17.44% |
| Networking |
$NWX |
257.79 |
+11.66 |
+4.74% |
+19.81% |
| Internet |
$IIX |
312.88 |
+5.89 |
+1.92% |
+11.05% |
| Broker/Dealer |
$XBD |
97.46 |
+3.31 |
+3.52% |
+17.05% |
| Retail |
$RLX |
563.30 |
+9.57 |
+1.73% |
+7.66% |
| Gold & Silver |
$XAU |
200.34 |
-2.40 |
-1.18% |
+10.91% |
| Bank |
$BKX |
45.05 |
+1.43 |
+3.28% |
+14.40% |
| Biotech |
$BTK |
1,389.26 |
+11.63 |
+0.84% |
+27.29% |
|
|
|
 |
Institutional Accumulation Indicated by Gap Up With Heavy Volume
Kenneth J. Gruneisen - Passed the CAN SLIM® Master's Exam
Often, when a leading stock is setting up to breakout of a solid base it is highlighted in CANSLIM.net's Mid-Day Breakouts Report. The most relevant factors are noted in the report which allows prudent CANSLIM oriented investors to place the issue in their watch list. After doing any necessary backup research, the investor is prepared to act if and when the stock triggers a technical buy signal (breaks above its pivot point on more than +50% average turnover). In the event the stock fails to trigger a technical buy signal and its price declines then it will simply be removed from the watch list. In other cases, stocks may be featured in CANSLIM.net's Mid-Day Breakouts Report.after recent action already triggered technical buy signal. Disciplined investors know to buy as near as possible to the pivot point and avoid chasing stocks after they have rallied more than +5% above their pivot point. It is crucial to always limit losses whenever any stock heads the wrong direction, and disciplined investors sell if a struggling stock ever falls more than -7% from their purchase price.
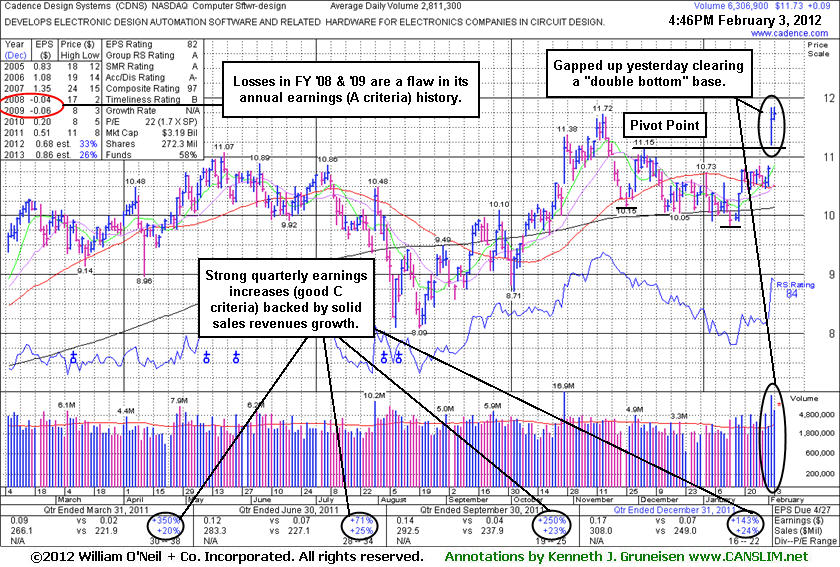
Cadence Design Systems Inc (CDNS +$0.09 or +0.77% to $11.73) posted a small gain today with above average volume for a new high close. It was featured in yellow in the earlier mid-day report with a pivot point based on its 12/05/11 high. A considerable gap up and volume-driven gain on 2/02/12 helped it break out from a "double bottom" base and also reach a new 52-week high. No overhead supply remains to act as resistance.
The 4 latest quarterly comparisons through Dec '11 showed strong sales revenues increases and earnings increases well above the +25% guideline, satisfying the C criteria. It has earned high ranks, however previously noted losses in FY '08 and '09 remain a blemish on its annual earnings history (A criteria). The number of top-rated funds owning its shares rose from 402 in Mar '11 to 509 in Dec '11, which is a very reassuring sign concerning the I criteria.
|
|
|
Color Codes Explained :
Y - Better candidates highlighted by our
staff of experts.
G - Previously featured
in past reports as yellow but may no longer be buyable under the
guidelines.
***Last / Change / Volume data in this table is the closing quote data***
Symbol/Exchange
Company Name
Industry Group |
PRICE |
CHANGE
(%Change) |
Day High |
Volume
(% DAV)
(% 50 day avg vol) |
52 Wk Hi
% From Hi |
Featured
Date |
Price
Featured |
Pivot Featured |
|
Max Buy |
ADS
-
NYSE
Alliance Data Sys Corp
COMPUTER SOFTWARE and SERVICES - Information and Delivery Service
|
$115.57
|
+3.22
2.87% |
$116.05
|
1,254,902
182.05% of 50 DAV
50 DAV is 689,300
|
$114.06
1.32%
|
1/17/2012
|
$108.24
|
PP = $107.43
|
|
MB = $112.80
|
 Most Recent Note - 2/3/2012 6:14:04 PM
G - Color code is changed to green after rallying to new all-time highs above its "max buy" level with volume-driven gains. Getting extended from its latest base.
>>> The latest Featured Stock Update with an annotated graph appeared on 1/17/2012. Click here.
View all notes |
Alert me of new notes |
CANSLIM.net Company Profile |
SEC |
Zacks Reports |
StockTalk |
News |
Chart |
Request a new note
C
A N
S L
I M


|
ALXN
-
NASDAQ
Alexion Pharmaceuticals
DRUGS - Drug Manufacturers - Other
|
$78.88
|
+1.10
1.41% |
$80.97
|
1,163,197
102.12% of 50 DAV
50 DAV is 1,139,100
|
$78.51
0.46%
|
11/30/2011
|
$68.66
|
PP = $70.52
|
|
MB = $74.05
|
Most Recent Note - 2/3/2012 6:16:05 PM
G - Hit a new 52-week high today with its 4th consecutive gain. Extended from its prior base, while prior resistance in the $70 area defines chart support coinciding with its 50 DMA line.
>>> The latest Featured Stock Update with an annotated graph appeared on 1/13/2012. Click here.
View all notes |
Alert me of new notes |
CANSLIM.net Company Profile |
SEC |
Zacks Reports |
StockTalk |
News |
Chart |
Request a new note
C
A N
S L
I M
|
BODY
-
NASDAQ
Body Central Corp
RETAIL - Catalog andamp; Mail Order Houses
|
$25.37
|
-0.11
-0.43% |
$25.78
|
390,087
266.63% of 50 DAV
50 DAV is 146,300
|
$27.24
-6.86%
|
1/27/2012
|
$26.69
|
PP = $25.46
|
|
MB = $26.73
|
Most Recent Note - 2/3/2012 6:19:14 PM
Y - Pulled back from its 52-week high with a 3rd consecutive loss with above average volume today. It has slumped just under its pivot point, trading near its prior highs noted as initial support to watch on pullbacks.
>>> The latest Featured Stock Update with an annotated graph appeared on 1/27/2012. Click here.
View all notes |
Alert me of new notes |
CANSLIM.net Company Profile |
SEC |
Zacks Reports |
StockTalk |
News |
Chart |
Request a new note
C
A N
S L
I M
|
CATM
-
NASDAQ
Cardtronics Inc
DIVERSIFIED SERVICES - Business/Management Services
|
$25.36
|
-0.13
-0.51% |
$26.25
|
2,331,549
638.08% of 50 DAV
50 DAV is 365,400
|
$28.74
-11.76%
|
12/23/2011
|
$28.64
|
PP = $28.56
|
|
MB = $29.99
|
Most Recent Note - 2/3/2012 6:21:57 PM
G - Tested its 200 DMA line noted as important chart support level to watch, then finished in the upper half of its intra-day range. Reported earnings +38% on +29% sales revenues for the quarter ended December 31, 2011 versus the year ago period. A rebound above its 50 DMA line is needed for its technical stance and outlook to improve.
>>> The latest Featured Stock Update with an annotated graph appeared on 1/30/2012. Click here.
View all notes |
Alert me of new notes |
CANSLIM.net Company Profile |
SEC |
Zacks Reports |
StockTalk |
News |
Chart |
Request a new note
C
A N
S L
I M
|
CDNS
-
NASDAQ
Cadence Design Systems
COMPUTER SOFTWARE and SERVICES - Technical and System Software
|
$11.73
|
+0.09
0.77% |
$11.84
|
6,308,726
224.41% of 50 DAV
50 DAV is 2,811,300
|
$11.84
-0.93%
|
2/3/2012
|
$11.66
|
PP = $11.15
|
|
MB = $11.71
|
Most Recent Note - 2/3/2012 6:24:27 PM
Y - Featured in yellow in the earlier mid-day report today with a pivot point based on its 12/05/11 high while noted - "Technically, the prior volume-driven gain helped it break out from a "double bottom" base and also reach a new 52-week high." See the latest FSU analysis for more details and a new annotated graph.
>>> The latest Featured Stock Update with an annotated graph appeared on 2/3/2012. Click here.
View all notes |
Alert me of new notes |
CANSLIM.net Company Profile |
SEC |
Zacks Reports |
StockTalk |
News |
Chart |
Request a new note
C
A N
S L
I M
|
Symbol/Exchange
Company Name
Industry Group |
PRICE |
CHANGE
(%Change) |
Day High |
Volume
(% DAV)
(% 50 day avg vol) |
52 Wk Hi
% From Hi |
Featured
Date |
Price
Featured |
Pivot Featured |
|
Max Buy |
CELG
-
NASDAQ
Celgene Corp
DRUGS - Drug Manufacturers - Major
|
$73.21
|
-0.95
-1.28% |
$74.48
|
3,434,622
99.27% of 50 DAV
50 DAV is 3,459,800
|
$75.11
-2.53%
|
2/2/2012
|
$74.16
|
PP = $75.21
|
|
MB = $78.97
|
Most Recent Note - 2/3/2012 6:25:20 PM
Y - Color code was changed to yellow while forming an advanced "3-weeks tight" base pattern and stubbornly holding its ground within close striking distance of its all-time high ($77.39 in Aug '08). See the latest FSU analysis for more details and a new annotated weekly graph.
>>> The latest Featured Stock Update with an annotated graph appeared on 2/2/2012. Click here.
View all notes |
Alert me of new notes |
CANSLIM.net Company Profile |
SEC |
Zacks Reports |
StockTalk |
News |
Chart |
Request a new note
C
A N
S L
I M
|
FEIC
-
NASDAQ
F E I Co
ELECTRONICS - Diversified Electronics
|
$46.48
|
+0.64
1.40% |
$47.04
|
280,029
107.66% of 50 DAV
50 DAV is 260,100
|
$46.12
0.78%
|
12/7/2011
|
$41.41
|
PP = $42.35
|
|
MB = $44.47
|
Most Recent Note - 2/3/2012 6:26:41 PM
G - Finished at its best-ever close with today's 4th consecutive gain, getting more extended from its prior base. Prior highs in the $43 area define initial chart support.
>>> The latest Featured Stock Update with an annotated graph appeared on 1/25/2012. Click here.
View all notes |
Alert me of new notes |
CANSLIM.net Company Profile |
SEC |
Zacks Reports |
StockTalk |
News |
Chart |
Request a new note
C
A N
S L
I M
|
GNC
-
NYSE
G N C Holdings Inc
RETAIL - Drug Stores
|
$28.37
|
+0.87
3.16% |
$28.37
|
903,790
86.81% of 50 DAV
50 DAV is 1,041,100
|
$29.67
-4.38%
|
1/19/2012
|
$28.99
|
PP = $29.60
|
|
MB = $31.08
|
Most Recent Note - 2/3/2012 6:28:26 PM
Y - Color code is changed to yellow after rebounding above its 50 DMA line with today's gain, helping its technical stance and outlook to improve.
>>> The latest Featured Stock Update with an annotated graph appeared on 1/19/2012. Click here.
View all notes |
Alert me of new notes |
CANSLIM.net Company Profile |
SEC |
Zacks Reports |
StockTalk |
News |
Chart |
Request a new note
C
A N
S L
I M
|
HMSY
-
NASDAQ
H M S Holdings Corp
COMPUTER SOFTWARE and SERVICES - Healthcare Information Service
|
$34.38
|
+0.36
1.06% |
$34.77
|
491,229
55.89% of 50 DAV
50 DAV is 878,900
|
$34.73
-1.01%
|
10/27/2011
|
$26.44
|
PP = $28.37
|
|
MB = $29.79
|
Most Recent Note - 2/3/2012 6:29:02 PM
G - Today's gain with below average volume led to its best-ever close. No resistance remains to hinder its progress, but it is extended from its prior base. Its 50 DMA line and prior highs near $32 define near-term chart support to watch.
>>> The latest Featured Stock Update with an annotated graph appeared on 12/28/2011. Click here.
View all notes |
Alert me of new notes |
CANSLIM.net Company Profile |
SEC |
Zacks Reports |
StockTalk |
News |
Chart |
Request a new note
C
A N
S L
I M
|
ISRG
-
NASDAQ
Intuitive Surgical Inc
HEALTH SERVICES - Medical Appliances and Equipment
|
$492.01
|
+9.01
1.87% |
$495.53
|
675,760
183.28% of 50 DAV
50 DAV is 368,700
|
$488.84
0.65%
|
12/20/2011
|
$442.43
|
PP = $449.16
|
|
MB = $471.62
|
Most Recent Note - 2/3/2012 1:23:41 PM
G - Up again today for its 4th consecutive gain and another new all-time high. Color code was changed to green after rallying beyond the "max buy" level that was cited. Reported earnings +24% on +28% sales revenues for the quarter ended December 31, 2011 versus the year ago period.
>>> The latest Featured Stock Update with an annotated graph appeared on 1/18/2012. Click here.
View all notes |
Alert me of new notes |
CANSLIM.net Company Profile |
SEC |
Zacks Reports |
StockTalk |
News |
Chart |
Request a new note
C
A N
S L
I M
|
Symbol/Exchange
Company Name
Industry Group |
PRICE |
CHANGE
(%Change) |
Day High |
Volume
(% DAV)
(% 50 day avg vol) |
52 Wk Hi
% From Hi |
Featured
Date |
Price
Featured |
Pivot Featured |
|
Max Buy |
LULU
-
NASDAQ
Lululemon Athletica
MANUFACTURING - Textile Manufacturing
|
$64.58
|
+1.03
1.62% |
$64.82
|
1,384,262
36.25% of 50 DAV
50 DAV is 3,819,000
|
$65.09
-0.78%
|
1/10/2012
|
$60.97
|
PP = $59.46
|
|
MB = $62.43
|
Most Recent Note - 2/3/2012 6:30:41 PM
G - Inched up for its best-ever close with another gain today backed by below average volume. No resistance remains due to overhead supply, but it is extended from the base pattern previously noted.
>>> The latest Featured Stock Update with an annotated graph appeared on 1/10/2012. Click here.
View all notes |
Alert me of new notes |
CANSLIM.net Company Profile |
SEC |
Zacks Reports |
StockTalk |
News |
Chart |
Request a new note
C
A N
S L
I M
|
MA
-
NYSE
Mastercard Inc Cl A
DIVERSIFIED SERVICES - Business/Management Services
|
$390.32
|
+8.75
2.29% |
$391.30
|
2,233,634
208.69% of 50 DAV
50 DAV is 1,070,300
|
$384.99
1.38%
|
2/2/2012
|
$379.05
|
PP = $381.32
|
|
MB = $400.39
|
Most Recent Note - 2/3/2012 6:32:14 PM
Y - Hit new 52-week and all-time highs with above average volume behind today's 6th consecutive gain. It rallied above the new pivot point cited and triggered a technical buy signal, breaking out from a "double bottom" base pattern. Reported earnings +28% on +20% sales revenues for the quarter ended December 31, 2011 versus the year ago period.
>>> The latest Featured Stock Update with an annotated graph appeared on 1/3/2012. Click here.
View all notes |
Alert me of new notes |
CANSLIM.net Company Profile |
SEC |
Zacks Reports |
StockTalk |
News |
Chart |
Request a new note
C
A N
S L
I M
|
MKTX
-
NASDAQ
Marketaxess Holdings Inc
FINANCIAL SERVICES - Investment Brokerage - Nationa
|
$34.35
|
+0.37
1.09% |
$35.42
|
222,483
123.19% of 50 DAV
50 DAV is 180,600
|
$34.86
-1.46%
|
10/28/2011
|
$29.79
|
PP = $31.05
|
|
MB = $32.60
|
Most Recent Note - 2/3/2012 6:34:42 PM
G - Hit another new all-time high with above average volume behind today's 4th consecutive gain. Color code is changed to green after getting extended from its latest base. No resistance remains due to overhead supply. Prior highs in the $31-32 area define initial chart support to watch. Reported earnings +26% on +17% sales revenues for the quarter ended December 31, 2011 versus the year ago period.
>>> The latest Featured Stock Update with an annotated graph appeared on 1/24/2012. Click here.
View all notes |
Alert me of new notes |
CANSLIM.net Company Profile |
SEC |
Zacks Reports |
StockTalk |
News |
Chart |
Request a new note
C
A N
S L
I M
|
OSIS
-
NASDAQ
O S I Systems Inc
ELECTRONICS - Semiconductor Equipment and Mate
|
$56.83
|
+1.60
2.89% |
$57.00
|
82,216
83.21% of 50 DAV
50 DAV is 98,800
|
$57.51
-1.19%
|
11/1/2011
|
$42.07
|
PP = $45.57
|
|
MB = $47.85
|
Most Recent Note - 2/3/2012 6:36:41 PM
G - Quieter volume was behind today's 4th consecutive gain as it rallied to a new high close. Reported earnings +20% on +11% sales revenues for the quarter ended December 31, 2011 versus the year ago period. Results below the +25% minimum earnings guideline, and marking its weakest earnings comparison in 2 years, raised concerns. See the latest FSU analysis for more details and a new annotated graph.
>>> The latest Featured Stock Update with an annotated graph appeared on 1/31/2012. Click here.
View all notes |
Alert me of new notes |
CANSLIM.net Company Profile |
SEC |
Zacks Reports |
StockTalk |
News |
Chart |
Request a new note
C
A N
S L
I M
|
PRGO
-
NASDAQ
Perrigo Co
DRUGS - Drug Related Products
|
$93.66
|
+0.53
0.57% |
$95.46
|
1,419,980
109.52% of 50 DAV
50 DAV is 1,296,500
|
$104.70
-10.54%
|
12/9/2011
|
$99.54
|
PP = $101.56
|
|
MB = $106.64
|
Most Recent Note - 2/3/2012 6:40:09 PM
G - Halted its slide today with a gain on higher volume, meanwhile its Relative Strength rank slumped to 77, falling below the minimum guideline for buy candidates under the fact-based system and raising concerns. Its 200 DMA line defines important near-term support, as that long-term average acted as support in prior months while it endured distributional pressure.
>>> The latest Featured Stock Update with an annotated graph appeared on 1/9/2012. Click here.
View all notes |
Alert me of new notes |
CANSLIM.net Company Profile |
SEC |
Zacks Reports |
StockTalk |
News |
Chart |
Request a new note
C
A N
S L
I M
|
Symbol/Exchange
Company Name
Industry Group |
PRICE |
CHANGE
(%Change) |
Day High |
Volume
(% DAV)
(% 50 day avg vol) |
52 Wk Hi
% From Hi |
Featured
Date |
Price
Featured |
Pivot Featured |
|
Max Buy |
RAX
-
NYSE
Rackspace Hosting Inc
INTERNET - Internet Software and; Services
|
$47.19
|
+0.32
0.68% |
$47.97
|
1,803,339
115.81% of 50 DAV
50 DAV is 1,557,200
|
$47.90
-1.48%
|
2/2/2012
|
$46.69
|
PP = $45.55
|
|
MB = $47.83
|
Most Recent Note - 2/3/2012 6:43:21 PM
Y - Up again today following a considerable volume-driven gain on the prior session, hitting new 52-week and all-time highs and technically breaking out from an orderly flat base. Prior highs in the $45 area define initial support to watch on pullbacks.
>>> The latest Featured Stock Update with an annotated graph appeared on 1/5/2012. Click here.
View all notes |
Alert me of new notes |
CANSLIM.net Company Profile |
SEC |
Zacks Reports |
StockTalk |
News |
Chart |
Request a new note
C
A N
S L
I M
|
SWI
-
NYSE
Solarwinds Inc
COMPUTER SOFTWARE and SERVICES - Application Software
|
$34.66
|
+2.03
6.22% |
$35.35
|
2,735,496
286.26% of 50 DAV
50 DAV is 955,600
|
$33.68
2.91%
|
1/26/2012
|
$32.36
|
PP = $33.78
|
|
MB = $35.47
|
Most Recent Note - 2/3/2012 6:45:01 PM
Y - Gapped up today and rallied with nearly 3 times average volume for a considerable gain above its pivot point after an 8-week consolidation, triggering a technical buy signal. No resistance remains due to overhead supply.
>>> The latest Featured Stock Update with an annotated graph appeared on 1/26/2012. Click here.
View all notes |
Alert me of new notes |
CANSLIM.net Company Profile |
SEC |
Zacks Reports |
StockTalk |
News |
Chart |
Request a new note
C
A N
S L
I M
|
SXCI
-
NASDAQ
S X C Health Solutions
COMPUTER SOFTWARE and SERVICES - Healthcare Information Service
|
$63.85
|
+0.47
0.74% |
$63.89
|
316,705
94.15% of 50 DAV
50 DAV is 336,400
|
$66.40
-3.84%
|
1/10/2012
|
$62.05
|
PP = $60.10
|
|
MB = $63.11
|
Most Recent Note - 2/3/2012 6:47:21 PM
G - Consolidating in a tight trading range for the past few weeks, stubbornly holding its ground perched within close striking distance of its 52-week high. Prior highs in the $60 area and its 50 DMA line define chart support to watch on pullbacks.
>>> The latest Featured Stock Update with an annotated graph appeared on 1/20/2012. Click here.
View all notes |
Alert me of new notes |
CANSLIM.net Company Profile |
SEC |
Zacks Reports |
StockTalk |
News |
Chart |
Request a new note
C
A N
S L
I M
|
TDG
-
NYSE
Transdigm Group Inc
AEROSPACE/DEFENSE - Aerospace/Defense Products and; Services
|
$107.83
|
+1.77
1.67% |
$108.18
|
189,327
59.35% of 50 DAV
50 DAV is 319,000
|
$107.98
-0.14%
|
1/10/2012
|
$98.83
|
PP = $102.83
|
|
MB = $107.97
|
Most Recent Note - 2/3/2012 6:48:43 PM
Y - Up today with lighter volume for another new all-time high. It has rallied near its "max buy" level after volume-driven gains this week triggered a technical buy signal. No overhead supply remains to act as resistance. Prior highs near $102 define the initial support level to watch above its 50 DMA line.
>>> The latest Featured Stock Update with an annotated graph appeared on 1/4/2012. Click here.
View all notes |
Alert me of new notes |
CANSLIM.net Company Profile |
SEC |
Zacks Reports |
StockTalk |
News |
Chart |
Request a new note
C
A N
S L
I M
|
TSCO
-
NASDAQ
Tractor Supply Co
SPECIALTY RETAIL - Specialty Retail, Other
|
$81.21
|
+1.34
1.68% |
$81.65
|
703,736
99.59% of 50 DAV
50 DAV is 706,600
|
$82.50
-1.56%
|
1/12/2012
|
$79.12
|
PP = $75.58
|
|
MB = $79.36
|
Most Recent Note - 2/3/2012 6:51:37 PM
G - Holding its ground in a tight range for the past 3 weeks, enduring mild distributional pressure while not making meaningful price progress, yet remaining perched near its all-time high. Prior highs in the mid-$70s which were a resistance area now define initial support to watch on pullbacks.
>>> The latest Featured Stock Update with an annotated graph appeared on 1/12/2012. Click here.
View all notes |
Alert me of new notes |
CANSLIM.net Company Profile |
SEC |
Zacks Reports |
StockTalk |
News |
Chart |
Request a new note
C
A N
S L
I M
|
Symbol/Exchange
Company Name
Industry Group |
PRICE |
CHANGE
(%Change) |
Day High |
Volume
(% DAV)
(% 50 day avg vol) |
52 Wk Hi
% From Hi |
Featured
Date |
Price
Featured |
Pivot Featured |
|
Max Buy |
UBNT
-
NASDAQ
Ubiquiti Networks Inc
TELECOMMUNICATIONS - Diversified Communication Serv
|
$25.00
|
-0.52
-2.04% |
$27.23
|
478,885
183.06% of 50 DAV
50 DAV is 261,600
|
$25.73
-2.84%
|
1/27/2012
|
$22.25
|
PP = $23.14
|
|
MB = $24.30
|
Most Recent Note - 2/3/2012 6:53:36 PM
G - Reversed into the red today and closed near the session low with a loss after earlier gains for a new all-time high. It is extended from its prior base. See the latest FSU analysis for more details and a new annotated graph.
>>> The latest Featured Stock Update with an annotated graph appeared on 2/1/2012. Click here.
View all notes |
Alert me of new notes |
CANSLIM.net Company Profile |
SEC |
Zacks Reports |
StockTalk |
News |
Chart |
Request a new note
C
A N
S L
I M
|
ULTA
-
NASDAQ
Ulta Salon Cosm & Frag
SPECIALTY RETAIL - Specialty Retail, Other
|
$78.11
|
+1.50
1.96% |
$78.50
|
557,367
62.34% of 50 DAV
50 DAV is 894,100
|
$79.64
-1.92%
|
1/11/2012
|
$71.97
|
PP = $75.80
|
|
MB = $79.59
|
Most Recent Note - 2/3/2012 6:54:39 PM
Y - Still quietly consolidating near its all-time high. Recently wedged up from a riskier late-stage base without sufficient volume to trigger a proper technical buy signal. Prior lows near $64 define important chart support above its 200 DMA line.
>>> The latest Featured Stock Update with an annotated graph appeared on 1/11/2012. Click here.
View all notes |
Alert me of new notes |
CANSLIM.net Company Profile |
SEC |
Zacks Reports |
StockTalk |
News |
Chart |
Request a new note
C
A N
S L
I M
|
V
-
NYSE
Visa Inc Cl A
DIVERSIFIED SERVICES - Business/Management Services
|
$107.03
|
+0.97
0.91% |
$107.82
|
4,133,282
106.51% of 50 DAV
50 DAV is 3,880,600
|
$107.12
-0.08%
|
2/2/2012
|
$105.43
|
PP = $104.30
|
|
MB = $109.52
|
Most Recent Note - 2/3/2012 6:58:28 PM
Y - Gapped up again today for another new all-time high amid more strength in the group of Finance -Credit Card Payment Processing firms. Technically, its volume-driven gain above the new pivot point cited triggered a new (or add-on) buy signal. Prior highs in the $103-104 area define initial support.
>>> The latest Featured Stock Update with an annotated graph appeared on 1/23/2012. Click here.
View all notes |
Alert me of new notes |
CANSLIM.net Company Profile |
SEC |
Zacks Reports |
StockTalk |
News |
Chart |
Request a new note
C
A N
S L
I M
|
|
|
|
THESE ARE NOT BUY RECOMMENDATIONS!
Comments contained in the body of this report are technical
opinions only. The material herein has been obtained
from sources believed to be reliable and accurate, however,
its accuracy and completeness cannot be guaranteed.
This site is not an investment advisor, hence it does
not endorse or recommend any securities or other investments.
Any recommendation contained in this report may not
be suitable for all investors and it is not to be deemed
an offer or solicitation on our part with respect to
the purchase or sale of any securities. All trademarks,
service marks and trade names appearing in this report
are the property of their respective owners, and are
likewise used for identification purposes only.
This report is a service available
only to active Paid Premium Members.
You may opt-out of receiving report notifications
at any time. Questions or comments may be submitted
by writing to Premium Membership Services 665 S.E. 10 Street, Suite 201 Deerfield Beach, FL 33441-5634 or by calling 1-800-965-8307
or 954-785-1121.
|
|
|

