***Last / Change / Volume data in this table is the closing quote data***
Symbol/Exchange
Company Name
Industry Group |
PRICE |
CHANGE
(%Change) |
Day High |
Volume
(% DAV)
(% 50 day avg vol) |
52 Wk Hi
% From Hi |
Featured
Date |
Price
Featured |
Pivot Featured |
|
Max Buy |
ADS
-
NYSE
Alliance Data Sys Corp
COMPUTER SOFTWARE and SERVICES - Information and Delivery Service
|
$112.35
|
+1.34
1.21% |
$114.06
|
1,647,024
243.68% of 50 DAV
50 DAV is 675,900
|
$111.79
0.50%
|
1/17/2012
|
$108.24
|
PP = $107.43
|
|
MB = $112.80
|
 Most Recent Note - 2/2/2012 11:48:39 AM
Y - Reported strong results for the latest quarter ended December 31, 2011 versus the year ago period. Gapped down today and then found prompt support and rebounded and rallied to a new all-time high with volume running at an above average pace.
>>> The latest Featured Stock Update with an annotated graph appeared on 1/17/2012. Click here.
View all notes |
Alert me of new notes |
CANSLIM.net Company Profile |
SEC |
Zacks Reports |
StockTalk |
News |
Chart |
Request a new note
C
A N
S L
I M


|
ALXN
-
NASDAQ
Alexion Pharmaceuticals
DRUGS - Drug Manufacturers - Other
|
$77.78
|
+0.43
0.56% |
$78.51
|
917,242
80.34% of 50 DAV
50 DAV is 1,141,700
|
$78.08
-0.38%
|
11/30/2011
|
$68.66
|
PP = $70.52
|
|
MB = $74.05
|
Most Recent Note - 1/31/2012 4:09:25 PM
G - Gain today with higher volume. It is extended from its prior base, and on pullbacks prior resistance in the $70 area defines chart support along with its 50 DMA line.
>>> The latest Featured Stock Update with an annotated graph appeared on 1/13/2012. Click here.
View all notes |
Alert me of new notes |
CANSLIM.net Company Profile |
SEC |
Zacks Reports |
StockTalk |
News |
Chart |
Request a new note
C
A N
S L
I M
|
BODY
-
NASDAQ
Body Central Corp
RETAIL - Catalog andamp; Mail Order Houses
|
$25.48
|
-0.75
-2.86% |
$26.47
|
314,056
222.10% of 50 DAV
50 DAV is 141,400
|
$27.24
-6.46%
|
1/27/2012
|
$26.69
|
PP = $25.46
|
|
MB = $26.73
|
Most Recent Note - 2/2/2012 2:38:35 PM
Y - Pulling back from its 52-week high for a 2nd consecutive loss today after a streak of 7 straight gains. Slumping near its prior highs that define initial support to watch on pullbacks.
>>> The latest Featured Stock Update with an annotated graph appeared on 1/27/2012. Click here.
View all notes |
Alert me of new notes |
CANSLIM.net Company Profile |
SEC |
Zacks Reports |
StockTalk |
News |
Chart |
Request a new note
C
A N
S L
I M
|
CATM
-
NASDAQ
Cardtronics Inc
DIVERSIFIED SERVICES - Business/Management Services
|
$25.49
|
-0.42
-1.62% |
$26.12
|
911,472
260.12% of 50 DAV
50 DAV is 350,400
|
$28.74
-11.31%
|
12/23/2011
|
$28.64
|
PP = $28.56
|
|
MB = $29.99
|
Most Recent Note - 2/2/2012 2:41:33 PM
G - A rebound above its 50 DMA line is needed for its technical stance and outlook to improve. Its 200 DMA line ($23.76) defines the next important chart support level to watch. Due to report earnings after the close today, and volume and volatility often increase near earnings news.
>>> The latest Featured Stock Update with an annotated graph appeared on 1/30/2012. Click here.
View all notes |
Alert me of new notes |
CANSLIM.net Company Profile |
SEC |
Zacks Reports |
StockTalk |
News |
Chart |
Request a new note
C
A N
S L
I M
|
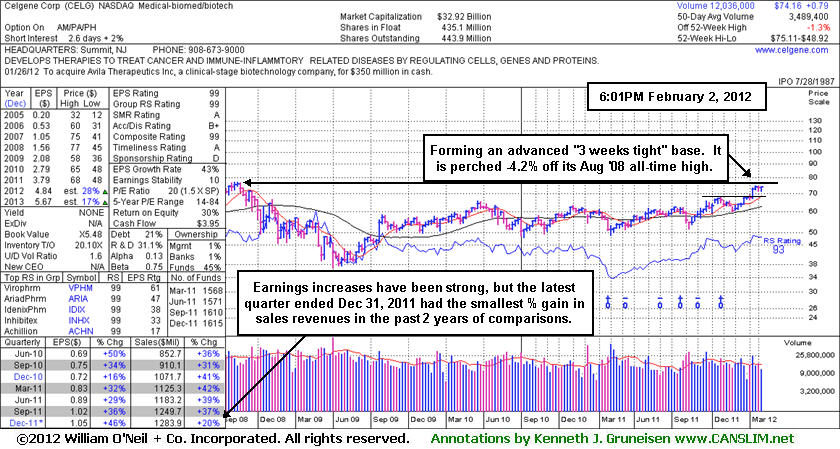
CELG
-
NASDAQ
Celgene Corp
DRUGS - Drug Manufacturers - Major
|
$74.16
|
+0.24
0.32% |
$74.58
|
2,014,994
57.75% of 50 DAV
50 DAV is 3,489,400
|
$75.11
-1.26%
|
2/2/2012
|
$74.16
|
PP = $75.21
|
|
MB = $78.97
|
Most Recent Note - 2/2/2012 6:45:20 PM
Y - Color code is changed to yellow while forming an advanced "3-weeks tight" base pattern and stubbornly holding its ground within close striking distance of its all-time high ($77.39 in Aug '08). See the latest FSU analysis for more details and a new annotated weekly graph.
>>> The latest Featured Stock Update with an annotated graph appeared on 2/2/2012. Click here.
View all notes |
Alert me of new notes |
CANSLIM.net Company Profile |
SEC |
Zacks Reports |
StockTalk |
News |
Chart |
Request a new note
C
A N
S L
I M
|
Symbol/Exchange
Company Name
Industry Group |
PRICE |
CHANGE
(%Change) |
Day High |
Volume
(% DAV)
(% 50 day avg vol) |
52 Wk Hi
% From Hi |
Featured
Date |
Price
Featured |
Pivot Featured |
|
Max Buy |
FEIC
-
NASDAQ
F E I Co
ELECTRONICS - Diversified Electronics
|
$45.84
|
+0.52
1.15% |
$46.12
|
219,410
83.84% of 50 DAV
50 DAV is 261,700
|
$45.85
-0.02%
|
12/7/2011
|
$41.41
|
PP = $42.35
|
|
MB = $44.47
|
Most Recent Note - 2/1/2012 1:25:56 PM
G - Perched within close striking distance of its best-ever close with today's gain. It is slightly extended from its prior base. No overhead supply remains to hinder its upward progress. Prior highs in the $43 area define initial chart support.
>>> The latest Featured Stock Update with an annotated graph appeared on 1/25/2012. Click here.
View all notes |
Alert me of new notes |
CANSLIM.net Company Profile |
SEC |
Zacks Reports |
StockTalk |
News |
Chart |
Request a new note
C
A N
S L
I M
|
GNC
-
NYSE
G N C Holdings Inc
RETAIL - Drug Stores
|
$27.50
|
+0.20
0.73% |
$27.58
|
816,278
77.93% of 50 DAV
50 DAV is 1,047,500
|
$29.67
-7.31%
|
1/19/2012
|
$28.99
|
PP = $29.60
|
|
MB = $31.08
|
Most Recent Note - 2/2/2012 3:13:12 PM
G - Encountering resistance at its 50 DMA line this week when rebounding following last week's violation that triggered a technical sell signal. A rebound above its 50 DMA line is needed for its outlook to improve.
>>> The latest Featured Stock Update with an annotated graph appeared on 1/19/2012. Click here.
View all notes |
Alert me of new notes |
CANSLIM.net Company Profile |
SEC |
Zacks Reports |
StockTalk |
News |
Chart |
Request a new note
C
A N
S L
I M
|
HMSY
-
NASDAQ
H M S Holdings Corp
COMPUTER SOFTWARE and SERVICES - Healthcare Information Service
|
$34.02
|
-0.04
-0.12% |
$34.44
|
464,893
52.88% of 50 DAV
50 DAV is 879,100
|
$34.73
-2.04%
|
10/27/2011
|
$26.44
|
PP = $28.37
|
|
MB = $29.79
|
Most Recent Note - 2/1/2012 1:27:46 PM
G - Today's gain has it within close striking distance of its best-ever close. No resistance remains to hinder its progress, but it is extended from its prior base. Its 50 DMA line and prior highs near $32 define near-term chart support to watch.
>>> The latest Featured Stock Update with an annotated graph appeared on 12/28/2011. Click here.
View all notes |
Alert me of new notes |
CANSLIM.net Company Profile |
SEC |
Zacks Reports |
StockTalk |
News |
Chart |
Request a new note
C
A N
S L
I M
|
ISRG
-
NASDAQ
Intuitive Surgical Inc
HEALTH SERVICES - Medical Appliances and Equipment
|
$483.00
|
+20.06
4.33% |
$488.84
|
1,072,739
302.95% of 50 DAV
50 DAV is 354,100
|
$476.49
1.37%
|
12/20/2011
|
$442.43
|
PP = $449.16
|
|
MB = $471.62
|
Most Recent Note - 2/2/2012 2:54:11 PM
G - Considerable volume-driven gain today for a new all-time high. Color code is changed to green after rallying beyond the "max buy" level that was cited. Reported earnings +24% on +28% sales revenues for the quarter ended December 31, 2011 versus the year ago period.
>>> The latest Featured Stock Update with an annotated graph appeared on 1/18/2012. Click here.
View all notes |
Alert me of new notes |
CANSLIM.net Company Profile |
SEC |
Zacks Reports |
StockTalk |
News |
Chart |
Request a new note
C
A N
S L
I M
|
LULU
-
NASDAQ
Lululemon Athletica
MANUFACTURING - Textile Manufacturing
|
$63.55
|
-0.21
-0.33% |
$64.56
|
1,526,665
39.71% of 50 DAV
50 DAV is 3,844,600
|
$65.09
-2.37%
|
1/10/2012
|
$60.97
|
PP = $59.46
|
|
MB = $62.43
|
Most Recent Note - 2/1/2012 3:10:22 PM
G - Inching up into new 52-week and all-time high territory, rising quietly with another gain today backed by below average volume. No resistance remains due to overhead supply, but it is extended from the base pattern previously noted.
>>> The latest Featured Stock Update with an annotated graph appeared on 1/10/2012. Click here.
View all notes |
Alert me of new notes |
CANSLIM.net Company Profile |
SEC |
Zacks Reports |
StockTalk |
News |
Chart |
Request a new note
C
A N
S L
I M
|
Symbol/Exchange
Company Name
Industry Group |
PRICE |
CHANGE
(%Change) |
Day High |
Volume
(% DAV)
(% 50 day avg vol) |
52 Wk Hi
% From Hi |
Featured
Date |
Price
Featured |
Pivot Featured |
|
Max Buy |
MA
-
NYSE
Mastercard Inc Cl A
DIVERSIFIED SERVICES - Business/Management Services
|
$381.57
|
+23.95
6.70% |
$384.25
|
3,502,577
342.92% of 50 DAV
50 DAV is 1,021,400
|
$384.99
-0.89%
|
2/2/2012
|
$379.05
|
PP = $381.32
|
|
MB = $400.39
|
Most Recent Note - 2/2/2012 12:28:22 PM
Y - Color code is changed to yellow after rallying back above its 50 DMA line, improving its technical stance. New pivot point is cited based on the 12/27/11 high while a strong close above it would trigger a technical buy signal from a "double bottom" base pattern. Gapped up today for a considerable volume-driven gain nearly challenging its 52 week high and pivot point after reporting earnings +28% on +20% sales revenues for the quarter ended December 31, 2011 versus the year ago period.
>>> The latest Featured Stock Update with an annotated graph appeared on 1/3/2012. Click here.
View all notes |
Alert me of new notes |
CANSLIM.net Company Profile |
SEC |
Zacks Reports |
StockTalk |
News |
Chart |
Request a new note
C
A N
S L
I M
|
MKTX
-
NASDAQ
Marketaxess Holdings Inc
FINANCIAL SERVICES - Investment Brokerage - Nationa
|
$33.98
|
+0.62
1.86% |
$34.86
|
308,361
174.22% of 50 DAV
50 DAV is 177,000
|
$33.82
0.47%
|
10/28/2011
|
$29.79
|
PP = $31.05
|
|
MB = $32.60
|
Most Recent Note - 2/1/2012 12:54:41 PM
Y - Reported earnings +26% on +17% sales revenues for the quarter ended December 31, 2011 versus the year ago period. Hit a new all-time high with today's gain and no resistance remains due to overhead supply. The 50 DMA line defines initial chart support to watch.
>>> The latest Featured Stock Update with an annotated graph appeared on 1/24/2012. Click here.
View all notes |
Alert me of new notes |
CANSLIM.net Company Profile |
SEC |
Zacks Reports |
StockTalk |
News |
Chart |
Request a new note
C
A N
S L
I M
|
OSIS
-
NASDAQ
O S I Systems Inc
ELECTRONICS - Semiconductor Equipment and Mate
|
$55.23
|
+0.15
0.27% |
$55.83
|
108,221
109.65% of 50 DAV
50 DAV is 98,700
|
$57.51
-3.96%
|
11/1/2011
|
$42.07
|
PP = $45.57
|
|
MB = $47.85
|
Most Recent Note - 1/31/2012 5:36:30 PM
G - Quietly consolidating -6.6% from its all-time high. Reported earnings +20% on +11% sales revenues for the quarter ended December 31, 2011 versus the year ago period. Results below the +25% minimum earnings guideline, and marking its weakest earnings comparison in 2 years, raised concerns. See the latest FSU analysis for more details and a new annotated graph.
>>> The latest Featured Stock Update with an annotated graph appeared on 1/31/2012. Click here.
View all notes |
Alert me of new notes |
CANSLIM.net Company Profile |
SEC |
Zacks Reports |
StockTalk |
News |
Chart |
Request a new note
C
A N
S L
I M
|
PRGO
-
NASDAQ
Perrigo Co
DRUGS - Drug Related Products
|
$93.13
|
-1.86
-1.96% |
$94.96
|
1,100,202
85.45% of 50 DAV
50 DAV is 1,287,500
|
$104.70
-11.05%
|
12/9/2011
|
$99.54
|
PP = $101.56
|
|
MB = $106.64
|
Most Recent Note - 2/2/2012 3:09:46 PM
G - Now it is -11.0% off its 52-week high and its Relative Strength rank has slumped to 80, which is the minimum guideline for buy candidates under the fact-based system, down from 88 when it was last shown in the FSU section on 1/09/12 with an annotated graph. Encountered resistance at its 50 DMA line when it recently tried to rebound, and it is now slumping near its 200 DMA line ($91.84). That important long-term average acted as support in prior months while it endured distributional pressure.
>>> The latest Featured Stock Update with an annotated graph appeared on 1/9/2012. Click here.
View all notes |
Alert me of new notes |
CANSLIM.net Company Profile |
SEC |
Zacks Reports |
StockTalk |
News |
Chart |
Request a new note
C
A N
S L
I M
|
RAX
-
NYSE
Rackspace Hosting Inc
INTERNET - Internet Software and; Services
|
$46.87
|
+2.42
5.44% |
$47.90
|
4,421,220
296.69% of 50 DAV
50 DAV is 1,490,200
|
$46.50
0.81%
|
2/2/2012
|
$46.69
|
PP = $45.55
|
|
MB = $47.83
|
Most Recent Note - 2/2/2012 12:37:32 PM
Y - Considerable gain after gapping up today rallying with above average volume to hit new 52-week and all-time highs. It formed an orderly flat base and its color code is changed to yellow with a new pivot point cited based on its most recent chart high plus 10 cents. Its recent low ($41.37 on 1/09/12) defines important near-term support to watch above its 200 DMA line.
>>> The latest Featured Stock Update with an annotated graph appeared on 1/5/2012. Click here.
View all notes |
Alert me of new notes |
CANSLIM.net Company Profile |
SEC |
Zacks Reports |
StockTalk |
News |
Chart |
Request a new note
C
A N
S L
I M
|
Symbol/Exchange
Company Name
Industry Group |
PRICE |
CHANGE
(%Change) |
Day High |
Volume
(% DAV)
(% 50 day avg vol) |
52 Wk Hi
% From Hi |
Featured
Date |
Price
Featured |
Pivot Featured |
|
Max Buy |
SWI
-
NYSE
Solarwinds Inc
COMPUTER SOFTWARE and SERVICES - Application Software
|
$32.63
|
+0.35
1.08% |
$33.40
|
1,222,814
127.72% of 50 DAV
50 DAV is 957,400
|
$33.68
-3.12%
|
1/26/2012
|
$32.36
|
PP = $33.78
|
|
MB = $35.47
|
Most Recent Note - 2/2/2012 2:59:38 PM
Y - Up again today rising near its pivot point without great volume conviction. Quietly wedging higher after an 8-week consolidation. No resistance remains due to overhead supply. Disciplined investors may watch for a convincing burst of institutional buying to confirm a new technical buy signal.
>>> The latest Featured Stock Update with an annotated graph appeared on 1/26/2012. Click here.
View all notes |
Alert me of new notes |
CANSLIM.net Company Profile |
SEC |
Zacks Reports |
StockTalk |
News |
Chart |
Request a new note
C
A N
S L
I M
|
SXCI
-
NASDAQ
S X C Health Solutions
COMPUTER SOFTWARE and SERVICES - Healthcare Information Service
|
$63.38
|
-1.07
-1.66% |
$64.94
|
237,467
69.31% of 50 DAV
50 DAV is 342,600
|
$66.40
-4.55%
|
1/10/2012
|
$62.05
|
PP = $60.10
|
|
MB = $63.11
|
Most Recent Note - 2/2/2012 2:45:30 PM
G - Volume totals have recently been cooling while consolidating in a tight trading range for the past few weeks, perched within close striking distance of its 52-week high.
>>> The latest Featured Stock Update with an annotated graph appeared on 1/20/2012. Click here.
View all notes |
Alert me of new notes |
CANSLIM.net Company Profile |
SEC |
Zacks Reports |
StockTalk |
News |
Chart |
Request a new note
C
A N
S L
I M
|
TDG
-
NYSE
Transdigm Group Inc
AEROSPACE/DEFENSE - Aerospace/Defense Products and; Services
|
$106.06
|
-0.77
-0.72% |
$107.62
|
238,181
73.72% of 50 DAV
50 DAV is 323,100
|
$107.98
-1.78%
|
1/10/2012
|
$98.83
|
PP = $102.83
|
|
MB = $107.97
|
Most Recent Note - 2/2/2012 2:48:01 PM
Y - Quietly holding its ground today near its all-time high and "max buy" level after volume-driven gains this week triggered a technical buy signal. No overhead supply remains to act as resistance. Prior highs near $102 define the initial support level to watch above its 50 DMA line.
>>> The latest Featured Stock Update with an annotated graph appeared on 1/4/2012. Click here.
View all notes |
Alert me of new notes |
CANSLIM.net Company Profile |
SEC |
Zacks Reports |
StockTalk |
News |
Chart |
Request a new note
C
A N
S L
I M
|
TSCO
-
NASDAQ
Tractor Supply Co
SPECIALTY RETAIL - Specialty Retail, Other
|
$79.87
|
-1.92
-2.35% |
$82.50
|
1,707,808
249.39% of 50 DAV
50 DAV is 684,800
|
$82.50
-3.19%
|
1/12/2012
|
$79.12
|
PP = $75.58
|
|
MB = $79.36
|
Most Recent Note - 2/2/2012 12:54:47 PM
G - Slumping near the session low with a loss on above average volume. It has been holding its ground in a tight range for the past 3 weeks, enduring mild distributional pressure while not making meaningful price progress, yet remaining perched at its all-time high. Prior highs in the mid-$70s which were a resistance area now define initial support to watch on pullbacks.
>>> The latest Featured Stock Update with an annotated graph appeared on 1/12/2012. Click here.
View all notes |
Alert me of new notes |
CANSLIM.net Company Profile |
SEC |
Zacks Reports |
StockTalk |
News |
Chart |
Request a new note
C
A N
S L
I M
|
UBNT
-
NASDAQ
Ubiquiti Networks Inc
TELECOMMUNICATIONS - Diversified Communication Serv
|
$25.52
|
+1.42
5.89% |
$25.73
|
403,479
156.45% of 50 DAV
50 DAV is 257,900
|
$25.30
0.87%
|
1/27/2012
|
$22.25
|
PP = $23.14
|
|
MB = $24.30
|
Most Recent Note - 2/2/2012 2:56:32 PM
G - Gapped up today rallying to a new high above the "max buy" level and its color code is changed to green. See the latest FSU analysis for more details and a new annotated graph.
>>> The latest Featured Stock Update with an annotated graph appeared on 2/1/2012. Click here.
View all notes |
Alert me of new notes |
CANSLIM.net Company Profile |
SEC |
Zacks Reports |
StockTalk |
News |
Chart |
Request a new note
C
A N
S L
I M
|
Symbol/Exchange
Company Name
Industry Group |
PRICE |
CHANGE
(%Change) |
Day High |
Volume
(% DAV)
(% 50 day avg vol) |
52 Wk Hi
% From Hi |
Featured
Date |
Price
Featured |
Pivot Featured |
|
Max Buy |
ULTA
-
NASDAQ
Ulta Salon Cosm & Frag
SPECIALTY RETAIL - Specialty Retail, Other
|
$76.61
|
-0.21
-0.27% |
$78.31
|
423,858
46.58% of 50 DAV
50 DAV is 909,900
|
$79.64
-3.80%
|
1/11/2012
|
$71.97
|
PP = $75.80
|
|
MB = $79.59
|
Most Recent Note - 1/31/2012 4:14:53 PM
Y - Quietly consolidating since last noted on 1/26/12 following a negative reversal after touching a new all-time high. Recently wedged up from a riskier late-stage base without sufficient volume to trigger a proper technical buy signal. Prior lows near $64 define important chart support above its 200 DMA line.
>>> The latest Featured Stock Update with an annotated graph appeared on 1/11/2012. Click here.
View all notes |
Alert me of new notes |
CANSLIM.net Company Profile |
SEC |
Zacks Reports |
StockTalk |
News |
Chart |
Request a new note
C
A N
S L
I M
|
V
-
NYSE
Visa Inc Cl A
DIVERSIFIED SERVICES - Business/Management Services
|
$106.06
|
+3.55
3.46% |
$107.12
|
8,435,037
223.36% of 50 DAV
50 DAV is 3,776,400
|
$104.20
1.79%
|
2/2/2012
|
$105.43
|
PP = $104.30
|
|
MB = $109.52
|
Most Recent Note - 2/2/2012 1:08:56 PM
Y - Gapped up today and hit a new all-time high amid strength in the group of Finance -Credit Card Payment Processing firms. No overhead supply remains to act as resistance. Its recent consolidation was not recognized as a sound basic base pattern, however some analysts may consider it an advanced "3-weeks tight" or longer consolidation in a tight trading range worthy of consideration. Color code is changed to yellow with a new pivot point based on its 1/19/12 high plus 10 cents. Prior highs in the $103-104 area define initial support. Its recent low ($98.33 on 1/11/12) and its 50 DMA line define important chart support to watch on pullbacks.
>>> The latest Featured Stock Update with an annotated graph appeared on 1/23/2012. Click here.
View all notes |
Alert me of new notes |
CANSLIM.net Company Profile |
SEC |
Zacks Reports |
StockTalk |
News |
Chart |
Request a new note
C
A N
S L
I M
|