You are not logged in.
This means you
CAN ONLY VIEW reports that were published prior to Monday, April 14, 2025.
You
MUST UPGRADE YOUR MEMBERSHIP if you want to see any current reports.
AFTER MARKET UPDATE - WEDNESDAY, FEBRUARY 3RD, 2010
Previous After Market Report Next After Market Report >>>
|
|
|
|
DOW |
-26.30 |
10,270.55 |
-0.26% |
|
Volume |
1,060,200,960 |
-10% |
|
Volume |
2,382,424,240 |
-7% |
|
NASDAQ |
+0.85 |
2,190.91 |
+0.04% |
|
Advancers |
1,163 |
37% |
|
Advancers |
1,100 |
39% |
|
S&P 500 |
-6.04 |
1,097.28 |
-0.55% |
|
Decliners |
1,856 |
59% |
|
Decliners |
1,547 |
55% |
|
Russell 2000 |
-3.39 |
610.66 |
-0.55% |
|
52 Wk Highs |
92 |
|
|
52 Wk Highs |
42 |
|
|
S&P 600 |
-2.42 |
324.34 |
-0.74% |
|
52 Wk Lows |
4 |
|
|
52 Wk Lows |
18 |
|
|
 |
Major Indices End Mixed With Volume Totals Lighter On Both Major Exchanges
Adam Sarhan, Contributing Writer,
The major averages ended mixed as the dollar rallied after the latest round of disappointing earnings and economic data was released. Volume was lighter than the prior session on the NYSE and Nasdaq exchange which signaled large institutions were not aggressively selling stocks. Decliners led advancers by nearly a 3-to-2 ratio on the NYSE and on the Nasdaq exchange. There were 10 high-ranked companies from the CANSLIM.net Leaders List that made a new 52-week high and appeared on the CANSLIM.net BreakOuts Page, lower than the 17 issues that appeared on the prior session. New 52-week highs still outnumbered new 52-week lows on the NYSE and on the Nasdaq exchange.
Before Wednesday's opening bell, ADP, the country's largest private payrolls company, said US employers cut -22,000 jobs last month which matched forecasts. Now investors are waiting for Friday's official jobs report slated to be released this Friday at 8:30 am EST. Many pundits believe that US employers added jobs which would be the second monthly increase in three months.
The latest round of earnings from several high profile companies disappointed investors as many companies cut their 2011 and 2012 estimates. Pfizer Inc. (PFE -2.31%) gapped down and closed just below its 50 day moving average line after reporting a +34% increase in sales compared to the same quarter in the prior year but earnings slid -25%. Earnings continue to be reported in droves as over half of the companies in the S&P 500 have released their Q4 results. Barring some unforeseen event, earnings rose over +70% last quarter which will snap a record nine-quarter earnings slump for S&P 500 companies. So far, nearly +80% of companies that have released their Q4 results topped estimates. However, the fact that stocks are down since earnings season began suggests investors are not happy with the results.
On the economic front, the Institute for Supply Management (ISM) said its non manufacturing index (a.k.a service-index) rose to 50.5, which signaled growth but trailed estimates. Readings above 50 suggest growth while reading below 50 indicate contraction. Even though the number topped 50, it trailed estimates which led many to question the health of this recovery.
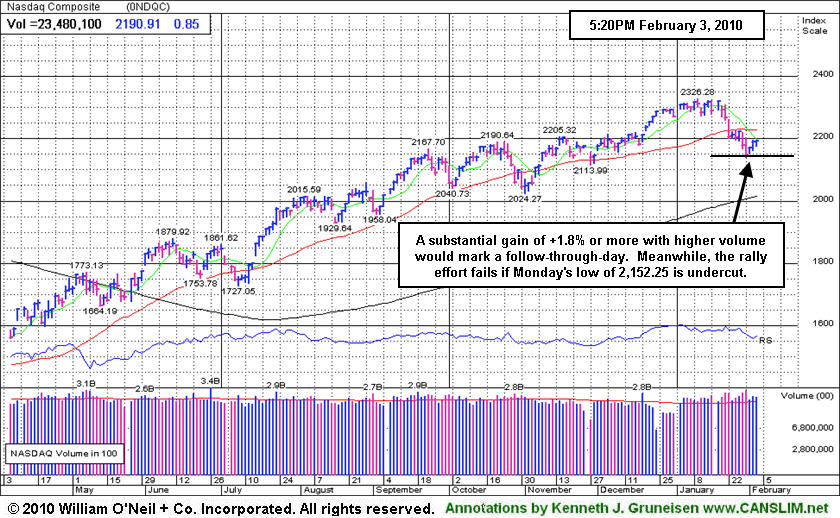
Looking at the market, Wednesday marked Day 3 of a new rally attempt which means that as long as Monday's lows are not breached, the earliest a possible follow-through day could emerge will be Thursday. However, if Monday's lows are taken out, then the day count will be reset and the chances for a steeper correction increase markedly. It is also important to see how the major averages react to their respective 50-day moving average (DMA) lines. Until they all close above that important level the technical damage remaining on the charts is a concern. So far, the market's reaction has been tepid at best to the latest round of economic and earnings data. Remember that the recent series of distribution days coupled with the deleterious action in the major averages suggests large institutions are aggressively selling stocks. Disciplined investors will now wait for a new follow-through day to be produced before resuming any buying efforts. Until then, patience is key.
PICTURED: The Nasdaq Composite Index posted a 3rd consecutive gain. A substantial gain of +1.8% or more with higher volume than the prior session would mark a "follow-through-day" and confirm the new rally, giving investors a green light for new buying efforts under the guidelines of the investment system. Meanwhile, the rally effort fails if Monday's low of 2,152.25 is undercut.
|
|
|
 |
Biotech Index Staying Perched Near Recovery Highs
Kenneth J. Gruneisen - Passed the CAN SLIM® Master's Exam
Influential financial shares created a drag on the major averages on Wednesday as the Bank Index ($BKX -4.31%) and Broker/Dealer Index ($XBD -4.03%) lost ground. Defensive groups also fell as the Healthcare Index ($HMO -3.-3.02%), Gold & Silver Index ($XAU -5.39%), Integrated Oil Index ($XOI -3.91%), and Oil Services Index ($OSX -4.61%) ended unanimously lower. The Retail Index ($RLX -2.28%) and most tech sector indexes suffered smaller losses, while the Biotechnology Index ($BTK -2.5%), Networking Index ($NWX -2.62%), and Semiconductor Index ($SOX -4.64%) fell and only the Internet Index ($IIX -2.66%) posted a small gain.
Charts courtesy www.stockcharts.com
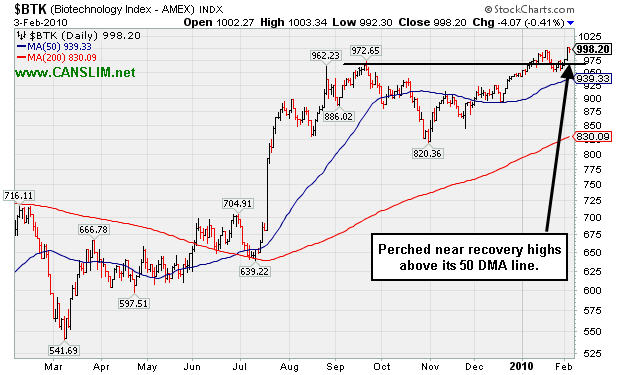
PICTURED: The Biotechnology Index ($BTK -0.41%) is perched near its recovery highs and trading above its 50-day moving average (DMA) line.
| Oil Services |
$OSX |
200.35 |
-1.06 |
-0.53% |
+2.79% |
| Healthcare |
$HMO |
1,460.71 |
-23.20 |
-1.56% |
-0.83% |
| Integrated Oil |
$XOI |
1,042.25 |
-11.13 |
-1.06% |
-2.43% |
| Semiconductor |
$SOX |
327.75 |
-0.95 |
-0.29% |
-8.94% |
| Networking |
$NWX |
228.27 |
-0.86 |
-0.38% |
-1.21% |
| Internet |
$IIX |
223.48 |
+1.40 |
+0.63% |
-4.44% |
| Broker/Dealer |
$XBD |
113.35 |
-0.97 |
-0.85% |
-1.48% |
| Retail |
$RLX |
401.35 |
-2.76 |
-0.68% |
-2.38% |
| Gold & Silver |
$XAU |
154.76 |
-1.79 |
-1.14% |
-8.02% |
| Bank |
$BKX |
46.20 |
-1.11 |
-2.35% |
+8.17% |
| Biotech |
$BTK |
998.20 |
-4.07 |
-0.41% |
+5.95% |
|
|
|
 |
3rd Best Close Ever For Baidu.com
Kenneth J. Gruneisen - Passed the CAN SLIM® Master's Exam
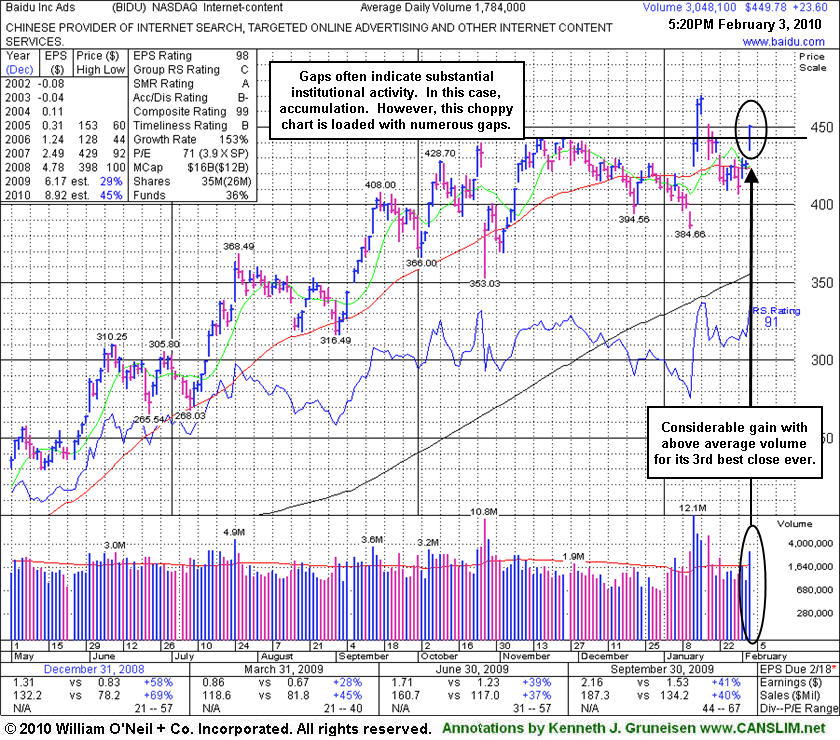
Baidu.com, Inc. (BIDU +$23.60 or +5.54% to $449.78) rose to its 3rd highest close ever today as a considerable gain backed by nearly 2 times average volume lifted it further above its 50-day moving average (DMA) line. Its slump below that important short-term average had raised concerns since getting extended from more than +5% above its pivot point from the latest "double bottom" base pattern. It had triggered a technical buy signal and was featured in yellow on 1/13/10 as it cleared the 12/29/09 high mentioned in the prior evening's note (view all notes).
Gaps often indicate substantial institutional activity. Today's considerable gap up and close near the session high was a sign of great institutional accumulation. However, this company's chart is loaded with numerous gaps in in either direction in recent months.
The company is due to report earnings after the close on February 9th. It has a stellar sales and earnings history that satisfies the C & A criteria. It is reassuring that the number of top-rated funds owning BIDU's shares rose from 103 in Dec '08 to 193 in Dec '09, solid evidence its shares were being accumulated by the institutional (I criteria) crowd.
Always follow all key criteria of the investment system to stack the odds of success in your favor. In a bullish market environment, many ideal buy candidates come along. Right now, disciplined investors are waiting for a new confirmed rally before initiating any new buying efforts. Meanwhile, the M criteria presents a problem, since 3 out of 4 stocks typically follow the direction of the major averages.
|
|
|
Color Codes Explained :
Y - Better candidates highlighted by our
staff of experts.
G - Previously featured
in past reports as yellow but may no longer be buyable under the
guidelines.
***Last / Change / Volume quote data in this table corresponds with the timestamp on the note***
Symbol/Exchange
Company Name
Industry Group |
Last |
Chg. |
Vol
% DAV |
Date Featured |
Price Featured |
Latest Pivot Point
Featured |
Status |
| Latest Max Buy Price |
ARST
-
|
$24.74
|
+0.33
|
171,192
35% DAV
489,600
|
12/22/2009
(Date
Featured) |
$25.94
(Price
Featured) |
PP = $27.20 |
G |
| MB = $28.56 |
Most Recent Note - 2/3/2010 5:13:58 PM
G - Three small gains on very light volume have followed 3 consecutive losses. Its outlook is increasingly questionable the longer it remains below its 50 DMA line. Distributional pressure negated its latest breakout. ARST was first featured in yellow at $19.91 in the 9/01/09 mid-day report with an annotated daily graph (read here).
>>> The latest Featured Stock Update with an annotated graph appeared on 1/21/2010. click here.
|
|
C
A
S
I |
News |
Chart |
SEC
View all notes Alert
me of new notes
Company
Profile
|
BIDU
- NASDAQ
Baidu Inc Ads
INTERNET - Internet Information Providers
|
$449.78
|
+23.60
|
3,057,050
171% DAV
1,784,000
|
1/13/2010
(Date
Featured) |
$431.25
(Price
Featured) |
PP = $426.75 |
G |
| MB = $448.09 |
Most Recent Note - 2/3/2010 5:19:46 PM
G - Gapped up today for a considerable gain with +71% above average volume, rallying further above its 50 DMA line for its third highest close ever. Gaps often provide very telling indications of institutional (I criteria) activity and, in this case, its gap up and strong close near the session high indicate accumulation. BIDU is due to report earnings after the close on February 9th.
>>> The latest Featured Stock Update with an annotated graph appeared on 2/3/2010. click here.
|
|
C
A
S
I |
News |
Chart |
SEC
View all notes Alert
me of new notes
Company
Profile
|
CACC
- NASDAQ
Credit Acceptance Corp
FINANCIAL SERVICES - Credit Services
|
$45.49
|
-5.77
|
174,267
325% DAV
53,600
|
9/29/2009
(Date
Featured) |
$33.48
(Price
Featured) |
PP = $37.10 |
G |
| MB = $38.96 |
Most Recent Note - 2/3/2010 5:26:21 PM
G - Down considerably today, closing at the session low with its 3rd consecutive loss on above average volume, a sign of more damaging distribution. It is due to report earnings after Thursday's close. Recently noted as "Extended from any sound base", the high-ranked Financial firm remains well above its 50 DMA line. On 1/25/10 the company announced the pricing of $250 Million Senior Secured Notes.
>>> The latest Featured Stock Update with an annotated graph appeared on 1/28/2010. click here.
|
|
C
A
S
I |
News |
Chart |
SEC
View all notes Alert
me of new notes
Company
Profile
|
CRM
- NYSE
Salesforce.com Inc
INTERNET - Internet Software & Services
|
$65.62
|
+0.56
|
1,181,332
66% DAV
1,785,600
|
12/18/2009
(Date
Featured) |
$67.32
(Price
Featured) |
PP = $67.82 |
G |
| MB = $71.21 |
Most Recent Note - 2/3/2010 5:29:28 PM
G - Small gain on light volume today, remaining below its 50 DMA line. It would need to rebound above that important short-term average for its outlook to improve.
>>> The latest Featured Stock Update with an annotated graph appeared on 1/27/2010. click here.
|
|
C
A
S
I |
News |
Chart |
SEC
View all notes Alert
me of new notes
Company
Profile
|
GMCR
- NASDAQ
Green Mtn Coffee Roastrs
FOOD & BEVERAGE - Processed & Packaged Goods
|
$85.75
|
-0.33
|
673,009
44% DAV
1,545,400
|
12/28/2009
(Date
Featured) |
$77.49
(Price
Featured) |
PP = $76.50 |
G |
| MB = $80.33 |
Most Recent Note - 2/3/2010 5:30:25 PM
G - Holding its ground stubbornly perched near all-time highs. Recent chart lows in the $78 area are an important support level to watch now.
>>> The latest Featured Stock Update with an annotated graph appeared on 2/2/2010. click here.
|
|
C
A
S
I |
News |
Chart |
SEC
View all notes Alert
me of new notes
Company
Profile
|
ISRG
- NASDAQ
Intuitive Surgical Inc
HEALTH SERVICES - Medical Appliances & Equipment
|
$332.24
|
-3.35
|
505,322
99% DAV
510,300
|
1/22/2010
(Date
Featured) |
$340.40
(Price
Featured) |
PP = $314.00 |
G |
| MB = $329.70 |
Most Recent Note - 2/3/2010 5:31:19 PM
G - Loss today on near average volume. Now trading above its "max buy" level, its color code was changed to green. ISRG was featured again most recently in the 1/22/10 mid-day report (read here), returning after some time off the Featured Stocks list. Its annual earnings history (the A criteria) has been very impressive. ISRG has rebounded impressively from its March low ($84.86) and may be on course for its all-time high ($359 in 2007). Notes outlined technical deterioration before and when it was last dropped from the Featured Stocks list on 6/10/08. ISRG traded up more than 13-fold since first featured in yellow in CANSLIM.net reports in the summer of 2004.
>>> The latest Featured Stock Update with an annotated graph appeared on 1/22/2010. click here.
|
|
C
A
S
I |
News |
Chart |
SEC
View all notes Alert
me of new notes
Company
Profile
|
PEGA
- NASDAQ
Pegasystems Inc
COMPUTER SOFTWARE & SERVICES - Business Software & Services
|
$36.35
|
-0.65
|
144,086
78% DAV
184,300
|
1/4/2010
(Date
Featured) |
$34.00
(Price
Featured) |
PP = $36.19 |
G |
| MB = $38.00 |
Most Recent Note - 2/3/2010 5:33:28 PM
G - Small loss today on lighter than average volume, perched near all-time highs. Wider than usual intra-day price swings in recent days were noted as a sign of uncertainty. Found support at its 50 DMA line after 2 big losses completely negated its 1/27/10 breakout. Its recent chart lows near $32.50 help define important technical support, where violations would trigger more worrisome sell signals. Negative market conditions (M criteria) are currently an overriding concern prompting great caution, since a follow-through day is still needed to confirm a new rally. After a hiatus from the Featured Stocks list, PEGA was featured again in the January 2010 issue of CANSLIM.net News (read here).
>>> The latest Featured Stock Update with an annotated graph appeared on 1/25/2010. click here.
|
|
C
A
S
I |
News |
Chart |
SEC
View all notes Alert
me of new notes
Company
Profile
|
|
|
|
THESE ARE NOT BUY RECOMMENDATIONS!
Comments contained in the body of this report are technical
opinions only. The material herein has been obtained
from sources believed to be reliable and accurate, however,
its accuracy and completeness cannot be guaranteed.
This site is not an investment advisor, hence it does
not endorse or recommend any securities or other investments.
Any recommendation contained in this report may not
be suitable for all investors and it is not to be deemed
an offer or solicitation on our part with respect to
the purchase or sale of any securities. All trademarks,
service marks and trade names appearing in this report
are the property of their respective owners, and are
likewise used for identification purposes only.
This report is a service available
only to active Paid Premium Members.
You may opt-out of receiving report notifications
at any time. Questions or comments may be submitted
by writing to Premium Membership Services 665 S.E. 10 Street, Suite 201 Deerfield Beach, FL 33441-5634 or by calling 1-800-965-8307
or 954-785-1121.
|
|
|


