You are not logged in.
This means you
CAN ONLY VIEW reports that were published prior to Wednesday, April 2, 2025.
You
MUST UPGRADE YOUR MEMBERSHIP if you want to see any current reports.
AFTER MARKET UPDATE - WEDNESDAY, FEBRUARY 1ST, 2012
Previous After Market Report Next After Market Report >>>
|
|
|
|
DOW |
+83.55 |
12,716.46 |
+0.66% |
|
Volume |
892,642,180 |
-14% |
|
Volume |
2,036,071,280 |
+22% |
|
NASDAQ |
+34.43 |
2,848.27 |
+1.22% |
|
Advancers |
2,473 |
79% |
|
Advancers |
1,934 |
73% |
|
S&P 500 |
+11.68 |
1,324.09 |
+0.89% |
|
Decliners |
549 |
18% |
|
Decliners |
610 |
23% |
|
Russell 2000 |
+16.84 |
809.66 |
+2.12% |
|
52 Wk Highs |
302 |
|
|
52 Wk Highs |
139 |
|
|
S&P 600 |
+9.50 |
451.62 |
+2.15% |
|
52 Wk Lows |
10 |
|
|
52 Wk Lows |
11 |
|
|
 |
Leadership Expands Behind Broad-Based Rally
Kenneth J. Gruneisen - Passed the CAN SLIM® Master's Exam
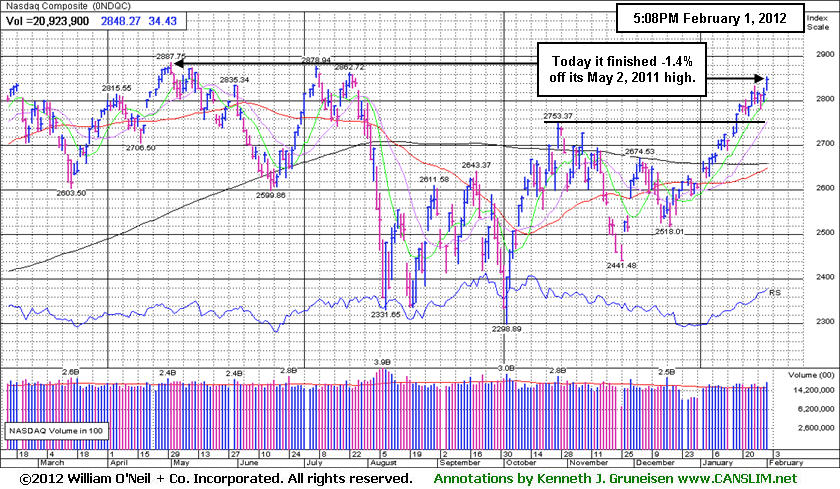
The major averages posted solid gains, despite slipping from their session highs. The volume totals on Wednesday were reported mixed, lighter than the prior session on the NYSE and higher on the Nasdaq exchange. Breadth on the exchanges was solidly positive as the NYSE saw advancers leading decliners by more than 4-1 and advancers led decliners by more than 3-1 on the Nasdaq exchange. Stocks hitting new 52-week highs easily outnumbered new 52-week lows on both exchanges while there were the most new 52-week highs on the NYSE since May 2nd, 2011, and the most new 52-week highs on the Nasdaq exchange since July 7th, 2011. There were 98 high-ranked companies from the CANSLIM.net Leaders List that made new 52-week highs and appeared on the CANSLIM.net BreakOuts Page, nearly doubling the prior session total of 50 stocks. There were gains for 18 of the 22 high-ranked companies currently included on the Featured Stocks Page.
Stocks were higher in the opening hours of trading following early positive economic reports out of China and Europe. Specifically, China and German manufacturing showed expansion in January, reducing hard-landing fears and boosting optimism for the global economic outlook. U.K.’s manufacturing gauge rose to an eight month high, while Germany’s output grew for the first time in four months.U.S. economic data is adding to sentiment with largely in-line releases. The January ADP national employment report met expectations, while the ISM manufacturing index came in a little light with the index rising to 54.1. A separate report showed construction spending in December grew +1.5%, besting consensus estimates.
On the earnings front, Amazon.com Inc (AMZN -7.7%) sank after it reported worse-than-expected results. On the positive side, appliance maker Whirlpool (WHR +13.48%) rallied after topping analysts' expectations in the fourth-quarter. Online service provider AOL Inc (AOL +9.56%) jumped after the company reported better-than-expected earnings results, and Broadcom Corp (BRCM +8.09%) rose after posting positive fourth-quarter earnings.
Financial stocks were influential gainers. Shares of Citigroup Inc (C +2.86%) received an analyst upgrade. Morgan Stanley (MS +3.97%) rallied on rumors that the firm had been selected to lead the highly publicized Facebook IPO.
The recent expansion in leadership (stocks making new 52-week highs) has been noted as a reassuring sign concerning the current confirmed market uptrend and the M criteria, as a healthy crop of strong leaders is necessary for any sustained market advance. Technical improvement from financial shares and key growth areas including the tech sector has been another encouraging sign helping the market outlook.
The Q4 2011 CANSLIM.net Webcast is still available "ON DEMAND" to all upgraded members at no additional cost. Via the Premium Member Homepage links to all prior reports and webcasts are always available.
PICTURED: The Nasdaq Composite Index finished -1.4% off its May 2, 2011 high after its solid gain.
|
 Kenneth J. Gruneisen started out as a licensed stockbroker in August 1987, a couple of months prior to the historic stock market crash that took the Dow Jones Industrial Average down -22.6% in a single day. He has published daily fact-based fundamental and technical analysis on high-ranked stocks online for two decades. Through FACTBASEDINVESTING.COM, Kenneth provides educational articles, news, market commentary, and other information regarding proven investment systems that work in good times and bad.
Comments contained in the body of this report are technical opinions only and are not necessarily those of Gruneisen Growth Corp. The material herein has been obtained from sources believed to be reliable and accurate, however, its accuracy and completeness cannot be guaranteed. Our firm, employees, and customers may effect transactions, including transactions contrary to any recommendation herein, or have positions in the securities mentioned herein or options with respect thereto. Any recommendation contained in this report may not be suitable for all investors and it is not to be deemed an offer or solicitation on our part with respect to the purchase or sale of any securities. |
|
 |
Medical, Financial, and Tech Shares Posted Gains
Kenneth J. Gruneisen - Passed the CAN SLIM® Master's Exam
Medical-related shares posted gains and gave the Biotechnology Index ($BTK +2.68%) and Healthcare Index ($HMO +2.87%) both a solid boost. The Bank Index ($BKX +1.71%) and Broker/Dealer Index ($XBD +2.21%) had a positive influence on the major averages. The Semiconductor Index ($SOX +2.40%), Networking Index ($NWX +1.51%), and Internet Index ($IIX +1.21%) led the tech sector indexes unanimously higher. Strength in energy-related shares helped the Integrated Oil Index ($XOI +0.32%) and Oil Services Index ($OSX +1.30%) tally gains. Meanwhile, the Retail Index ($RLX -0.64%) lagged and the Gold & Silver Index ($XAU -0.13%) finished flat.
Charts courtesy www.stockcharts.com
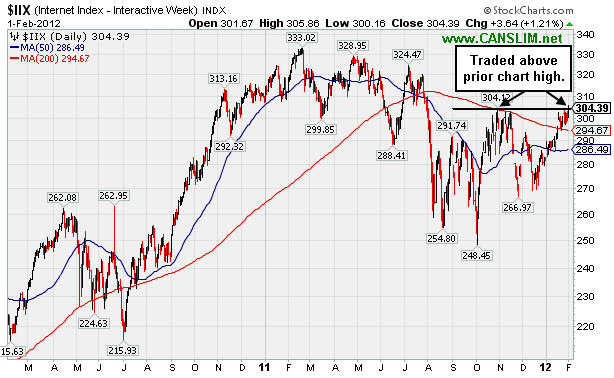
PICTURED: The Internet Index ($IIX +1.21%) traded above a prior chart high today after making progress above its 200-day moving average (DMA) line in January.
| Oil Services |
$OSX |
240.33 |
+3.09 |
+1.30% |
+11.12% |
| Healthcare |
$HMO |
2,594.22 |
+72.46 |
+2.87% |
+13.70% |
| Integrated Oil |
$XOI |
1,264.15 |
+4.05 |
+0.32% |
+2.85% |
| Semiconductor |
$SOX |
418.74 |
+9.80 |
+2.40% |
+14.90% |
| Networking |
$NWX |
243.73 |
+3.63 |
+1.51% |
+13.28% |
| Internet |
$IIX |
304.39 |
+3.64 |
+1.21% |
+8.04% |
| Broker/Dealer |
$XBD |
94.12 |
+2.03 |
+2.21% |
+13.03% |
| Retail |
$RLX |
550.92 |
-3.57 |
-0.64% |
+5.30% |
| Gold & Silver |
$XAU |
200.77 |
-0.27 |
-0.13% |
+11.14% |
| Bank |
$BKX |
43.30 |
+0.73 |
+1.71% |
+9.95% |
| Biotech |
$BTK |
1,357.43 |
+35.39 |
+2.68% |
+24.37% |
|
|
|
 |
Finished in Upper Third of Intra-day Range After Deeper Dip
Kenneth J. Gruneisen - Passed the CAN SLIM® Master's Exam
Often, when a leading stock is setting up to breakout of a solid base it is highlighted in CANSLIM.net's Mid-Day Breakouts Report. The most relevant factors are noted in the report which allows prudent CANSLIM oriented investors to place the issue in their watch list. After doing any necessary backup research, the investor is prepared to act if and when the stock triggers a technical buy signal (breaks above its pivot point on more than +50% average turnover). In the event the stock fails to trigger a technical buy signal and its price declines then it will simply be removed from the watch list. In other cases, stocks may be featured in CANSLIM.net's Mid-Day Breakouts Report.after recent action already triggered technical buy signal. Disciplined investors know to buy as near as possible to the pivot point and avoid chasing stocks after they have rallied more than +5% above their pivot point. It is crucial to always limit losses whenever any stock heads the wrong direction, and disciplined investors sell if a struggling stock ever falls more than -7% from their purchase price.
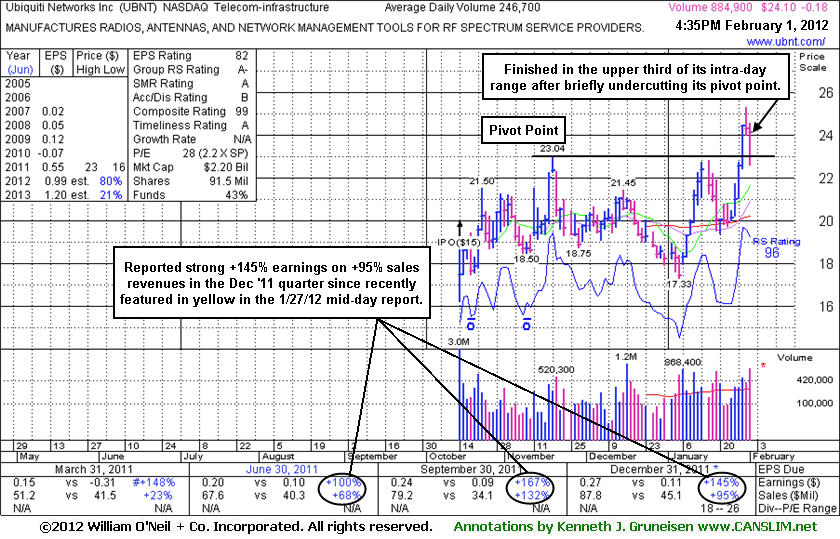
Ubiquiti Networks Inc (UBNT -$0.98 or -4.04% to $23.30) finished the session up from the morning's low after briefly undercutting its pivot point, enduring distributional pressure today. There was a "negative reversal" after reaching a new high on the prior session. It was first featured in yellow at $22.25 in the 1/27/12 mid-day report (read here) when perched within close striking distance of its 52-week high which was the basis for the pivot point cited. Subsequently, a technical buy signal was triggered on 1/30/12 with a considerable volume-driven gain into new high territory. It also reported earnings +145% on +95% sales revenues for the quarter ended December 31, 2011 versus the year ago period, adding to its strong fundamental track record of solid quarterly reports.
The limited trading history of new issues is often a cause for concern, yet in this case the stock built a sound base pattern of sufficient length and its fundamental characteristics were noted as particularly strong. Strong fundamentals and bullish technical action are no guarantee a stock will go on to generate great profits for investors, however, and disciplined investors know to always limit losses if ever any stock falls more than 7% from their purchase price. Prior highs near $23 define initial chart support to watch following the recent breakout. The finish in the upper third of its intra-day range is a sign it was finding prompt support, whereas a weak finish near the session low would bode poorly along with any damaging loss with above average volume. Any additional losses leading to deterioration and a close below its prior high closes would completely negate the breakout and raise greater concerns.
|
|
|
Color Codes Explained :
Y - Better candidates highlighted by our
staff of experts.
G - Previously featured
in past reports as yellow but may no longer be buyable under the
guidelines.
***Last / Change / Volume data in this table is the closing quote data***
Symbol/Exchange
Company Name
Industry Group |
PRICE |
CHANGE
(%Change) |
Day High |
Volume
(% DAV)
(% 50 day avg vol) |
52 Wk Hi
% From Hi |
Featured
Date |
Price
Featured |
Pivot Featured |
|
Max Buy |
ADS
-
NYSE
Alliance Data Sys Corp
COMPUTER SOFTWARE and SERVICES - Information and Delivery Service
|
$111.01
|
+0.21
0.19% |
$111.77
|
774,854
113.45% of 50 DAV
50 DAV is 683,000
|
$111.79
-0.70%
|
1/17/2012
|
$108.24
|
PP = $107.43
|
|
MB = $112.80
|
Most Recent Note - 1/30/2012 4:16:29 PM
Y - Quietly holding its ground today perched near its all-time high with no sign of distributional pressure in the past few weeks since finding support at its 50 DMA line.
>>> The latest Featured Stock Update with an annotated graph appeared on 1/17/2012. Click here.
View all notes |
Alert me of new notes |
CANSLIM.net Company Profile |
SEC |
Zacks Reports |
StockTalk |
News |
Chart |
Request a new note
C
A N
S L
I M


|
ALXN
-
NASDAQ
Alexion Pharmaceuticals
DRUGS - Drug Manufacturers - Other
|
$77.35
|
+0.59
0.77% |
$78.08
|
851,544
74.12% of 50 DAV
50 DAV is 1,148,900
|
$77.58
-0.30%
|
11/30/2011
|
$68.66
|
PP = $70.52
|
|
MB = $74.05
|
Most Recent Note - 1/31/2012 4:09:25 PM
G - Gain today with higher volume. It is extended from its prior base, and on pullbacks prior resistance in the $70 area defines chart support along with its 50 DMA line.
>>> The latest Featured Stock Update with an annotated graph appeared on 1/13/2012. Click here.
View all notes |
Alert me of new notes |
CANSLIM.net Company Profile |
SEC |
Zacks Reports |
StockTalk |
News |
Chart |
Request a new note
C
A N
S L
I M
|
BODY
-
NASDAQ
Body Central Corp
RETAIL - Catalog andamp; Mail Order Houses
|
$26.23
|
-0.64
-2.38% |
$26.87
|
330,428
242.43% of 50 DAV
50 DAV is 136,300
|
$27.24
-3.71%
|
1/27/2012
|
$26.69
|
PP = $25.46
|
|
MB = $26.73
|
 Most Recent Note - 2/1/2012 12:14:39 PM
Y - Perched near its 52-week high today after a streak of 7 consecutive gains when rallying from a cup-with-handle type base pattern. No overhead supply remains to act as resistance, meanwhile its prior high ($25.46 on 1/03/12) defines initial support to watch on pullbacks.
>>> The latest Featured Stock Update with an annotated graph appeared on 1/27/2012. Click here.
View all notes |
Alert me of new notes |
CANSLIM.net Company Profile |
SEC |
Zacks Reports |
StockTalk |
News |
Chart |
Request a new note
C
A N
S L
I M
|
CATM
-
NASDAQ
Cardtronics Inc
DIVERSIFIED SERVICES - Business/Management Services
|
$25.91
|
+0.36
1.41% |
$26.01
|
572,569
166.06% of 50 DAV
50 DAV is 344,800
|
$28.74
-9.85%
|
12/23/2011
|
$28.64
|
PP = $28.56
|
|
MB = $29.99
|
Most Recent Note - 1/30/2012 5:33:31 PM
G - Violated its 50 DMA line today triggering a technical sell signal. See the latest FSU analysis for more details and a new annotated graph. Due to report earnings on Thursday, February 2, 2012 after the close.
>>> The latest Featured Stock Update with an annotated graph appeared on 1/30/2012. Click here.
View all notes |
Alert me of new notes |
CANSLIM.net Company Profile |
SEC |
Zacks Reports |
StockTalk |
News |
Chart |
Request a new note
C
A N
S L
I M
|
CELG
-
NASDAQ
Celgene Corp
DRUGS - Drug Manufacturers - Major
|
$73.92
|
+1.23
1.69% |
$74.32
|
3,875,157
110.87% of 50 DAV
50 DAV is 3,495,100
|
$75.11
-1.58%
|
12/20/2011
|
$66.68
|
PP = $68.35
|
|
MB = $71.77
|
Most Recent Note - 2/1/2012 3:41:58 PM
G - Today's gain has it poised to possibly finish at a new high close for the year. Recently noted while also trading within close striking distance of its all-time high ($77.39 in Aug '08). Prior highs in the $68 area define support to watch on pullbacks.
>>> The latest Featured Stock Update with an annotated graph appeared on 12/29/2011. Click here.
View all notes |
Alert me of new notes |
CANSLIM.net Company Profile |
SEC |
Zacks Reports |
StockTalk |
News |
Chart |
Request a new note
C
A N
S L
I M
|
Symbol/Exchange
Company Name
Industry Group |
PRICE |
CHANGE
(%Change) |
Day High |
Volume
(% DAV)
(% 50 day avg vol) |
52 Wk Hi
% From Hi |
Featured
Date |
Price
Featured |
Pivot Featured |
|
Max Buy |
FEIC
-
NASDAQ
F E I Co
ELECTRONICS - Diversified Electronics
|
$45.32
|
+1.26
2.86% |
$45.36
|
371,259
143.12% of 50 DAV
50 DAV is 259,400
|
$45.85
-1.16%
|
12/7/2011
|
$41.41
|
PP = $42.35
|
|
MB = $44.47
|
Most Recent Note - 2/1/2012 1:25:56 PM
G - Perched within close striking distance of its best-ever close with today's gain. It is slightly extended from its prior base. No overhead supply remains to hinder its upward progress. Prior highs in the $43 area define initial chart support.
>>> The latest Featured Stock Update with an annotated graph appeared on 1/25/2012. Click here.
View all notes |
Alert me of new notes |
CANSLIM.net Company Profile |
SEC |
Zacks Reports |
StockTalk |
News |
Chart |
Request a new note
C
A N
S L
I M
|
GNC
-
NYSE
G N C Holdings Inc
RETAIL - Drug Stores
|
$27.30
|
-0.21
-0.76% |
$27.97
|
830,288
79.01% of 50 DAV
50 DAV is 1,050,900
|
$29.67
-7.99%
|
1/19/2012
|
$28.99
|
PP = $29.60
|
|
MB = $31.08
|
Most Recent Note - 1/30/2012 4:09:25 PM
G - Posting a solid gain today following a positive reversal on the prior session. Last week's damaging 50 DMA line violation triggered a technical sell signal. A rebound above its 50 DMA line is needed for its outlook to improve.
>>> The latest Featured Stock Update with an annotated graph appeared on 1/19/2012. Click here.
View all notes |
Alert me of new notes |
CANSLIM.net Company Profile |
SEC |
Zacks Reports |
StockTalk |
News |
Chart |
Request a new note
C
A N
S L
I M
|
HMSY
-
NASDAQ
H M S Holdings Corp
COMPUTER SOFTWARE and SERVICES - Healthcare Information Service
|
$34.06
|
+1.05
3.18% |
$34.14
|
775,219
88.28% of 50 DAV
50 DAV is 878,100
|
$34.73
-1.93%
|
10/27/2011
|
$26.44
|
PP = $28.37
|
|
MB = $29.79
|
Most Recent Note - 2/1/2012 1:27:46 PM
G - Today's gain has it within close striking distance of its best-ever close. No resistance remains to hinder its progress, but it is extended from its prior base. Its 50 DMA line and prior highs near $32 define near-term chart support to watch.
>>> The latest Featured Stock Update with an annotated graph appeared on 12/28/2011. Click here.
View all notes |
Alert me of new notes |
CANSLIM.net Company Profile |
SEC |
Zacks Reports |
StockTalk |
News |
Chart |
Request a new note
C
A N
S L
I M
|
ISRG
-
NASDAQ
Intuitive Surgical Inc
HEALTH SERVICES - Medical Appliances and Equipment
|
$462.94
|
+3.03
0.66% |
$464.94
|
204,731
57.28% of 50 DAV
50 DAV is 357,400
|
$476.49
-2.84%
|
12/20/2011
|
$442.43
|
PP = $449.16
|
|
MB = $471.62
|
Most Recent Note - 1/30/2012 12:21:50 PM
Y - Recently found support near its 50 DMA line. Reported earnings +24% on +28% sales revenues for the quarter ended December 31, 2011 versus the year ago period.
>>> The latest Featured Stock Update with an annotated graph appeared on 1/18/2012. Click here.
View all notes |
Alert me of new notes |
CANSLIM.net Company Profile |
SEC |
Zacks Reports |
StockTalk |
News |
Chart |
Request a new note
C
A N
S L
I M
|
LULU
-
NASDAQ
Lululemon Athletica
MANUFACTURING - Textile Manufacturing
|
$63.76
|
+0.63
1.00% |
$65.09
|
2,436,777
63.16% of 50 DAV
50 DAV is 3,858,400
|
$64.51
-1.16%
|
1/10/2012
|
$60.97
|
PP = $59.46
|
|
MB = $62.43
|
Most Recent Note - 2/1/2012 3:10:22 PM
G - Inching up into new 52-week and all-time high territory, rising quietly with another gain today backed by below average volume. No resistance remains due to overhead supply, but it is extended from the base pattern previously noted.
>>> The latest Featured Stock Update with an annotated graph appeared on 1/10/2012. Click here.
View all notes |
Alert me of new notes |
CANSLIM.net Company Profile |
SEC |
Zacks Reports |
StockTalk |
News |
Chart |
Request a new note
C
A N
S L
I M
|
Symbol/Exchange
Company Name
Industry Group |
PRICE |
CHANGE
(%Change) |
Day High |
Volume
(% DAV)
(% 50 day avg vol) |
52 Wk Hi
% From Hi |
Featured
Date |
Price
Featured |
Pivot Featured |
|
Max Buy |
MA
-
NYSE
Mastercard Inc Cl A
DIVERSIFIED SERVICES - Business/Management Services
|
$357.62
|
+2.05
0.58% |
$361.23
|
1,457,800
143.61% of 50 DAV
50 DAV is 1,015,100
|
$384.99
-7.11%
|
1/3/2012
|
$367.87
|
PP = $385.09
|
|
MB = $404.34
|
Most Recent Note - 1/31/2012 4:11:28 PM
G - Up today for a 3rd consecutive gain with below average volume, challenging its 50 DMA line which may now act as a resistance level. Its 200 DMA line is the nearest support level to watch.
>>> The latest Featured Stock Update with an annotated graph appeared on 1/3/2012. Click here.
View all notes |
Alert me of new notes |
CANSLIM.net Company Profile |
SEC |
Zacks Reports |
StockTalk |
News |
Chart |
Request a new note
C
A N
S L
I M
|
MKTX
-
NASDAQ
Marketaxess Holdings Inc
FINANCIAL SERVICES - Investment Brokerage - Nationa
|
$33.36
|
+2.30
7.40% |
$33.82
|
536,607
315.47% of 50 DAV
50 DAV is 170,100
|
$32.23
3.51%
|
10/28/2011
|
$29.79
|
PP = $31.05
|
|
MB = $32.60
|
Most Recent Note - 2/1/2012 12:54:41 PM
Y - Reported earnings +26% on +17% sales revenues for the quarter ended December 31, 2011 versus the year ago period. Hit a new all-time high with today's gain and no resistance remains due to overhead supply. The 50 DMA line defines initial chart support to watch.
>>> The latest Featured Stock Update with an annotated graph appeared on 1/24/2012. Click here.
View all notes |
Alert me of new notes |
CANSLIM.net Company Profile |
SEC |
Zacks Reports |
StockTalk |
News |
Chart |
Request a new note
C
A N
S L
I M
|
OSIS
-
NASDAQ
O S I Systems Inc
ELECTRONICS - Semiconductor Equipment and Mate
|
$55.08
|
+1.35
2.51% |
$55.19
|
83,638
83.55% of 50 DAV
50 DAV is 100,100
|
$57.51
-4.23%
|
11/1/2011
|
$42.07
|
PP = $45.57
|
|
MB = $47.85
|
Most Recent Note - 1/31/2012 5:36:30 PM
G - Quietly consolidating -6.6% from its all-time high. Reported earnings +20% on +11% sales revenues for the quarter ended December 31, 2011 versus the year ago period. Results below the +25% minimum earnings guideline, and marking its weakest earnings comparison in 2 years, raised concerns. See the latest FSU analysis for more details and a new annotated graph.
>>> The latest Featured Stock Update with an annotated graph appeared on 1/31/2012. Click here.
View all notes |
Alert me of new notes |
CANSLIM.net Company Profile |
SEC |
Zacks Reports |
StockTalk |
News |
Chart |
Request a new note
C
A N
S L
I M
|
PRGO
-
NASDAQ
Perrigo Co
DRUGS - Drug Related Products
|
$94.99
|
-0.61
-0.64% |
$97.24
|
921,434
71.98% of 50 DAV
50 DAV is 1,280,200
|
$104.70
-9.27%
|
12/9/2011
|
$99.54
|
PP = $101.56
|
|
MB = $106.64
|
Most Recent Note - 2/1/2012 3:37:47 PM
G - Gapped up but reversed earlier gains today after encountering resistance when rebounding near its 50 DMA line. The next important support level to watch is its 200 DMA line ($91.77) which acted as support in prior months while it endured distributional pressure. It is still perched -8.9% off its 52-week high without a lot of resistance due to overhead supply.
>>> The latest Featured Stock Update with an annotated graph appeared on 1/9/2012. Click here.
View all notes |
Alert me of new notes |
CANSLIM.net Company Profile |
SEC |
Zacks Reports |
StockTalk |
News |
Chart |
Request a new note
C
A N
S L
I M
|
RAX
-
NYSE
Rackspace Hosting Inc
INTERNET - Internet Software and; Services
|
$44.45
|
+1.04
2.40% |
$44.54
|
1,495,959
100.71% of 50 DAV
50 DAV is 1,485,400
|
$46.50
-4.40%
|
11/8/2011
|
$44.28
|
PP = $46.27
|
|
MB = $48.58
|
Most Recent Note - 1/31/2012 4:05:01 PM
G - Gain today with above average volume helped it close just above its 50 DMA line. Its recent low ($41.37 on 1/09/12) defines important near-term support to watch above its 200 DMA line.
>>> The latest Featured Stock Update with an annotated graph appeared on 1/5/2012. Click here.
View all notes |
Alert me of new notes |
CANSLIM.net Company Profile |
SEC |
Zacks Reports |
StockTalk |
News |
Chart |
Request a new note
C
A N
S L
I M
|
Symbol/Exchange
Company Name
Industry Group |
PRICE |
CHANGE
(%Change) |
Day High |
Volume
(% DAV)
(% 50 day avg vol) |
52 Wk Hi
% From Hi |
Featured
Date |
Price
Featured |
Pivot Featured |
|
Max Buy |
SWI
-
NYSE
Solarwinds Inc
COMPUTER SOFTWARE and SERVICES - Application Software
|
$32.28
|
+0.67
2.12% |
$32.68
|
954,708
100.07% of 50 DAV
50 DAV is 954,000
|
$33.68
-4.16%
|
1/26/2012
|
$32.36
|
PP = $33.78
|
|
MB = $35.47
|
Most Recent Note - 2/1/2012 3:15:39 PM
Y - Up today, quietly wedging higher after an 8-week consolidation, with little resistance remaining due to overhead supply. Disciplined investors may watch for a fresh burst of institutional buying to confirm a new technical buy signal. See the latest FSU analysis for more details and a new annotated weekly graph.
>>> The latest Featured Stock Update with an annotated graph appeared on 1/26/2012. Click here.
View all notes |
Alert me of new notes |
CANSLIM.net Company Profile |
SEC |
Zacks Reports |
StockTalk |
News |
Chart |
Request a new note
C
A N
S L
I M
|
SXCI
-
NASDAQ
S X C Health Solutions
COMPUTER SOFTWARE and SERVICES - Healthcare Information Service
|
$64.45
|
+1.39
2.20% |
$65.13
|
218,019
59.36% of 50 DAV
50 DAV is 367,300
|
$66.40
-2.94%
|
1/10/2012
|
$62.05
|
PP = $60.10
|
|
MB = $63.11
|
Most Recent Note - 2/1/2012 1:23:09 PM
G - Gain today without great volume conviction has it getting above the "max buy" level and its color code is changed to green. Recently challenging its 52-week high.
>>> The latest Featured Stock Update with an annotated graph appeared on 1/20/2012. Click here.
View all notes |
Alert me of new notes |
CANSLIM.net Company Profile |
SEC |
Zacks Reports |
StockTalk |
News |
Chart |
Request a new note
C
A N
S L
I M
|
TDG
-
NYSE
Transdigm Group Inc
AEROSPACE/DEFENSE - Aerospace/Defense Products and; Services
|
$106.83
|
+2.30
2.20% |
$107.98
|
451,405
133.39% of 50 DAV
50 DAV is 338,400
|
$105.10
1.65%
|
1/10/2012
|
$98.83
|
PP = $102.83
|
|
MB = $107.97
|
Most Recent Note - 2/1/2012 3:32:15 PM
Y - Gapped up today, rallying near its "max buy" level after triggering a technical buy signal with its considerable gain backed by more than 2 times average volume noted on the prior session. No overhead supply remains to act as resistance. Prior highs near $102 define the initial support level to watch above its 50 DMA line.
>>> The latest Featured Stock Update with an annotated graph appeared on 1/4/2012. Click here.
View all notes |
Alert me of new notes |
CANSLIM.net Company Profile |
SEC |
Zacks Reports |
StockTalk |
News |
Chart |
Request a new note
C
A N
S L
I M
|
TSCO
-
NASDAQ
Tractor Supply Co
SPECIALTY RETAIL - Specialty Retail, Other
|
$81.79
|
+1.02
1.26% |
$81.84
|
968,774
142.30% of 50 DAV
50 DAV is 680,800
|
$82.50
-0.86%
|
1/12/2012
|
$79.12
|
PP = $75.58
|
|
MB = $79.36
|
Most Recent Note - 2/1/2012 3:45:55 PM
G - Holding its ground in a tight range for the past 3 weeks, enduring mild distributional pressure while not making meaningful price progress, yet remaining perched at its all-time high. Prior highs in the mid-$70s which were a resistance area now define initial support to watch on pullbacks.
>>> The latest Featured Stock Update with an annotated graph appeared on 1/12/2012. Click here.
View all notes |
Alert me of new notes |
CANSLIM.net Company Profile |
SEC |
Zacks Reports |
StockTalk |
News |
Chart |
Request a new note
C
A N
S L
I M
|
UBNT
-
NASDAQ
Ubiquiti Networks Inc
TELECOMMUNICATIONS - Diversified Communication Serv
|
$24.10
|
-0.18
-0.74% |
$24.55
|
896,713
363.48% of 50 DAV
50 DAV is 246,700
|
$25.30
-4.74%
|
1/27/2012
|
$22.25
|
PP = $23.14
|
|
MB = $24.30
|
Most Recent Note - 2/1/2012 5:07:42 PM
Y - Finished in the upper third of its intra-day range today after briefly undercutting its pivot point. See the latest FSU analysis for more details and a new annotated graph.
>>> The latest Featured Stock Update with an annotated graph appeared on 2/1/2012. Click here.
View all notes |
Alert me of new notes |
CANSLIM.net Company Profile |
SEC |
Zacks Reports |
StockTalk |
News |
Chart |
Request a new note
C
A N
S L
I M
|
Symbol/Exchange
Company Name
Industry Group |
PRICE |
CHANGE
(%Change) |
Day High |
Volume
(% DAV)
(% 50 day avg vol) |
52 Wk Hi
% From Hi |
Featured
Date |
Price
Featured |
Pivot Featured |
|
Max Buy |
ULTA
-
NASDAQ
Ulta Salon Cosm & Frag
SPECIALTY RETAIL - Specialty Retail, Other
|
$76.82
|
+0.67
0.88% |
$77.06
|
642,520
69.98% of 50 DAV
50 DAV is 918,200
|
$79.64
-3.54%
|
1/11/2012
|
$71.97
|
PP = $75.80
|
|
MB = $79.59
|
Most Recent Note - 1/31/2012 4:14:53 PM
Y - Quietly consolidating since last noted on 1/26/12 following a negative reversal after touching a new all-time high. Recently wedged up from a riskier late-stage base without sufficient volume to trigger a proper technical buy signal. Prior lows near $64 define important chart support above its 200 DMA line.
>>> The latest Featured Stock Update with an annotated graph appeared on 1/11/2012. Click here.
View all notes |
Alert me of new notes |
CANSLIM.net Company Profile |
SEC |
Zacks Reports |
StockTalk |
News |
Chart |
Request a new note
C
A N
S L
I M
|
V
-
NYSE
Visa Inc Cl A
DIVERSIFIED SERVICES - Business/Management Services
|
$102.51
|
+1.87
1.86% |
$102.70
|
3,844,165
101.54% of 50 DAV
50 DAV is 3,785,700
|
$104.20
-1.62%
|
10/24/2011
|
$94.21
|
PP = $94.85
|
|
MB = $99.59
|
Most Recent Note - 2/1/2012 3:26:10 PM
G - No overhead supply remains to act as resistance, however its recent consolidation is not recognized as a sound basic base pattern. Its recent low ($98.33 on 1/11/12) and its 50 DMA line define chart support to watch on pullbacks.
>>> The latest Featured Stock Update with an annotated graph appeared on 1/23/2012. Click here.
View all notes |
Alert me of new notes |
CANSLIM.net Company Profile |
SEC |
Zacks Reports |
StockTalk |
News |
Chart |
Request a new note
C
A N
S L
I M
|
|
|
|
THESE ARE NOT BUY RECOMMENDATIONS!
Comments contained in the body of this report are technical
opinions only. The material herein has been obtained
from sources believed to be reliable and accurate, however,
its accuracy and completeness cannot be guaranteed.
This site is not an investment advisor, hence it does
not endorse or recommend any securities or other investments.
Any recommendation contained in this report may not
be suitable for all investors and it is not to be deemed
an offer or solicitation on our part with respect to
the purchase or sale of any securities. All trademarks,
service marks and trade names appearing in this report
are the property of their respective owners, and are
likewise used for identification purposes only.
This report is a service available
only to active Paid Premium Members.
You may opt-out of receiving report notifications
at any time. Questions or comments may be submitted
by writing to Premium Membership Services 665 S.E. 10 Street, Suite 201 Deerfield Beach, FL 33441-5634 or by calling 1-800-965-8307
or 954-785-1121.
|
|
|

