You are not logged in.
This means you
CAN ONLY VIEW reports that were published prior to Monday, April 14, 2025.
You
MUST UPGRADE YOUR MEMBERSHIP if you want to see any current reports.
AFTER MARKET UPDATE - WEDNESDAY, JANUARY 29TH, 2014
Previous After Market Report Next After Market Report >>>
|
|
|
|
DOW |
-189.77 |
15,738.79 |
-1.19% |
|
Volume |
720,925,070 |
+18% |
|
Volume |
2,073,228,240 |
+11% |
|
NASDAQ |
-46.53 |
4,051.43 |
-1.14% |
|
Advancers |
713 |
23% |
|
Advancers |
605 |
23% |
|
S&P 500 |
-18.30 |
1,774.20 |
-1.02% |
|
Decliners |
2,365 |
75% |
|
Decliners |
1,998 |
75% |
|
Russell 2000 |
-15.78 |
1,122.45 |
-1.39% |
|
52 Wk Highs |
26 |
|
|
52 Wk Highs |
44 |
|
|
S&P 600 |
-8.70 |
635.64 |
-1.35% |
|
52 Wk Lows |
96 |
|
|
52 Wk Lows |
33 |
|
|
 |
Volume Increase Behind Losses a Sign of Institutional Pressure
Kenneth J. Gruneisen - Passed the CAN SLIM® Master's Exam
The major averages ended near their worst levels of the session with big losses on Wednesday. The volume totals were reported higher than the prior trading session's volume totals on the NYSE and on the Nasdaq exchange, a sign that the institutional crowd was increasing their selling efforts. Breadth was negative as decliners trailed advancers by more than a 3-1 ratio on the NYSE and on the Nasdaq exchange. There were 8 high-ranked companies from the CANSLIM.net Leaders List that made new 52-week highs and appeared on the CANSLIM.net BreakOuts Page, up a notch from the total of 7 stocks on the prior session. The list of stocks hitting new 52-week lows outnumbered new highs on the NYSE while new highs still outnumbered new lows on the Nasdaq exchange. There were gains for only 3 of the 14 high-ranked companies currently included on the Featured Stocks Page, a list that has recently been waning. The Market (M criteria) has encountered distributional pressure and leadership (stocks hitting new highs) has waned, earning the label of being in another "correction". Such weakness serves as a reminder for investors to use caution and remain disciplined in following proper sell rules under the fact-based investment system to reduce market exposure.
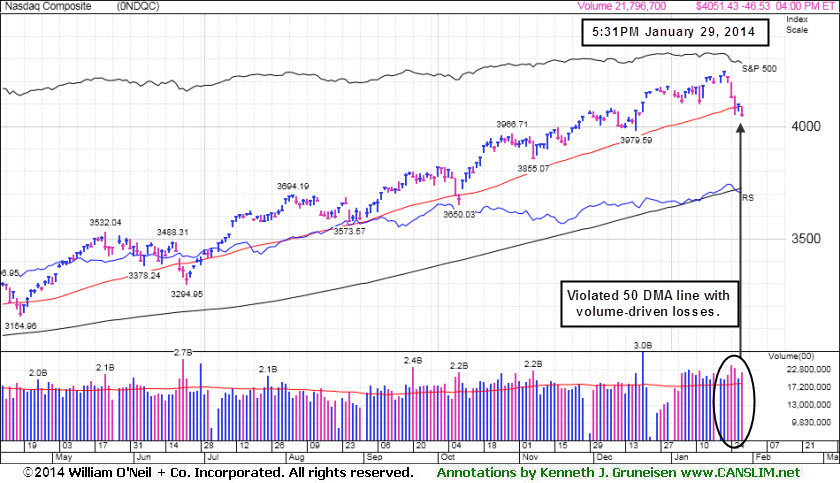
The Dow Jones Industrial Average fell 189 points to 15,738, the S&P 500 gave up 18 points to 1,774 and the NASDAQ shed 46 points with the index closing at 4,051.
Stocks extended their losses into the closing bell following the Fed’s decision to reduce its level of asset purchases by an additional $10 billion to $65 billion per month. A batch of disappointing corporate earnings reports also weighed on equities.
Shares of AT&T Inc (T -1.1%) as the telecom giant reported weaker-than-expected wireless subscription growth. Yahoo! Inc (YHOO -8.7%) also declined in the session after posting their quarterly results. On the upside, Dow Chemical (DOW +3.8%) and Electronic Arts (EA +1.4%) rose following their earnings reports.
Turning to fixed income markets, Treasuries ended higher along the curve. The benchmark 10-year note gained 23/32 to yield 2.69% and the 30-year bond added more than 1 and 1/4 points to yield 3.63%.
Investors should be watchful for any individual issues flashing technical sell signals. The CANSLIM.net Featured Stocks Page shows the most action-worthy candidates and their latest notes and a Headline Link directs members to the latest detailed analysis with data-packed graphs annotated by a Certified expert along with links to additional resources. The Premium Member Homepage includes "dynamic archives" to all prior pay reports published. Watch for an announcement via email concerning the next WEBCAST.
PICTURED: The Nasdaq Composite Index has violated its 50-day moving average (DMA) line with volume-driven losses, joining the Dow Industrials and the S&P 500 index which both already slumped below their respectiuve short-term moving averages. The damaging losses are viewed as a worrisome sign that the market conditions are eroding, further reminding investors to stand ready to reduce their market exposure.
|
 Kenneth J. Gruneisen started out as a licensed stockbroker in August 1987, a couple of months prior to the historic stock market crash that took the Dow Jones Industrial Average down -22.6% in a single day. He has published daily fact-based fundamental and technical analysis on high-ranked stocks online for two decades. Through FACTBASEDINVESTING.COM, Kenneth provides educational articles, news, market commentary, and other information regarding proven investment systems that work in good times and bad.
Comments contained in the body of this report are technical opinions only and are not necessarily those of Gruneisen Growth Corp. The material herein has been obtained from sources believed to be reliable and accurate, however, its accuracy and completeness cannot be guaranteed. Our firm, employees, and customers may effect transactions, including transactions contrary to any recommendation herein, or have positions in the securities mentioned herein or options with respect thereto. Any recommendation contained in this report may not be suitable for all investors and it is not to be deemed an offer or solicitation on our part with respect to the purchase or sale of any securities. |
|
 |
Financial and Retail Indexes Led Decliners
Kenneth J. Gruneisen - Passed the CAN SLIM® Master's Exam
Losses for the influential Retail Index ($RLX -1.98%) weighed on the major averages and the Broker/Dealer Index ($XBD -1.36%) and Bank Index ($BKX -1.30%) also created a drag on Wednesday. The Oil Services Index ($OSX -1.11%) lost ground while the Integrated Oil Index ($XOI -0.35%) showed a smaller loss. The tech sector had a slightly negative bias as the Biotechnology Index ($BTK -0.55%) and the Semiconductor Index ($SOX -0.45%) outpaced the Networking Index ($NWX -0.17%) to the downside. The Gold & Silver Index ($XAU +2.19%) was a standout gainer.
Charts courtesy www.stockcharts.com
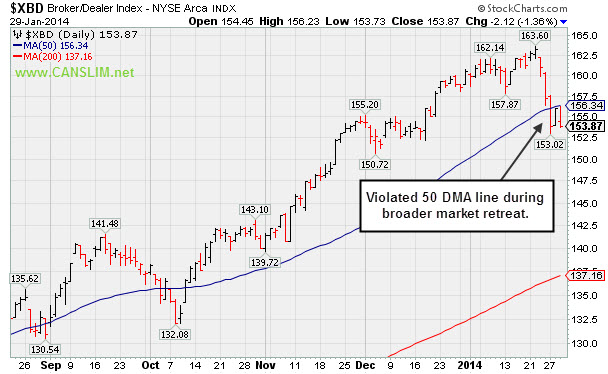
PICTURED: The Broker/Dealer Index ($XBD -1.36%) violated its 50-day moving average (DMA) line during the broader market's retreat. The Financial groups are reliable "leading indicators" for the broader market outlook so in the near-term it would be encouraging to see the XBD rebound above the 50 DMA line rather than continue deteriorating.
| Oil Services |
$OSX |
263.50 |
-2.95 |
-1.11% |
-6.24% |
| Integrated Oil |
$XOI |
1,431.69 |
-5.08 |
-0.35% |
-4.75% |
| Semiconductor |
$SOX |
525.14 |
-2.40 |
-0.45% |
-1.85% |
| Networking |
$NWX |
332.61 |
-0.57 |
-0.17% |
+2.68% |
| Broker/Dealer |
$XBD |
153.87 |
-2.12 |
-1.36% |
-4.17% |
| Retail |
$RLX |
876.98 |
-17.76 |
-1.98% |
-6.68% |
| Gold & Silver |
$XAU |
93.15 |
+2.00 |
+2.19% |
+10.70% |
| Bank |
$BKX |
67.65 |
-0.89 |
-1.30% |
-2.32% |
| Biotech |
$BTK |
2,503.84 |
-13.94 |
-0.55% |
+7.44% |
|
|
|
 |
Violation of 50-Day Average After Failing to Trigger New Buy Signal
Kenneth J. Gruneisen - Passed the CAN SLIM® Master's Exam
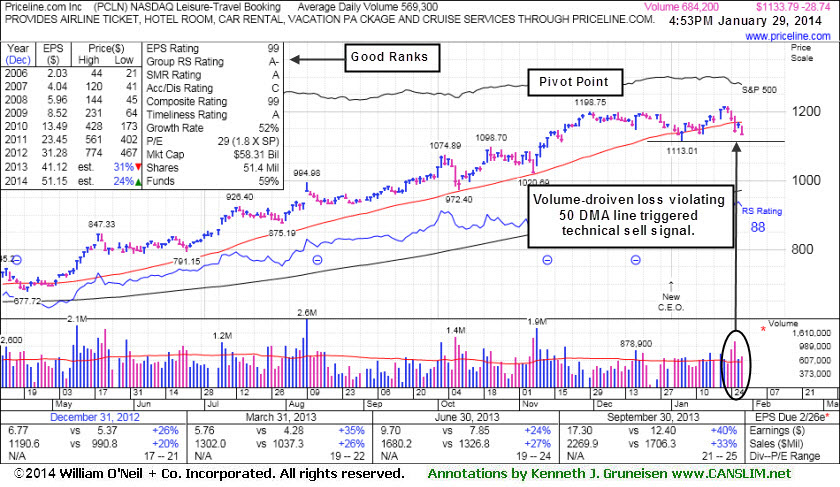
Priceline.com Inc (PCLN -$28.74 or -2.47% to $1,133.79) slumped further below its 50-day moving average (DMA) line today after volume-driven losses raised recent concerns. Its color code was changed to green and PCLN did not trigger a technical buy signal since recently featured in yellow. A subsequent violation of the prior low ($1,113.01 on 1/06/14) would raise greater concerns and may trigger a more worrisome technical sell signal. Disciplined investors watch for a proper technical buy signal before taking action and always limit losses if any stock falls more than -7% from their buy point.
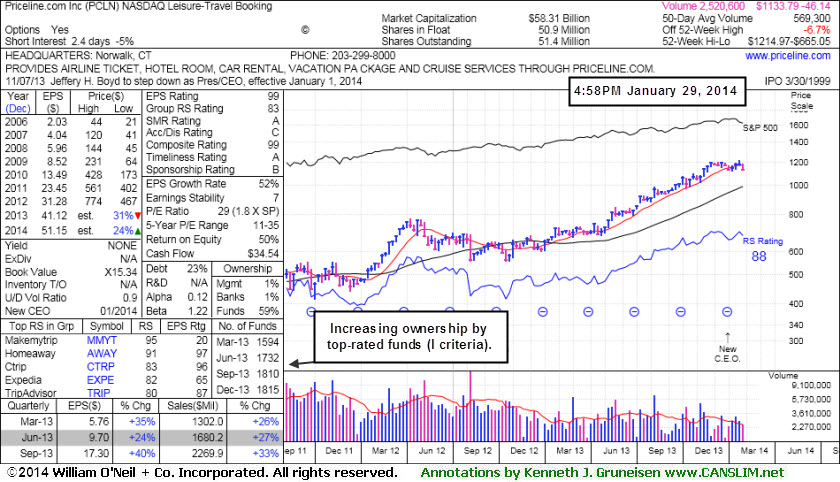
PCLN reported earnings +40% on +33% sales revenues for the Sep '13 quarter versus the year-ago period, above the +25% minimum earnings guideline (C criteria) and improving after a slightly sub par Jun '13 report. The Leisure - Travel Booking firm has earned great ranks, including the highest possible rating of 99 for earnings Per Share (EPS). Its strong annual earnings history satisfies the A criteria.
Keep in mind, the investment system's biggest winning models were typically held by at least a few mutual funds and attracting many others. However, once a stock is very heavily owned by a long list of mutual funds, as is now the case with PCLN, investors should be especially cautious and alert for any technical sell signals or fundamental disappointments which could prompt a rush for the exits. The number of top-rated funds owning its shares rose from 1,594 in Mar '13 to 1,815 in Dec '13, and increasing interest is an encouraging sign concerning the I criteria.
|
|
|
Color Codes Explained :
Y - Better candidates highlighted by our
staff of experts.
G - Previously featured
in past reports as yellow but may no longer be buyable under the
guidelines.
***Last / Change / Volume data in this table is the closing quote data***
Symbol/Exchange
Company Name
Industry Group |
PRICE |
CHANGE
(%Change) |
Day High |
Volume
(% DAV)
(% 50 day avg vol) |
52 Wk Hi
% From Hi |
Featured
Date |
Price
Featured |
Pivot Featured |
|
Max Buy |
CELG
-
NASDAQ
Celgene Corp
DRUGS - Drug Manufacturers - Major
|
$158.46
|
-1.52
-0.95% |
$161.19
|
2,768,135
102.95% of 50 DAV
50 DAV is 2,688,700
|
$174.66
-9.28%
|
9/12/2013
|
$149.50
|
PP = $150.02
|
|
MB = $157.52
|
Most Recent Note - 1/27/2014 12:15:14 PM
G - Down considerably today undercutting prior lows in the $157 area raising greater concerns. Violated its 50 DMA line on the prior session triggering technical sell signals.
>>> FEATURED STOCK ARTICLE : Found Support Above 50-Day Average After Gapping Down on Prior Session - 1/7/2014
View all notes |
Set NEW NOTE alert |
CANSLIM.net Company Profile |
SEC
News |
Chart |
Request a new note
C
A N
S L
I M


|
EGOV
-
NASDAQ
N I C Inc
INTERNET - Internet Software and Services
|
$21.82
|
-0.23
-1.04% |
$22.20
|
269,524
106.49% of 50 DAV
50 DAV is 253,100
|
$25.99
-16.04%
|
12/20/2013
|
$24.00
|
PP = $26.09
|
|
MB = $27.39
|
Most Recent Note - 1/28/2014 5:15:24 PM
G - Slumped further below its 50 DMA line today on higher volume and undercut the recent low ($22.17 on 12/16/13) raising greater concerns. Its Relative Strength (RS) rating has fallen to 67, below the 80+ minimum guideline for buy candidates. A rally above recent resistance in the $25-26 area is needed for its technical stance to turn bullish. See the latest FSU analysis for more details and new annotated graphs.
>>> FEATURED STOCK ARTICLE : Relative Strength Rating Wanes While Slumping on Higher Volume - 1/28/2014
View all notes |
Set NEW NOTE alert |
CANSLIM.net Company Profile |
SEC
News |
Chart |
Request a new note
C
A N
S L
I M
|
EQM
-
NYSE
E Q T Midstream Partners
ENERGY - Oil and Gas Pipelines
|
$62.83
|
+0.70
1.13% |
$63.39
|
52,001
48.60% of 50 DAV
50 DAV is 107,000
|
$63.66
-1.30%
|
12/12/2013
|
$53.17
|
PP = $56.51
|
|
MB = $59.34
|
Most Recent Note - 1/24/2014 4:19:48 PM
G - Stubbornly holding its ground while very extended from any sound base pattern. Prior highs in the $56 area define support to watch on pullbacks.
>>> FEATURED STOCK ARTICLE : Extended From Base After Six Consecutive Weekly Gains - 1/17/2014
View all notes |
Set NEW NOTE alert |
CANSLIM.net Company Profile |
SEC
News |
Chart |
Request a new note
C
A N
S L
I M
|
FB
-
NASDAQ
Facebook Inc Cl A
INTERNET
|
$53.53
|
-1.61
-2.92% |
$54.95
|
92,213,169
144.20% of 50 DAV
50 DAV is 63,948,100
|
$59.31
-9.75%
|
12/12/2013
|
$51.40
|
PP = $54.93
|
|
MB = $57.68
|
 Most Recent Note - 1/29/2014 5:59:20 PM
G - Down today on above average volume testing support at its 50 DMA line. Disciplined investors always limit losses by selling any stock that falls more than -7% from their purchase price.
>>> FEATURED STOCK ARTICLE : Following New Offering Prior Highs Acted As Support - 1/15/2014
View all notes |
Set NEW NOTE alert |
CANSLIM.net Company Profile |
SEC
News |
Chart |
Request a new note
C
A N
S L
I M
|
JAZZ
-
NASDAQ
Jazz Pharmaceuticals Plc
DRUGS - Biotechnology
|
$151.62
|
+0.18
0.12% |
$154.22
|
1,047,790
134.30% of 50 DAV
50 DAV is 780,200
|
$159.14
-4.73%
|
9/30/2013
|
$93.20
|
PP = $89.10
|
|
MB = $93.56
|
Most Recent Note - 1/28/2014 12:52:33 PM
G - Rebounding toward its 52-week high with a gap up gain today following 2 consecutive big losses on above average volume. Its 50 DMA line ($125.973 now) defines important support to watch on pullbacks.
>>> FEATURED STOCK ARTICLE : Very Extended From Sound Base Following Big Volume-Driven Gains - 1/14/2014
View all notes |
Set NEW NOTE alert |
CANSLIM.net Company Profile |
SEC
News |
Chart |
Request a new note
C
A N
S L
I M
|
Symbol/Exchange
Company Name
Industry Group |
PRICE |
CHANGE
(%Change) |
Day High |
Volume
(% DAV)
(% 50 day avg vol) |
52 Wk Hi
% From Hi |
Featured
Date |
Price
Featured |
Pivot Featured |
|
Max Buy |
KORS
-
NYSE
Michael Kors Hldgs Ltd
RETAIL - Apparel Stores
|
$78.74
|
-3.11
-3.80% |
$81.70
|
3,964,956
94.45% of 50 DAV
50 DAV is 4,197,800
|
$84.58
-6.90%
|
8/6/2013
|
$69.66
|
PP = $66.28
|
|
MB = $69.59
|
Most Recent Note - 1/29/2014 3:13:27 PM
G - Slumping back below its 50 DMA line today. Recent losses on higher volume indicated distributional pressure. Reports quarterly financial results on Tuesday, February 4, 2014, before the market opens.
>>> FEATURED STOCK ARTICLE : Technical Deterioration and RS Rating Slump Raises Concerns - 1/9/2014
View all notes |
Set NEW NOTE alert |
CANSLIM.net Company Profile |
SEC
News |
Chart |
Request a new note
C
A N
S L
I M
|
MRLN
-
NASDAQ
Marlin Business Services
DIVERSIFIED SERVICES - Rental and Leasing Services
|
$25.84
|
-0.66
-2.49% |
$26.58
|
22,287
69.65% of 50 DAV
50 DAV is 32,000
|
$29.58
-12.64%
|
12/19/2013
|
$26.69
|
PP = $28.74
|
|
MB = $30.18
|
Most Recent Note - 1/29/2014 6:01:52 PM
Y - Down today on lighter volume, finishing at the session low with a 4th consecutive loss. Slumped near its 50 DMA line where a violation would raise more serious concerns. Disciplined investor always limit losses by selling any stock that falls more than -7% from their purchase price.
>>> FEATURED STOCK ARTICLE : Hovering Near 52-Week High Following Technical Breakout - 1/22/2014
View all notes |
Set NEW NOTE alert |
CANSLIM.net Company Profile |
SEC
News |
Chart |
Request a new note
C
A N
S L
I M
|
PCLN
-
NASDAQ
Priceline.Com Inc
INTERNET - Internet Software and Services
|
$1,133.79
|
-28.74
-2.47% |
$1,157.70
|
684,790
115.81% of 50 DAV
50 DAV is 591,300
|
$1,214.97
-6.68%
|
12/18/2013
|
$1,156.20
|
PP = $1,198.85
|
|
MB = $1,258.79
|
Most Recent Note - 1/29/2014 5:57:38 PM
G - Slumped further below its 50 DMA line today with slightly higher volume. Prior low ($1,113.01 on 1/06/13) defines near-term support to watch. See the latest FSU analysis for more details and new annotated graphs.
>>> FEATURED STOCK ARTICLE : Violation of 50-Day Average After Failing to Trigger New Buy Signal - 1/29/2014
View all notes |
Set NEW NOTE alert |
CANSLIM.net Company Profile |
SEC
News |
Chart |
Request a new note
C
A N
S L
I M
|
RGR
-
NYSE
Sturm Ruger & Co Inc
CONSUMER DURABLES - Sporting Goods
|
$73.81
|
-1.37
-1.82% |
$75.89
|
346,689
102.12% of 50 DAV
50 DAV is 339,500
|
$85.93
-14.10%
|
1/8/2014
|
$78.87
|
PP = $80.38
|
|
MB = $84.40
|
Most Recent Note - 1/24/2014 4:12:59 PM
G- Violated its 50 DMA line with today's loss on higher volume triggering a technical sell signal. Color code is changed to green. A prompt rebound above the 50 DMA line is needed for its outlook to improve. Disciplined investors always limit losses by selling any stock if it falls more than -7% from their purchase price."
>>> FEATURED STOCK ARTICLE : Hit New Highs With 6th Consecutive Gain - 1/13/2014
View all notes |
Set NEW NOTE alert |
CANSLIM.net Company Profile |
SEC
News |
Chart |
Request a new note
C
A N
S L
I M
|
SFUN
-
NYSE
Soufun Hldgs Ltd Ads A
INTERNET - Internet Information Providers
|
$80.43
|
-1.05
-1.29% |
$83.58
|
1,139,084
97.32% of 50 DAV
50 DAV is 1,170,400
|
$95.39
-15.68%
|
10/17/2013
|
$58.02
|
PP = $53.87
|
|
MB = $56.56
|
Most Recent Note - 1/28/2014 1:51:10 PM
G - Gain today halted its slide at its 50 DMA line after 3 consecutive volume-driven losses.Very extended from any sound base, and its 50 DMA line ($77.60 now) defines important support to watch.
>>> FEATURED STOCK ARTICLE : Extended From Base Following More Volume-Driven Gains - 1/10/2014
View all notes |
Set NEW NOTE alert |
CANSLIM.net Company Profile |
SEC
News |
Chart |
Request a new note
C
A N
S L
I M
|
Symbol/Exchange
Company Name
Industry Group |
PRICE |
CHANGE
(%Change) |
Day High |
Volume
(% DAV)
(% 50 day avg vol) |
52 Wk Hi
% From Hi |
Featured
Date |
Price
Featured |
Pivot Featured |
|
Max Buy |
SILC
-
NASDAQ
Silicom Ltd
COMPUTER HARDWARE - Networking andamp; Communication Dev
|
$62.04
|
+0.26
0.42% |
$62.24
|
66,412
193.06% of 50 DAV
50 DAV is 34,400
|
$63.91
-2.93%
|
12/23/2013
|
$44.62
|
PP = $46.25
|
|
MB = $48.56
|
Most Recent Note - 1/29/2014 2:40:53 PM
G - Hovering near its 52-week high today, extended from any sound base. Stubbornly holding its ground since a considerable gap up on 1/23/14 after reporting earnings +92% on +52% sales for the Dec '13 quarter, beating consensus estimates.
>>> FEATURED STOCK ARTICLE : Considerable Gap Up Following Strong Earnings Report - 1/23/2014
View all notes |
Set NEW NOTE alert |
CANSLIM.net Company Profile |
SEC
News |
Chart |
Request a new note
C
A N
S L
I M
|
SSNC
-
NASDAQ
S S & C Technologies
COMPUTER SOFTWARE and SERVICES - Application Software
|
$39.40
|
-2.41
-5.76% |
$41.33
|
537,279
204.13% of 50 DAV
50 DAV is 263,200
|
$46.61
-15.46%
|
10/22/2013
|
$39.17
|
PP = $40.04
|
|
MB = $42.04
|
Most Recent Note - 1/29/2014 3:12:07 PM
G- Gapped down today, raising greater concerns while slumping further below its 50 DMA line with above average volume behind its damaging 4th consecutive loss. A rebound above the 50 DMA line is needed for its outlook improve.
>>> FEATURED STOCK ARTICLE : Enduring Distributional Pressure While Retreating Near Prior Highs - 1/16/2014
View all notes |
Set NEW NOTE alert |
CANSLIM.net Company Profile |
SEC
News |
Chart |
Request a new note
C
A N
S L
I M
|
ULTI
-
NASDAQ
Ultimate Software Group
INTERNET - Internet Software and Services
|
$155.87
|
-0.45
-0.29% |
$158.20
|
190,894
140.57% of 50 DAV
50 DAV is 135,800
|
$162.88
-4.30%
|
1/27/2014
|
$153.75
|
PP = $162.98
|
|
MB = $171.13
|
Most Recent Note - 1/27/2014 6:55:04 PM
Y - Color code is changed to yellow with new pivot point cited based on its 10/30/13 high plus 10 cents. Enduring distributional pressure while trading near its 50 DMA line. See the latest FSU analysis for more details and new annotated daily and weekly graphs.
>>> FEATURED STOCK ARTICLE : Forming New Base But Enduring Distributional Pressure - 1/27/2014
View all notes |
Set NEW NOTE alert |
CANSLIM.net Company Profile |
SEC
News |
Chart |
Request a new note
C
A N
S L
I M
|
VRX
-
NYSE
Valeant Pharmaceuticals
DRUGS - Drug Manufacturers - Other
|
$132.80
|
+0.00
0.00% |
$134.58
|
920,876
79.72% of 50 DAV
50 DAV is 1,155,100
|
$140.36
-5.39%
|
9/11/2013
|
$100.26
|
PP = $105.50
|
|
MB = $110.78
|
Most Recent Note - 1/28/2014 1:38:14 PM
G - Extended from any sound base and enduring mild distributional pressure for the past week. Its 50 DMA line and prior highs near $115 define near-term support to watch.
>>> FEATURED STOCK ARTICLE : Bullish Action Has Continued Despite Fundamental Concerns - 1/21/2014
View all notes |
Set NEW NOTE alert |
CANSLIM.net Company Profile |
SEC
News |
Chart |
Request a new note
C
A N
S L
I M
|
|
|
|
THESE ARE NOT BUY RECOMMENDATIONS!
Comments contained in the body of this report are technical
opinions only. The material herein has been obtained
from sources believed to be reliable and accurate, however,
its accuracy and completeness cannot be guaranteed.
This site is not an investment advisor, hence it does
not endorse or recommend any securities or other investments.
Any recommendation contained in this report may not
be suitable for all investors and it is not to be deemed
an offer or solicitation on our part with respect to
the purchase or sale of any securities. All trademarks,
service marks and trade names appearing in this report
are the property of their respective owners, and are
likewise used for identification purposes only.
This report is a service available
only to active Paid Premium Members.
You may opt-out of receiving report notifications
at any time. Questions or comments may be submitted
by writing to Premium Membership Services 665 S.E. 10 Street, Suite 201 Deerfield Beach, FL 33441-5634 or by calling 1-800-965-8307
or 954-785-1121.
|
|
|

