***Last / Change / Volume data in this table is the closing quote data***
Symbol/Exchange
Company Name
Industry Group |
PRICE |
CHANGE
(%Change) |
Day High |
Volume
(% DAV)
(% 50 day avg vol) |
52 Wk Hi
% From Hi |
Featured
Date |
Price
Featured |
Pivot Featured |
|
Max Buy |
ADS
-
NYSE
Alliance Data Sys Corp
COMPUTER SOFTWARE and SERVICES - Information and Delivery Service
|
$110.40
|
+0.20
0.18% |
$110.87
|
634,604
92.32% of 50 DAV
50 DAV is 687,400
|
$111.74
-1.20%
|
1/17/2012
|
$108.24
|
PP = $107.43
|
|
MB = $112.80
|
Most Recent Note - 1/25/2012 11:58:30 AM
Y - Inching up for another new all-time high today, on track for its 12th gain in the span of 14 sessions since finding support at its 50 DMA line.
>>> The latest Featured Stock Update with an annotated graph appeared on 1/17/2012. Click here.
View all notes |
Alert me of new notes |
CANSLIM.net Company Profile |
SEC |
Zacks Reports |
StockTalk |
News |
Chart |
Request a new note
C
A N
S L
I M


|
ALXN
-
NASDAQ
Alexion Pharmaceuticals
DRUGS - Drug Manufacturers - Other
|
$75.40
|
+0.45
0.60% |
$75.97
|
684,466
56.85% of 50 DAV
50 DAV is 1,204,000
|
$77.58
-2.81%
|
11/30/2011
|
$68.66
|
PP = $70.52
|
|
MB = $74.05
|
 Most Recent Note - 1/27/2012 4:24:31 PM
G - Gains this week lifted it above its "max buy" level and its color code is changed to green while getting extended from its prior base. Prior resistance in the $70 area defines initial chart support above its 50 DMA line.
>>> The latest Featured Stock Update with an annotated graph appeared on 1/13/2012. Click here.
View all notes |
Alert me of new notes |
CANSLIM.net Company Profile |
SEC |
Zacks Reports |
StockTalk |
News |
Chart |
Request a new note
C
A N
S L
I M
|
BODY
-
NASDAQ
Body Central Corp
RETAIL - Catalog andamp; Mail Order Houses
|
$26.81
|
+0.98
3.79% |
$27.10
|
269,630
205.20% of 50 DAV
50 DAV is 131,400
|
$26.98
-0.63%
|
1/27/2012
|
$26.69
|
PP = $25.46
|
|
MB = $26.73
|
Most Recent Note - 1/27/2012 4:28:31 PM
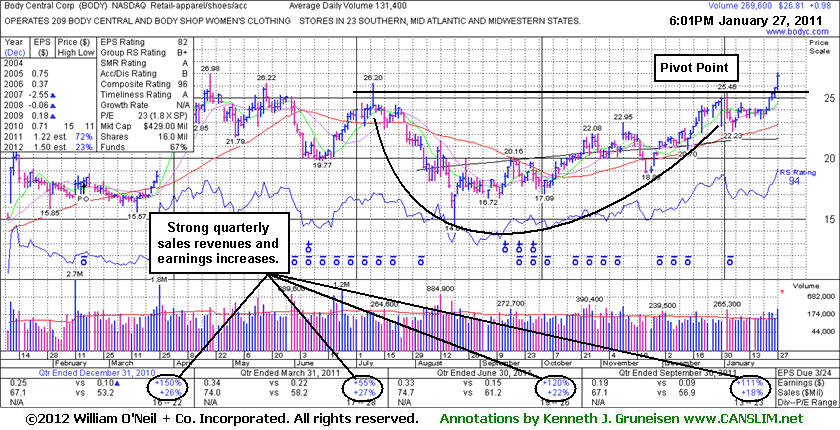
Y - Volume was 2 times average today as its 5th consecutive gain helped it hit a new 52-week high while rallying from a cup-with-handle type base pattern. It was featured in yellow in the mid-day report (read here) with pivot point based on its 1/03/12 high. Quarterly sames revenues and earnings increases have been strong through Sep '11, satisfying the C criteria. The 52-week high was hit when noted in the 4/20/11 mid-day report as it reversed into the red - "Held its ground and continued rising after a considerable "breakaway gap" on 3/25/11. It completed an additional Public Offering on 2/16/11 and found support near prior chart highs following a slump below its 50 DMA line in the interim since noted in the 1/13/11 mid-day report. Limited history is a concern, and it is up considerably since its $13 IPO on 10/15/10."
>>> The latest Featured Stock Update with an annotated graph appeared on 1/27/2012. Click here.
View all notes |
Alert me of new notes |
CANSLIM.net Company Profile |
SEC |
Zacks Reports |
StockTalk |
News |
Chart |
Request a new note
C
A N
S L
I M
|
CATM
-
NASDAQ
Cardtronics Inc
DIVERSIFIED SERVICES - Business/Management Services
|
$26.73
|
-0.20
-0.74% |
$27.00
|
246,605
73.75% of 50 DAV
50 DAV is 334,400
|
$28.74
-6.99%
|
12/23/2011
|
$28.64
|
PP = $28.56
|
|
MB = $29.99
|
Most Recent Note - 1/27/2012 4:32:12 PM
Y - Still perched within striking distance of its 52-week high. Quietly consolidating above its 50 DMA line following 3 consecutive small losses on below average volume. Violations of its 50 DMA and recent low ($25.52 on 1/13/12) would raise concerns and trigger technical sell signals.
>>> The latest Featured Stock Update with an annotated graph appeared on 12/23/2011. Click here.
View all notes |
Alert me of new notes |
CANSLIM.net Company Profile |
SEC |
Zacks Reports |
StockTalk |
News |
Chart |
Request a new note
C
A N
S L
I M
|
CELG
-
NASDAQ
Celgene Corp
DRUGS - Drug Manufacturers - Major
|
$73.37
|
+0.71
0.98% |
$73.75
|
3,473,094
100.33% of 50 DAV
50 DAV is 3,461,700
|
$75.11
-2.32%
|
12/20/2011
|
$66.68
|
PP = $68.35
|
|
MB = $71.77
|
Most Recent Note - 1/27/2012 4:33:59 PM
G - Overcame early weakness today and managed a positive reversal. Holding its ground near its 52-week high and trading within close striking distance of its all-time high ($77.39 in Aug '08). Prior highs in the $68 area define support to watch on pullbacks.
>>> The latest Featured Stock Update with an annotated graph appeared on 12/29/2011. Click here.
View all notes |
Alert me of new notes |
CANSLIM.net Company Profile |
SEC |
Zacks Reports |
StockTalk |
News |
Chart |
Request a new note
C
A N
S L
I M
|
Symbol/Exchange
Company Name
Industry Group |
PRICE |
CHANGE
(%Change) |
Day High |
Volume
(% DAV)
(% 50 day avg vol) |
52 Wk Hi
% From Hi |
Featured
Date |
Price
Featured |
Pivot Featured |
|
Max Buy |
FEIC
-
NASDAQ
F E I Co
ELECTRONICS - Diversified Electronics
|
$44.89
|
-0.07
-0.16% |
$45.08
|
158,503
59.10% of 50 DAV
50 DAV is 268,200
|
$45.85
-2.09%
|
12/7/2011
|
$41.41
|
PP = $42.35
|
|
MB = $44.47
|
Most Recent Note - 1/27/2012 4:35:48 PM
G - Quietly hovering near its all-time high, slightly extended from its prior base. No overhead supply remains to hinder its upward progress. Prior highs in the $43 area define initial chart support.
>>> The latest Featured Stock Update with an annotated graph appeared on 1/25/2012. Click here.
View all notes |
Alert me of new notes |
CANSLIM.net Company Profile |
SEC |
Zacks Reports |
StockTalk |
News |
Chart |
Request a new note
C
A N
S L
I M
|
GNC
-
NYSE
G N C Holdings Inc
RETAIL - Drug Stores
|
$26.54
|
+0.19
0.72% |
$27.12
|
1,731,390
162.56% of 50 DAV
50 DAV is 1,065,100
|
$29.67
-10.55%
|
1/19/2012
|
$28.99
|
PP = $29.60
|
|
MB = $31.08
|
Most Recent Note - 1/27/2012 4:39:33 PM
G - Halted its slide and managed a positive reversal today. On the prior session its damaging 50 DMA line violation raised concerns and triggered a sell signal with volume above average behind its 3rd consecutive loss. A rebound above its 50 DMA line is needed for its outlook to improve.
>>> The latest Featured Stock Update with an annotated graph appeared on 1/19/2012. Click here.
View all notes |
Alert me of new notes |
CANSLIM.net Company Profile |
SEC |
Zacks Reports |
StockTalk |
News |
Chart |
Request a new note
C
A N
S L
I M
|
HMSY
-
NASDAQ
H M S Holdings Corp
COMPUTER SOFTWARE and SERVICES - Healthcare Information Service
|
$33.08
|
+0.27
0.82% |
$33.65
|
288,907
32.56% of 50 DAV
50 DAV is 887,300
|
$34.73
-4.75%
|
10/27/2011
|
$26.44
|
PP = $28.37
|
|
MB = $29.79
|
Most Recent Note - 1/27/2012 4:42:10 PM
G - Volume totals have been cooling while perched near its all-time high. No resistance remains to hinder its progress, but it is extended from its prior base. Its 50 DMA line and prior highs near $32 define near-term chart support to watch.
>>> The latest Featured Stock Update with an annotated graph appeared on 12/28/2011. Click here.
View all notes |
Alert me of new notes |
CANSLIM.net Company Profile |
SEC |
Zacks Reports |
StockTalk |
News |
Chart |
Request a new note
C
A N
S L
I M
|
ISRG
-
NASDAQ
Intuitive Surgical Inc
HEALTH SERVICES - Medical Appliances and Equipment
|
$459.00
|
+2.62
0.57% |
$461.59
|
209,278
58.33% of 50 DAV
50 DAV is 358,800
|
$476.49
-3.67%
|
12/20/2011
|
$442.43
|
PP = $449.16
|
|
MB = $471.62
|
Most Recent Note - 1/25/2012 5:05:26 PM
Y - Posted a solid gain on higher volume today and rallied up above its 50 DMA line. Reported earnings +24% on +28% sales revenues for the quarter ended December 31, 2011 versus the year ago period.
>>> The latest Featured Stock Update with an annotated graph appeared on 1/18/2012. Click here.
View all notes |
Alert me of new notes |
CANSLIM.net Company Profile |
SEC |
Zacks Reports |
StockTalk |
News |
Chart |
Request a new note
C
A N
S L
I M
|
LULU
-
NASDAQ
Lululemon Athletica
MANUFACTURING - Textile Manufacturing
|
$64.12
|
+1.14
1.81% |
$64.46
|
1,578,967
40.14% of 50 DAV
50 DAV is 3,933,300
|
$64.51
-0.60%
|
1/10/2012
|
$60.97
|
PP = $59.46
|
|
MB = $62.43
|
Most Recent Note - 1/27/2012 4:45:06 PM
G - Today's gain on below average volume lifted it to a best-ever close. Rallied above its "max buy" level this week, and no resistance remains due to overhead supply.
>>> The latest Featured Stock Update with an annotated graph appeared on 1/10/2012. Click here.
View all notes |
Alert me of new notes |
CANSLIM.net Company Profile |
SEC |
Zacks Reports |
StockTalk |
News |
Chart |
Request a new note
C
A N
S L
I M
|
Symbol/Exchange
Company Name
Industry Group |
PRICE |
CHANGE
(%Change) |
Day High |
Volume
(% DAV)
(% 50 day avg vol) |
52 Wk Hi
% From Hi |
Featured
Date |
Price
Featured |
Pivot Featured |
|
Max Buy |
MA
-
NYSE
Mastercard Inc Cl A
DIVERSIFIED SERVICES - Business/Management Services
|
$348.79
|
+0.96
0.28% |
$351.70
|
724,219
71.42% of 50 DAV
50 DAV is 1,014,000
|
$384.99
-9.40%
|
1/3/2012
|
$367.87
|
PP = $385.09
|
|
MB = $404.34
|
Most Recent Note - 1/25/2012 5:48:27 PM
G - Up today with below average volume. Its 200 DMA line is the nearest support level to watch. A rebound above its 50 DMA line is needed, otherwise its technical stance is not that of a sound looking buy candidate.
>>> The latest Featured Stock Update with an annotated graph appeared on 1/3/2012. Click here.
View all notes |
Alert me of new notes |
CANSLIM.net Company Profile |
SEC |
Zacks Reports |
StockTalk |
News |
Chart |
Request a new note
C
A N
S L
I M
|
MKTX
-
NASDAQ
Marketaxess Holdings Inc
FINANCIAL SERVICES - Investment Brokerage - Nationa
|
$31.14
|
+0.14
0.45% |
$31.23
|
109,797
63.69% of 50 DAV
50 DAV is 172,400
|
$32.23
-3.38%
|
10/28/2011
|
$29.79
|
PP = $31.05
|
|
MB = $32.60
|
Most Recent Note - 1/27/2012 4:47:57 PM
Y - Volume totals have been below average in recent weeks while hovering near its all-time high. No resistance remains due to overhead supply. The 50 DMA line defines initial chart support to watch.
>>> The latest Featured Stock Update with an annotated graph appeared on 1/24/2012. Click here.
View all notes |
Alert me of new notes |
CANSLIM.net Company Profile |
SEC |
Zacks Reports |
StockTalk |
News |
Chart |
Request a new note
C
A N
S L
I M
|
OSIS
-
NASDAQ
O S I Systems Inc
ELECTRONICS - Semiconductor Equipment and Mate
|
$54.31
|
-0.11
-0.20% |
$54.63
|
87,316
85.69% of 50 DAV
50 DAV is 101,900
|
$57.51
-5.56%
|
11/1/2011
|
$42.07
|
PP = $45.57
|
|
MB = $47.85
|
Most Recent Note - 1/26/2012 12:48:07 PM
G - Hovering near its all-time highs. Reported earnings +20% on +11% sales revenues for the quarter ended December 31, 2011 versus the year ago period. Results below the +25% minimum earnings guideline, and marking its weakest earnings comparison in 2 years, raised concerns. Its 50 DMA line defines important support to watch.
>>> The latest Featured Stock Update with an annotated graph appeared on 12/27/2011. Click here.
View all notes |
Alert me of new notes |
CANSLIM.net Company Profile |
SEC |
Zacks Reports |
StockTalk |
News |
Chart |
Request a new note
C
A N
S L
I M
|
PRGO
-
NASDAQ
Perrigo Co
DRUGS - Drug Related Products
|
$96.10
|
-0.03
-0.03% |
$96.53
|
1,068,817
84.19% of 50 DAV
50 DAV is 1,269,500
|
$104.70
-8.21%
|
12/9/2011
|
$99.54
|
PP = $101.56
|
|
MB = $106.64
|
Most Recent Note - 1/26/2012 4:04:13 PM
G - Slumped below its 50 DMA line today, raising some concerns. Prior lows near $94 define support above its 200 DMA line. It is now -8.2% off its 52-week high with little resistance remaining due to overhead supply.
>>> The latest Featured Stock Update with an annotated graph appeared on 1/9/2012. Click here.
View all notes |
Alert me of new notes |
CANSLIM.net Company Profile |
SEC |
Zacks Reports |
StockTalk |
News |
Chart |
Request a new note
C
A N
S L
I M
|
RAX
-
NYSE
Rackspace Hosting Inc
INTERNET - Internet Software and; Services
|
$43.69
|
+0.71
1.65% |
$43.95
|
1,176,938
79.16% of 50 DAV
50 DAV is 1,486,700
|
$46.50
-6.03%
|
11/8/2011
|
$44.28
|
PP = $46.27
|
|
MB = $48.58
|
Most Recent Note - 1/26/2012 4:05:58 PM
G - Still quietly consolidating near its 50 DMA line. Its recent low ($41.37 on 1/09/12) defines important near-term support to watch above its 200 DMA line.
>>> The latest Featured Stock Update with an annotated graph appeared on 1/5/2012. Click here.
View all notes |
Alert me of new notes |
CANSLIM.net Company Profile |
SEC |
Zacks Reports |
StockTalk |
News |
Chart |
Request a new note
C
A N
S L
I M
|
Symbol/Exchange
Company Name
Industry Group |
PRICE |
CHANGE
(%Change) |
Day High |
Volume
(% DAV)
(% 50 day avg vol) |
52 Wk Hi
% From Hi |
Featured
Date |
Price
Featured |
Pivot Featured |
|
Max Buy |
SWI
-
NYSE
Solarwinds Inc
COMPUTER SOFTWARE and SERVICES - Application Software
|
$31.68
|
+0.35
1.12% |
$31.77
|
475,743
47.89% of 50 DAV
50 DAV is 993,500
|
$33.68
-5.94%
|
1/26/2012
|
$32.36
|
PP = $33.78
|
|
MB = $35.47
|
Most Recent Note - 1/26/2012 5:16:08 PM
Y - Closed near the session low today, a sign it was encountering some resistance due to overhead supply. It is perched above its 50 DMA line and just -7.5% off its 52-week high after an 8-week consolidation. In the mid-day report earlier it was highlighted in yellow with a new pivot point cited based on its 52-week high plus 10 cents. It has shown resilience since dropped from the Featured Stocks list on 1/04/12. Disciplined investors may watch for a fresh burst of institutional buying to confirm a new technical buy signal. See the latest FSU analysis for more details and a new annotated weekly graph.
>>> The latest Featured Stock Update with an annotated graph appeared on 1/26/2012. Click here.
View all notes |
Alert me of new notes |
CANSLIM.net Company Profile |
SEC |
Zacks Reports |
StockTalk |
News |
Chart |
Request a new note
C
A N
S L
I M
|
SXCI
-
NASDAQ
S X C Health Solutions
COMPUTER SOFTWARE and SERVICES - Healthcare Information Service
|
$62.13
|
-0.72
-1.15% |
$63.10
|
168,340
44.36% of 50 DAV
50 DAV is 379,500
|
$66.40
-6.43%
|
1/10/2012
|
$62.05
|
PP = $60.10
|
|
MB = $63.11
|
Most Recent Note - 1/27/2012 4:51:48 PM
Y - Still stubbornly holding its ground above its pivot point and below the "max buy" level. Volume totals have been cooling, indicating that few investors are rushing to the exit after its latest surge to its July '11 highs.
>>> The latest Featured Stock Update with an annotated graph appeared on 1/20/2012. Click here.
View all notes |
Alert me of new notes |
CANSLIM.net Company Profile |
SEC |
Zacks Reports |
StockTalk |
News |
Chart |
Request a new note
C
A N
S L
I M
|
TDG
-
NYSE
Transdigm Group Inc
AEROSPACE/DEFENSE - Aerospace/Defense Products and; Services
|
$101.36
|
-0.47
-0.46% |
$101.71
|
184,995
55.32% of 50 DAV
50 DAV is 334,400
|
$103.18
-1.76%
|
1/10/2012
|
$98.83
|
PP = $102.83
|
|
MB = $107.97
|
Most Recent Note - 1/27/2012 4:53:23 PM
Y - Held its ground since its 1/23/12 gain with above average volume while challenging its 52-week high and approaching its pivot point. No overhead supply remains to act as resistance Recent lows in the $92 area define the next important support level to watch if it slumps below its 50 DMA line.
>>> The latest Featured Stock Update with an annotated graph appeared on 1/4/2012. Click here.
View all notes |
Alert me of new notes |
CANSLIM.net Company Profile |
SEC |
Zacks Reports |
StockTalk |
News |
Chart |
Request a new note
C
A N
S L
I M
|
TSCO
-
NASDAQ
Tractor Supply Co
SPECIALTY RETAIL - Specialty Retail, Other
|
$80.42
|
+0.58
0.73% |
$80.95
|
340,855
48.69% of 50 DAV
50 DAV is 700,000
|
$81.98
-1.90%
|
1/12/2012
|
$79.12
|
PP = $75.58
|
|
MB = $79.36
|
Most Recent Note - 1/26/2012 5:18:49 PM
G - Holding its ground in a tight range for more than 2 weeks with volume totals cooling while perched at its all-time high. Prior highs in the mid-$70s which were a resistance area now define initial support to watch on pullbacks.
>>> The latest Featured Stock Update with an annotated graph appeared on 1/12/2012. Click here.
View all notes |
Alert me of new notes |
CANSLIM.net Company Profile |
SEC |
Zacks Reports |
StockTalk |
News |
Chart |
Request a new note
C
A N
S L
I M
|
UBNT
-
NASDAQ
Ubiquiti Networks Inc
TELECOMMUNICATIONS - Diversified Communication Serv
|
$22.56
|
+1.56
7.43% |
$22.73
|
261,854
115.25% of 50 DAV
50 DAV is 227,200
|
$23.04
-2.08%
|
1/27/2012
|
$22.25
|
PP = $23.14
|
|
MB = $24.30
|
Most Recent Note - 1/27/2012 1:35:45 PM
Y - Color code is changed to yellow with pivot point cited based on its 52-week high plus 10 cents. Gain today has it nearly challenging its 52-week high, but disciplined investors would watch for a proper technical buy signal before taking action. Quarterly earnings in ceases have been strong through Sep '11. Limited trading history is a concern, yet it has built a sound base pattern since last noted 11/11/11 shortly after its 10/14/11 IPO at $15.
There are no Featured Stock Updates™ available for this stock at this time. You may request one by clicking the Request a New Note link below
View all notes |
Alert me of new notes |
CANSLIM.net Company Profile |
SEC |
Zacks Reports |
StockTalk |
News |
Chart |
Request a new note
C
A N
S L
I M
|
Symbol/Exchange
Company Name
Industry Group |
PRICE |
CHANGE
(%Change) |
Day High |
Volume
(% DAV)
(% 50 day avg vol) |
52 Wk Hi
% From Hi |
Featured
Date |
Price
Featured |
Pivot Featured |
|
Max Buy |
ULTA
-
NASDAQ
Ulta Salon Cosm & Frag
SPECIALTY RETAIL - Specialty Retail, Other
|
$77.31
|
+0.62
0.81% |
$77.68
|
442,137
47.69% of 50 DAV
50 DAV is 927,200
|
$79.64
-2.93%
|
1/11/2012
|
$71.97
|
PP = $75.80
|
|
MB = $79.59
|
Most Recent Note - 1/26/2012 5:21:20 PM
Y - Negative reversal today after touching another new all-time high. Recently wedged up from a riskier late-stage base without sufficient volume to trigger a proper technical buy signal. Prior lows near $64 define important chart support above its 200 DMA line.
>>> The latest Featured Stock Update with an annotated graph appeared on 1/11/2012. Click here.
View all notes |
Alert me of new notes |
CANSLIM.net Company Profile |
SEC |
Zacks Reports |
StockTalk |
News |
Chart |
Request a new note
C
A N
S L
I M
|
V
-
NYSE
Visa Inc Cl A
DIVERSIFIED SERVICES - Business/Management Services
|
$101.05
|
+0.19
0.19% |
$101.53
|
2,840,635
74.99% of 50 DAV
50 DAV is 3,788,200
|
$104.20
-3.02%
|
10/24/2011
|
$94.21
|
PP = $94.85
|
|
MB = $99.59
|
Most Recent Note - 1/26/2012 5:25:02 PM
G - It has posted gains on lighter volume following its negative reversal after touching a new all-time high on 1/19/12 when last noted - "No overhead supply remains to act as resistance. Its recent low ($98.33 on 1/11/12) and its 50 DMA line define chart support to watch on pullbacks. "
>>> The latest Featured Stock Update with an annotated graph appeared on 1/23/2012. Click here.
View all notes |
Alert me of new notes |
CANSLIM.net Company Profile |
SEC |
Zacks Reports |
StockTalk |
News |
Chart |
Request a new note
C
A N
S L
I M
|