You are not logged in.
This means you
CAN ONLY VIEW reports that were published prior to Sunday, April 6, 2025.
You
MUST UPGRADE YOUR MEMBERSHIP if you want to see any current reports.
AFTER MARKET UPDATE - THURSDAY, JANUARY 26TH, 2012
Previous After Market Report Next After Market Report >>>
|
|
|
|
DOW |
-22.33 |
12,734.63 |
-0.18% |
|
Volume |
866,661,270 |
+4% |
|
Volume |
1,973,902,160 |
+5% |
|
NASDAQ |
-13.03 |
2,805.28 |
-0.46% |
|
Advancers |
1,460 |
47% |
|
Advancers |
1,136 |
43% |
|
S&P 500 |
-7.61 |
1,318.45 |
-0.57% |
|
Decliners |
1,545 |
50% |
|
Decliners |
1,377 |
52% |
|
Russell 2000 |
-2.73 |
792.91 |
-0.34% |
|
52 Wk Highs |
233 |
|
|
52 Wk Highs |
99 |
|
|
S&P 600 |
-1.47 |
442.26 |
-0.33% |
|
52 Wk Lows |
6 |
|
|
52 Wk Lows |
12 |
|
|
 |
Indices Reversed Into Red After Erasing Early Gains
Kenneth J. Gruneisen - Passed the CAN SLIM® Master's Exam
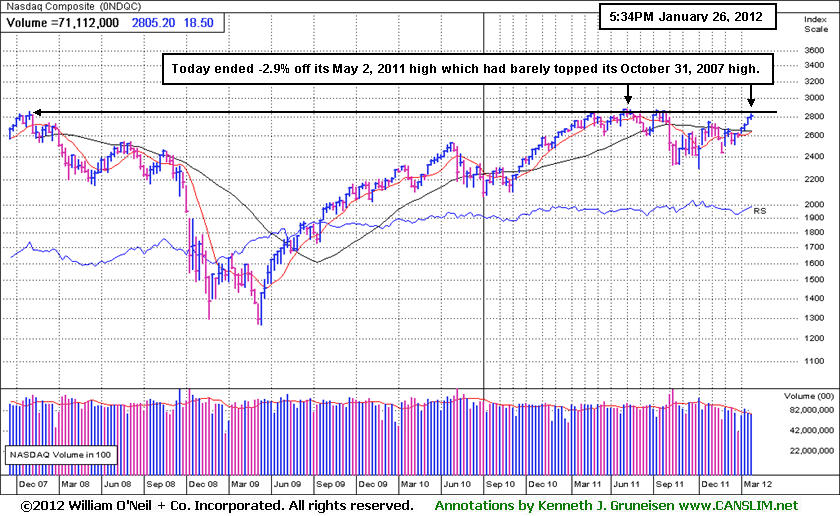
The major averages erased early gains and reversed into the red on Thursday. The reported volume totals were higher than the prior session on the NYSE and on the Nasdaq exchange, hinting that the institutional crowd shifted to more of a selling mood. Decliners narrowly led advancing issues on the NYSE and on the Nasdaq exchange. Stocks hitting new 52-week highs easily outnumbered new 52-week lows on both exchanges. The new 52-week highs total on the NYSE was its highest since July 7, 2011. There were 74 high-ranked companies from the CANSLIM.net Leaders List that made new 52-week highs and appeared on the CANSLIM.net BreakOuts Page, up from the prior session total of 58 stocks. At the close there were gains for only 5 of the 20 high-ranked companies currently included on the Featured Stocks Page, highlighting another disconcertingly weak day for the market's high-ranked leaders.
Looking at economic data, orders for durable goods increased 3%, which was more than forecast and jobless claims remained below 400,000. In addition, the index of U.S. leading indicators rose in December for a third month. On the housing front, new home sales in December fell 2.2% last month to an annual rate of 307,000.
Earnings results were in focus. Caterpillar Inc (CAT +2.07%) rallied after its full-year profit forecast beat estimates amid higher demand for mining equipment.3M Company (MMM +1.27%) gained and Netflix Inc (NFLX +22.06%) surged as they reported fourth-quarter profit that topped analysts' estimates. On the downside, AT&T Inc (T -2.52%) projected "mid-single-digit or better earnings growth" for 2012. The losses in AT&T's stock weighed on the Dow and it closed lower by 22 points at 12,734, after being up by as many as 85 points.
Commodities were also in rally mode. Gold climbed to an almost seven-week high and copper rose for a fourth day on speculation that the Federal Reserve's pledge to keep interest rates low will drive the dollar lower and boost demand for precious metals. Banks had the biggest decline in the S&P 500 as investors speculated that the Fed's low interest rate pledge may hurt profits. Treasuries rallied for a second day after the government's auction of $29 billion in 7-year notes garnered solid demand and the 10-year note was up 16/32 to yield 1.93%.
The recent expansion in leadership (stocks making new 52-week highs) has been noted as a reassuring sign concerning the current confirmed market uptrend and the M criteria, as a healthy crop of strong leaders is necessary for any sustained market advance. Technical improvement from financial shares and key growth areas including the tech sector has been another encouraging sign helping the market outlook.
The Q4 2011 CANSLIM.net Webcast is still available "ON DEMAND" to all upgraded members at no additional cost. Via the Premium Member Homepage links to all prior reports and webcasts are always available.
PICTURED: The Nasdaq Composite index ended -2.9% off its May 2, 2011 high which had barely topped its October 31, 2007 high.
|
 Kenneth J. Gruneisen started out as a licensed stockbroker in August 1987, a couple of months prior to the historic stock market crash that took the Dow Jones Industrial Average down -22.6% in a single day. He has published daily fact-based fundamental and technical analysis on high-ranked stocks online for two decades. Through FACTBASEDINVESTING.COM, Kenneth provides educational articles, news, market commentary, and other information regarding proven investment systems that work in good times and bad.
Comments contained in the body of this report are technical opinions only and are not necessarily those of Gruneisen Growth Corp. The material herein has been obtained from sources believed to be reliable and accurate, however, its accuracy and completeness cannot be guaranteed. Our firm, employees, and customers may effect transactions, including transactions contrary to any recommendation herein, or have positions in the securities mentioned herein or options with respect thereto. Any recommendation contained in this report may not be suitable for all investors and it is not to be deemed an offer or solicitation on our part with respect to the purchase or sale of any securities. |
|
 |
Financial, Energy, and Medical-Related Shares Pulled Back
Kenneth J. Gruneisen - Passed the CAN SLIM® Master's Exam
The Broker/Dealer Index ($XBD -2.38%) and Bank Index ($BKX -2.23%) led decliners Thursday and dragged the major averages into the red. Energy-related shares backpedaled as the Integrated Oil Index ($XOI -1.61%) and Oil Services Index ($OSX -1.26%) lost ground. The medical-related groups also fell as the Healthcare Index ($HMO -1.42%) and Biotechnology Index ($BTK -1.15%) ended lower. The Semiconductor Index ($SOX -1.08%) also weighed on the tech sector while the Internet Index ($IIX -0.29%) and Networking Index ($NWX -0.16%) escaped with less damage. The Retail Index ($RLX +0.10%) managed to post a marginal gain. Meanwhile, the Gold & Silver Index ($XAU +1.13%) was a standout gainer.
Charts courtesy www.stockcharts.com
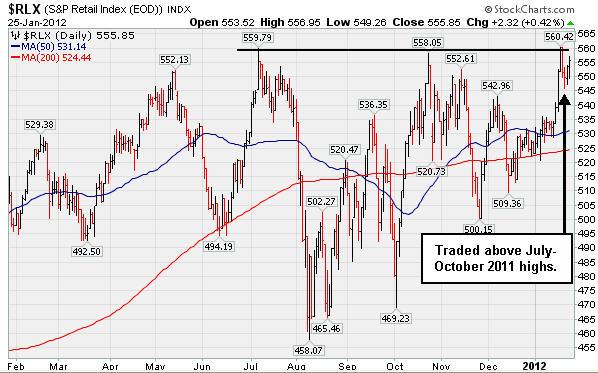
PICTURED: The Retail Index ($RLX +0.10%) recently traded above its July-October 2011 highs, an encouraging sign of strength.
| Oil Services |
$OSX |
236.66 |
-3.02 |
-1.26% |
+9.42% |
| Healthcare |
$HMO |
2,446.84 |
-35.18 |
-1.42% |
+7.24% |
| Integrated Oil |
$XOI |
1,268.33 |
-20.82 |
-1.61% |
+3.19% |
| Semiconductor |
$SOX |
411.94 |
-4.51 |
-1.08% |
+13.03% |
| Networking |
$NWX |
243.77 |
-0.40 |
-0.16% |
+13.30% |
| Internet |
$IIX |
299.04 |
-0.86 |
-0.29% |
+6.14% |
| Broker/Dealer |
$XBD |
92.02 |
-2.24 |
-2.38% |
+10.50% |
| Retail |
$RLX |
556.39 |
+0.54 |
+0.10% |
+6.34% |
| Gold & Silver |
$XAU |
199.93 |
+2.23 |
+1.13% |
+10.68% |
| Bank |
$BKX |
42.56 |
-0.97 |
-2.23% |
+8.08% |
| Biotech |
$BTK |
1,297.05 |
-15.10 |
-1.15% |
+18.84% |
|
|
|
 |
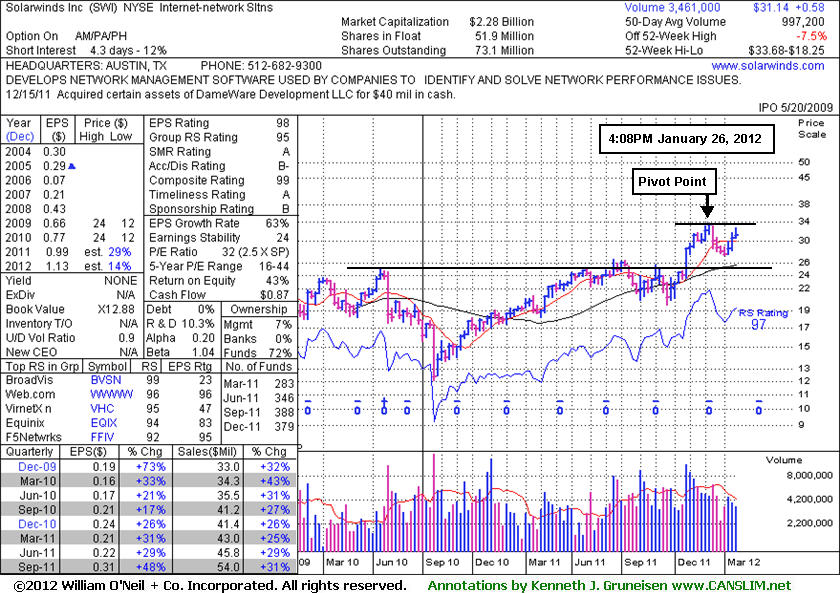
Forming New Base Pattern Worth Watching
Kenneth J. Gruneisen - Passed the CAN SLIM® Master's Exam
Solarwinds Inc (SWI +$0.39 or +1.26% to $31.33) recently rebounded above its 50-day moving average (DMA) line and it is -7.5% off its 52-week high after an 8-week consolidation. In the earlier mid-day report today (read here) it was featured again in yellow with a new pivot point cited based on its 52-week high plus 10 cents. It has shown resilience since dropped from the Featured Stocks list on 1/04/12. Disciplined investors may watch for a fresh burst of institutional buying to confirm a new technical buy signal. In the meanwhile it makes an ideal candidate for investors to have on their watchlist.
Under the headline "Secondary Buy Point Possibly Forming", the last appearance in this FSU section on 12/19/11 discussed secondary buy points following an earlier breakout. Following that analysis, however, it violated its 50-day moving average (DMA) line and raised some concerns with its distributional action, yet it found support well above prior chart highs in the $25-26 area. An earlier appearance in this FSU section on 10/27/11 included an annotated daily graph under the headline, "Breakaway Gap From Double Bottom Base Pattern", at the outset of its rally to as high as $33.68 on 12/09/11.
It reported earnings +48% on +31% sales revenues for the quarter ended September 30, 2011 versus the year ago period. Prior quarterly comparisons showed sales and earnings (C criteria) above the investment system guidelines and it also has a good annual earnings (A criteria) history. The number of top-rated funds owning its shares rose from 263 in Dec '10 to 379 in Dec '11, a reassuring sign concerning the I criteria of the fact-based investment system.
|
|
|
Color Codes Explained :
Y - Better candidates highlighted by our
staff of experts.
G - Previously featured
in past reports as yellow but may no longer be buyable under the
guidelines.
***Last / Change / Volume data in this table is the closing quote data***
Symbol/Exchange
Company Name
Industry Group |
PRICE |
CHANGE
(%Change) |
Day High |
Volume
(% DAV)
(% 50 day avg vol) |
52 Wk Hi
% From Hi |
Featured
Date |
Price
Featured |
Pivot Featured |
|
Max Buy |
ADS
-
NYSE
Alliance Data Sys Corp
COMPUTER SOFTWARE and SERVICES - Information and Delivery Service
|
$110.20
|
-0.94
-0.85% |
$111.74
|
450,271
65.70% of 50 DAV
50 DAV is 685,300
|
$111.65
-1.30%
|
1/17/2012
|
$108.24
|
PP = $107.43
|
|
MB = $112.80
|
Most Recent Note - 1/25/2012 11:58:30 AM
Y - Inching up for another new all-time high today, on track for its 12th gain in the span of 14 sessions since finding support at its 50 DMA line.
>>> The latest Featured Stock Update with an annotated graph appeared on 1/17/2012. Click here.
View all notes |
Alert me of new notes |
CANSLIM.net Company Profile |
SEC |
Zacks Reports |
StockTalk |
News |
Chart |
Request a new note
C
A N
S L
I M


|
ALXN
-
NASDAQ
Alexion Pharmaceuticals
DRUGS - Drug Manufacturers - Other
|
$74.95
|
+0.01
0.01% |
$75.38
|
947,278
78.49% of 50 DAV
50 DAV is 1,206,900
|
$77.58
-3.39%
|
11/30/2011
|
$68.66
|
PP = $70.52
|
|
MB = $74.05
|
Most Recent Note - 1/20/2012 2:40:04 PM
Y - Pulling back below its "max buy" level with today's 3rd consecutive loss and its color code is changed to yellow. Prior resistance in the $70 area defines initial chart support above its 50 DMA line.
>>> The latest Featured Stock Update with an annotated graph appeared on 1/13/2012. Click here.
View all notes |
Alert me of new notes |
CANSLIM.net Company Profile |
SEC |
Zacks Reports |
StockTalk |
News |
Chart |
Request a new note
C
A N
S L
I M
|
CATM
-
NASDAQ
Cardtronics Inc
DIVERSIFIED SERVICES - Business/Management Services
|
$26.93
|
-0.19
-0.70% |
$27.94
|
270,996
80.73% of 50 DAV
50 DAV is 335,700
|
$28.74
-6.30%
|
12/23/2011
|
$28.64
|
PP = $28.56
|
|
MB = $29.99
|
Most Recent Note - 1/25/2012 5:46:52 PM
Y - Consolidating above its 50 DMA line, perched near its previously cited pivot point and trading within close striking distance of its 52-week high.
>>> The latest Featured Stock Update with an annotated graph appeared on 12/23/2011. Click here.
View all notes |
Alert me of new notes |
CANSLIM.net Company Profile |
SEC |
Zacks Reports |
StockTalk |
News |
Chart |
Request a new note
C
A N
S L
I M
|
CELG
-
NASDAQ
Celgene Corp
DRUGS - Drug Manufacturers - Major
|
$72.66
|
-1.13
-1.53% |
$74.63
|
3,990,862
114.66% of 50 DAV
50 DAV is 3,480,600
|
$75.11
-3.26%
|
12/20/2011
|
$66.68
|
PP = $68.35
|
|
MB = $71.77
|
Most Recent Note - 1/20/2012 12:04:47 PM
G - Today's gain has it challenging its 52-week high hit on Tuesday and trading within close striking distance of its all-time high ($77.39 in Aug '08). Prior highs in the $68 area define support to watch on pullbacks.
>>> The latest Featured Stock Update with an annotated graph appeared on 12/29/2011. Click here.
View all notes |
Alert me of new notes |
CANSLIM.net Company Profile |
SEC |
Zacks Reports |
StockTalk |
News |
Chart |
Request a new note
C
A N
S L
I M
|
FEIC
-
NASDAQ
F E I Co
ELECTRONICS - Diversified Electronics
|
$44.96
|
-0.32
-0.71% |
$45.85
|
247,743
92.06% of 50 DAV
50 DAV is 269,100
|
$45.47
-1.12%
|
12/7/2011
|
$41.41
|
PP = $42.35
|
|
MB = $44.47
|
Most Recent Note - 1/25/2012 5:50:56 PM
G - Quiet gain today for a new all-time high, getting extended from its prior base. No overhead supply remains to hinder its upward progress. See the latest FSU analysis for more details and a new annotated graph.
>>> The latest Featured Stock Update with an annotated graph appeared on 1/25/2012. Click here.
View all notes |
Alert me of new notes |
CANSLIM.net Company Profile |
SEC |
Zacks Reports |
StockTalk |
News |
Chart |
Request a new note
C
A N
S L
I M
|
Symbol/Exchange
Company Name
Industry Group |
PRICE |
CHANGE
(%Change) |
Day High |
Volume
(% DAV)
(% 50 day avg vol) |
52 Wk Hi
% From Hi |
Featured
Date |
Price
Featured |
Pivot Featured |
|
Max Buy |
GNC
-
NYSE
G N C Holdings Inc
RETAIL - Drug Stores
|
$26.35
|
-1.98
-6.99% |
$28.46
|
2,762,616
267.44% of 50 DAV
50 DAV is 1,033,000
|
$29.67
-11.19%
|
1/19/2012
|
$28.99
|
PP = $29.60
|
|
MB = $31.08
|
 Most Recent Note - 1/26/2012 12:27:02 PM
G - Color code is changed to green while slumping below its 50 DMA line today raising concerns. Trading near prior lows with volume running at an above average pace behind its 3rd consecutive loss. A subsequent rally above the new pivot point cited with sufficient volume may trigger a new (or add-on) technical buy signal.
>>> The latest Featured Stock Update with an annotated graph appeared on 1/19/2012. Click here.
View all notes |
Alert me of new notes |
CANSLIM.net Company Profile |
SEC |
Zacks Reports |
StockTalk |
News |
Chart |
Request a new note
C
A N
S L
I M
|
HMSY
-
NASDAQ
H M S Holdings Corp
COMPUTER SOFTWARE and SERVICES - Healthcare Information Service
|
$32.81
|
+0.13
0.40% |
$33.02
|
535,171
60.13% of 50 DAV
50 DAV is 890,000
|
$34.73
-5.53%
|
10/27/2011
|
$26.44
|
PP = $28.37
|
|
MB = $29.79
|
Most Recent Note - 1/23/2012 12:38:00 PM
G - Pulling back on light volume while perched near its all-time high after recent gains with below average volume. No resistance remains to hinder its progress, but it is extended from its prior base.
>>> The latest Featured Stock Update with an annotated graph appeared on 12/28/2011. Click here.
View all notes |
Alert me of new notes |
CANSLIM.net Company Profile |
SEC |
Zacks Reports |
StockTalk |
News |
Chart |
Request a new note
C
A N
S L
I M
|
ISRG
-
NASDAQ
Intuitive Surgical Inc
HEALTH SERVICES - Medical Appliances and Equipment
|
$456.38
|
+0.72
0.16% |
$458.72
|
422,025
118.95% of 50 DAV
50 DAV is 354,800
|
$476.49
-4.22%
|
12/20/2011
|
$442.43
|
PP = $449.16
|
|
MB = $471.62
|
Most Recent Note - 1/25/2012 5:05:26 PM
Y - Posted a solid gain on higher volume today and rallied up above its 50 DMA line. Reported earnings +24% on +28% sales revenues for the quarter ended December 31, 2011 versus the year ago period.
>>> The latest Featured Stock Update with an annotated graph appeared on 1/18/2012. Click here.
View all notes |
Alert me of new notes |
CANSLIM.net Company Profile |
SEC |
Zacks Reports |
StockTalk |
News |
Chart |
Request a new note
C
A N
S L
I M
|
LULU
-
NASDAQ
Lululemon Athletica
MANUFACTURING - Textile Manufacturing
|
$62.98
|
-0.39
-0.62% |
$64.51
|
2,586,336
65.91% of 50 DAV
50 DAV is 3,923,900
|
$64.49
-2.34%
|
1/10/2012
|
$60.97
|
PP = $59.46
|
|
MB = $62.43
|
Most Recent Note - 1/25/2012 5:08:32 PM
G - Color code is changed to green after today's gain lifted it above its "max buy" level while challenging its all-time high. No resistance remains due to overhead supply.
>>> The latest Featured Stock Update with an annotated graph appeared on 1/10/2012. Click here.
View all notes |
Alert me of new notes |
CANSLIM.net Company Profile |
SEC |
Zacks Reports |
StockTalk |
News |
Chart |
Request a new note
C
A N
S L
I M
|
MA
-
NYSE
Mastercard Inc Cl A
DIVERSIFIED SERVICES - Business/Management Services
|
$347.83
|
-0.94
-0.27% |
$354.94
|
921,376
90.67% of 50 DAV
50 DAV is 1,016,200
|
$384.99
-9.65%
|
1/3/2012
|
$367.87
|
PP = $385.09
|
|
MB = $404.34
|
Most Recent Note - 1/25/2012 5:48:27 PM
G - Up today with below average volume. Its 200 DMA line is the nearest support level to watch. A rebound above its 50 DMA line is needed, otherwise its technical stance is not that of a sound looking buy candidate.
>>> The latest Featured Stock Update with an annotated graph appeared on 1/3/2012. Click here.
View all notes |
Alert me of new notes |
CANSLIM.net Company Profile |
SEC |
Zacks Reports |
StockTalk |
News |
Chart |
Request a new note
C
A N
S L
I M
|
Symbol/Exchange
Company Name
Industry Group |
PRICE |
CHANGE
(%Change) |
Day High |
Volume
(% DAV)
(% 50 day avg vol) |
52 Wk Hi
% From Hi |
Featured
Date |
Price
Featured |
Pivot Featured |
|
Max Buy |
MKTX
-
NASDAQ
Marketaxess Holdings Inc
FINANCIAL SERVICES - Investment Brokerage - Nationa
|
$31.00
|
-0.41
-1.31% |
$31.85
|
132,129
75.98% of 50 DAV
50 DAV is 173,900
|
$32.23
-3.82%
|
10/28/2011
|
$29.79
|
PP = $31.05
|
|
MB = $32.60
|
Most Recent Note - 1/23/2012 12:44:40 PM
Y - Volume totals have been cooling in recent weeks while hovering near its all-time high and no resistance remains due to overhead supply. The 50 DMA line defines initial chart support to watch.
>>> The latest Featured Stock Update with an annotated graph appeared on 1/24/2012. Click here.
View all notes |
Alert me of new notes |
CANSLIM.net Company Profile |
SEC |
Zacks Reports |
StockTalk |
News |
Chart |
Request a new note
C
A N
S L
I M
|
OSIS
-
NASDAQ
O S I Systems Inc
ELECTRONICS - Semiconductor Equipment and Mate
|
$54.42
|
-1.80
-3.20% |
$56.20
|
204,918
204.71% of 50 DAV
50 DAV is 100,100
|
$57.51
-5.37%
|
11/1/2011
|
$42.07
|
PP = $45.57
|
|
MB = $47.85
|
Most Recent Note - 1/26/2012 12:48:07 PM
G - Hovering near its all-time highs. Reported earnings +20% on +11% sales revenues for the quarter ended December 31, 2011 versus the year ago period. Results below the +25% minimum earnings guideline, and marking its weakest earnings comparison in 2 years, raised concerns. Its 50 DMA line defines important support to watch.
>>> The latest Featured Stock Update with an annotated graph appeared on 12/27/2011. Click here.
View all notes |
Alert me of new notes |
CANSLIM.net Company Profile |
SEC |
Zacks Reports |
StockTalk |
News |
Chart |
Request a new note
C
A N
S L
I M
|
PRGO
-
NASDAQ
Perrigo Co
DRUGS - Drug Related Products
|
$96.13
|
-2.64
-2.67% |
$99.22
|
713,121
56.32% of 50 DAV
50 DAV is 1,266,200
|
$104.70
-8.19%
|
12/9/2011
|
$99.54
|
PP = $101.56
|
|
MB = $106.64
|
Most Recent Note - 1/26/2012 4:04:13 PM
G - Slumped below its 50 DMA line today, raising some concerns. Prior lows near $94 define support above its 200 DMA line. It is now -8.2% off its 52-week high with little resistance remaining due to overhead supply.
>>> The latest Featured Stock Update with an annotated graph appeared on 1/9/2012. Click here.
View all notes |
Alert me of new notes |
CANSLIM.net Company Profile |
SEC |
Zacks Reports |
StockTalk |
News |
Chart |
Request a new note
C
A N
S L
I M
|
RAX
-
NYSE
Rackspace Hosting Inc
INTERNET - Internet Software and; Services
|
$42.98
|
-0.02
-0.05% |
$43.77
|
1,281,476
85.53% of 50 DAV
50 DAV is 1,498,200
|
$46.50
-7.56%
|
11/8/2011
|
$44.28
|
PP = $46.27
|
|
MB = $48.58
|
Most Recent Note - 1/26/2012 4:05:58 PM
G - Still quietly consolidating near its 50 DMA line. Its recent low ($41.37 on 1/09/12) defines important near-term support to watch above its 200 DMA line.
>>> The latest Featured Stock Update with an annotated graph appeared on 1/5/2012. Click here.
View all notes |
Alert me of new notes |
CANSLIM.net Company Profile |
SEC |
Zacks Reports |
StockTalk |
News |
Chart |
Request a new note
C
A N
S L
I M
|
SWI
-
NYSE
Solarwinds Inc
COMPUTER SOFTWARE and SERVICES - Application Software
|
$31.33
|
+0.39
1.26% |
$32.70
|
1,199,505
120.29% of 50 DAV
50 DAV is 997,200
|
$33.68
-6.98%
|
1/26/2012
|
$32.36
|
PP = $33.78
|
|
MB = $35.47
|
Most Recent Note - 1/26/2012 5:16:08 PM
Y - Closed near the session low today, a sign it was encountering some resistance due to overhead supply. It is perched above its 50 DMA line and just -7.5% off its 52-week high after an 8-week consolidation. In the mid-day report earlier it was highlighted in yellow with a new pivot point cited based on its 52-week high plus 10 cents. It has shown resilience since dropped from the Featured Stocks list on 1/04/12. Disciplined investors may watch for a fresh burst of institutional buying to confirm a new technical buy signal. See the latest FSU analysis for more details and a new annotated weekly graph.
>>> The latest Featured Stock Update with an annotated graph appeared on 1/26/2012. Click here.
View all notes |
Alert me of new notes |
CANSLIM.net Company Profile |
SEC |
Zacks Reports |
StockTalk |
News |
Chart |
Request a new note
C
A N
S L
I M
|
Symbol/Exchange
Company Name
Industry Group |
PRICE |
CHANGE
(%Change) |
Day High |
Volume
(% DAV)
(% 50 day avg vol) |
52 Wk Hi
% From Hi |
Featured
Date |
Price
Featured |
Pivot Featured |
|
Max Buy |
SXCI
-
NASDAQ
S X C Health Solutions
COMPUTER SOFTWARE and SERVICES - Healthcare Information Service
|
$62.85
|
-0.60
-0.95% |
$63.91
|
248,886
65.17% of 50 DAV
50 DAV is 381,900
|
$66.40
-5.35%
|
1/10/2012
|
$62.05
|
PP = $60.10
|
|
MB = $63.11
|
Most Recent Note - 1/20/2012 7:17:23 PM
Y - Color code is changed to yellow while consolidating just below the "max buy" level. See the latest FSU analysis for more details and a new annotated weekly graph.
>>> The latest Featured Stock Update with an annotated graph appeared on 1/20/2012. Click here.
View all notes |
Alert me of new notes |
CANSLIM.net Company Profile |
SEC |
Zacks Reports |
StockTalk |
News |
Chart |
Request a new note
C
A N
S L
I M
|
TDG
-
NYSE
Transdigm Group Inc
AEROSPACE/DEFENSE - Aerospace/Defense Products and; Services
|
$101.83
|
-0.37
-0.36% |
$103.18
|
453,669
137.89% of 50 DAV
50 DAV is 329,000
|
$102.73
-0.88%
|
1/10/2012
|
$98.83
|
PP = $102.83
|
|
MB = $107.97
|
Most Recent Note - 1/23/2012 12:25:20 PM
Y - Announced plans to acquire AmSafe Global Holdings Inc for a total purchase price of approximately $750 million in cash. Spiked higher today with above average volume behind its gain while challenging its 52-week high and approaching its pivot point. No overhead supply remains to act as resistance Recent lows in the $92 area define the next important support level to watch if it slumps below its 50 DMA line.
>>> The latest Featured Stock Update with an annotated graph appeared on 1/4/2012. Click here.
View all notes |
Alert me of new notes |
CANSLIM.net Company Profile |
SEC |
Zacks Reports |
StockTalk |
News |
Chart |
Request a new note
C
A N
S L
I M
|
TSCO
-
NASDAQ
Tractor Supply Co
SPECIALTY RETAIL - Specialty Retail, Other
|
$79.84
|
-0.96
-1.19% |
$81.75
|
521,835
74.23% of 50 DAV
50 DAV is 703,000
|
$81.98
-2.61%
|
1/12/2012
|
$79.12
|
PP = $75.58
|
|
MB = $79.36
|
Most Recent Note - 1/26/2012 5:18:49 PM
G - Holding its ground in a tight range for more than 2 weeks with volume totals cooling while perched at its all-time high. Prior highs in the mid-$70s which were a resistance area now define initial support to watch on pullbacks.
>>> The latest Featured Stock Update with an annotated graph appeared on 1/12/2012. Click here.
View all notes |
Alert me of new notes |
CANSLIM.net Company Profile |
SEC |
Zacks Reports |
StockTalk |
News |
Chart |
Request a new note
C
A N
S L
I M
|
ULTA
-
NASDAQ
Ulta Salon Cosm & Frag
SPECIALTY RETAIL - Specialty Retail, Other
|
$76.69
|
-2.11
-2.68% |
$79.64
|
593,356
63.77% of 50 DAV
50 DAV is 930,500
|
$79.14
-3.10%
|
1/11/2012
|
$71.97
|
PP = $75.80
|
|
MB = $79.59
|
Most Recent Note - 1/26/2012 5:21:20 PM
Y - Negative reversal today after touching another new all-time high. Recently wedged up from a riskier late-stage base without sufficient volume to trigger a proper technical buy signal. Prior lows near $64 define important chart support above its 200 DMA line.
>>> The latest Featured Stock Update with an annotated graph appeared on 1/11/2012. Click here.
View all notes |
Alert me of new notes |
CANSLIM.net Company Profile |
SEC |
Zacks Reports |
StockTalk |
News |
Chart |
Request a new note
C
A N
S L
I M
|
V
-
NYSE
Visa Inc Cl A
DIVERSIFIED SERVICES - Business/Management Services
|
$100.86
|
+0.30
0.30% |
$102.15
|
3,484,777
92.03% of 50 DAV
50 DAV is 3,786,700
|
$104.20
-3.21%
|
10/24/2011
|
$94.21
|
PP = $94.85
|
|
MB = $99.59
|
Most Recent Note - 1/26/2012 5:25:02 PM
G - It has posted gains on lighter volume following its negative reversal after touching a new all-time high on 1/19/12 when last noted - "No overhead supply remains to act as resistance. Its recent low ($98.33 on 1/11/12) and its 50 DMA line define chart support to watch on pullbacks. "
>>> The latest Featured Stock Update with an annotated graph appeared on 1/23/2012. Click here.
View all notes |
Alert me of new notes |
CANSLIM.net Company Profile |
SEC |
Zacks Reports |
StockTalk |
News |
Chart |
Request a new note
C
A N
S L
I M
|
Symbol/Exchange
Company Name
Industry Group |
PRICE |
CHANGE
(%Change) |
Day High |
Volume
(% DAV)
(% 50 day avg vol) |
52 Wk Hi
% From Hi |
Featured
Date |
Price
Featured |
Pivot Featured |
|
Max Buy |
|
|
|
THESE ARE NOT BUY RECOMMENDATIONS!
Comments contained in the body of this report are technical
opinions only. The material herein has been obtained
from sources believed to be reliable and accurate, however,
its accuracy and completeness cannot be guaranteed.
This site is not an investment advisor, hence it does
not endorse or recommend any securities or other investments.
Any recommendation contained in this report may not
be suitable for all investors and it is not to be deemed
an offer or solicitation on our part with respect to
the purchase or sale of any securities. All trademarks,
service marks and trade names appearing in this report
are the property of their respective owners, and are
likewise used for identification purposes only.
This report is a service available
only to active Paid Premium Members.
You may opt-out of receiving report notifications
at any time. Questions or comments may be submitted
by writing to Premium Membership Services 665 S.E. 10 Street, Suite 201 Deerfield Beach, FL 33441-5634 or by calling 1-800-965-8307
or 954-785-1121.
|
|
|

