***Last / Change / Volume data in this table is the closing quote data***
Symbol/Exchange
Company Name
Industry Group |
PRICE |
CHANGE
(%Change) |
Day High |
Volume
(% DAV)
(% 50 day avg vol) |
52 Wk Hi
% From Hi |
Featured
Date |
Price
Featured |
Pivot Featured |
|
Max Buy |
ADS
-
NYSE
Alliance Data Sys Corp
COMPUTER SOFTWARE and SERVICES - Information and Delivery Service
|
$111.14
|
+0.64
0.58% |
$111.65
|
1,021,602
150.97% of 50 DAV
50 DAV is 676,700
|
$110.80
0.31%
|
1/17/2012
|
$108.24
|
PP = $107.43
|
|
MB = $112.80
|
 Most Recent Note - 1/25/2012 11:58:30 AM
Y - Inching up for another new all-time high today, on track for its 12th gain in the span of 14 sessions since finding support at its 50 DMA line.
>>> The latest Featured Stock Update with an annotated graph appeared on 1/17/2012. Click here.
View all notes |
Alert me of new notes |
CANSLIM.net Company Profile |
SEC |
Zacks Reports |
StockTalk |
News |
Chart |
Request a new note
C
A N
S L
I M


|
ALXN
-
NASDAQ
Alexion Pharmaceuticals
DRUGS - Drug Manufacturers - Other
|
$74.94
|
+0.96
1.30% |
$75.26
|
1,592,780
133.15% of 50 DAV
50 DAV is 1,196,200
|
$77.58
-3.40%
|
11/30/2011
|
$68.66
|
PP = $70.52
|
|
MB = $74.05
|
Most Recent Note - 1/20/2012 2:40:04 PM
Y - Pulling back below its "max buy" level with today's 3rd consecutive loss and its color code is changed to yellow. Prior resistance in the $70 area defines initial chart support above its 50 DMA line.
>>> The latest Featured Stock Update with an annotated graph appeared on 1/13/2012. Click here.
View all notes |
Alert me of new notes |
CANSLIM.net Company Profile |
SEC |
Zacks Reports |
StockTalk |
News |
Chart |
Request a new note
C
A N
S L
I M
|
CATM
-
NASDAQ
Cardtronics Inc
DIVERSIFIED SERVICES - Business/Management Services
|
$27.12
|
-0.54
-1.95% |
$27.69
|
283,483
84.75% of 50 DAV
50 DAV is 334,500
|
$28.74
-5.64%
|
12/23/2011
|
$28.64
|
PP = $28.56
|
|
MB = $29.99
|
Most Recent Note - 1/25/2012 5:46:52 PM
Y - Consolidating above its 50 DMA line, perched near its previously cited pivot point and trading within close striking distance of its 52-week high.
>>> The latest Featured Stock Update with an annotated graph appeared on 12/23/2011. Click here.
View all notes |
Alert me of new notes |
CANSLIM.net Company Profile |
SEC |
Zacks Reports |
StockTalk |
News |
Chart |
Request a new note
C
A N
S L
I M
|
CELG
-
NASDAQ
Celgene Corp
DRUGS - Drug Manufacturers - Major
|
$73.79
|
-0.23
-0.31% |
$74.20
|
3,777,183
108.84% of 50 DAV
50 DAV is 3,470,500
|
$75.11
-1.76%
|
12/20/2011
|
$66.68
|
PP = $68.35
|
|
MB = $71.77
|
Most Recent Note - 1/20/2012 12:04:47 PM
G - Today's gain has it challenging its 52-week high hit on Tuesday and trading within close striking distance of its all-time high ($77.39 in Aug '08). Prior highs in the $68 area define support to watch on pullbacks.
>>> The latest Featured Stock Update with an annotated graph appeared on 12/29/2011. Click here.
View all notes |
Alert me of new notes |
CANSLIM.net Company Profile |
SEC |
Zacks Reports |
StockTalk |
News |
Chart |
Request a new note
C
A N
S L
I M
|
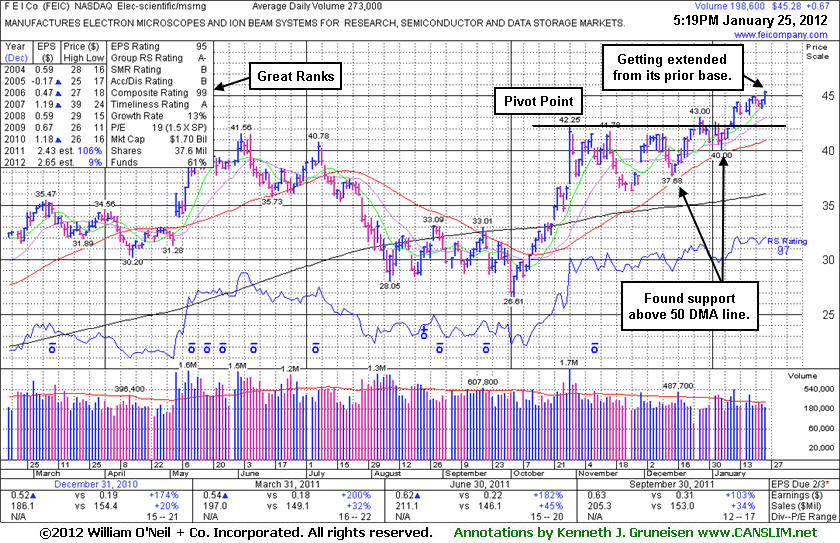
FEIC
-
NASDAQ
F E I Co
ELECTRONICS - Diversified Electronics
|
$45.28
|
+0.67
1.50% |
$45.47
|
204,211
74.80% of 50 DAV
50 DAV is 273,000
|
$44.99
0.64%
|
12/7/2011
|
$41.41
|
PP = $42.35
|
|
MB = $44.47
|
Most Recent Note - 1/25/2012 5:50:56 PM
G - Quiet gain today for a new all-time high, getting extended from its prior base. No overhead supply remains to hinder its upward progress. See the latest FSU analysis for more details and a new annotated graph.
>>> The latest Featured Stock Update with an annotated graph appeared on 1/25/2012. Click here.
View all notes |
Alert me of new notes |
CANSLIM.net Company Profile |
SEC |
Zacks Reports |
StockTalk |
News |
Chart |
Request a new note
C
A N
S L
I M
|
Symbol/Exchange
Company Name
Industry Group |
PRICE |
CHANGE
(%Change) |
Day High |
Volume
(% DAV)
(% 50 day avg vol) |
52 Wk Hi
% From Hi |
Featured
Date |
Price
Featured |
Pivot Featured |
|
Max Buy |
GNC
-
NYSE
G N C Holdings Inc
RETAIL - Drug Stores
|
$28.33
|
-0.72
-2.48% |
$29.28
|
1,219,647
118.03% of 50 DAV
50 DAV is 1,033,300
|
$29.67
-4.52%
|
1/19/2012
|
$28.99
|
PP = $29.60
|
|
MB = $31.08
|
Most Recent Note - 1/25/2012 5:54:54 PM
Y - Down today with higher volume. Its 50 DMA line and prior lows define important support to watch, meanwhile a subsequent rally above the new pivot point cited with sufficient volume may trigger a new (or add-on) technical buy signal.
>>> The latest Featured Stock Update with an annotated graph appeared on 1/19/2012. Click here.
View all notes |
Alert me of new notes |
CANSLIM.net Company Profile |
SEC |
Zacks Reports |
StockTalk |
News |
Chart |
Request a new note
C
A N
S L
I M
|
HMSY
-
NASDAQ
H M S Holdings Corp
COMPUTER SOFTWARE and SERVICES - Healthcare Information Service
|
$32.68
|
-0.42
-1.27% |
$33.41
|
698,352
78.52% of 50 DAV
50 DAV is 889,400
|
$34.73
-5.90%
|
10/27/2011
|
$26.44
|
PP = $28.37
|
|
MB = $29.79
|
Most Recent Note - 1/23/2012 12:38:00 PM
G - Pulling back on light volume while perched near its all-time high after recent gains with below average volume. No resistance remains to hinder its progress, but it is extended from its prior base.
>>> The latest Featured Stock Update with an annotated graph appeared on 12/28/2011. Click here.
View all notes |
Alert me of new notes |
CANSLIM.net Company Profile |
SEC |
Zacks Reports |
StockTalk |
News |
Chart |
Request a new note
C
A N
S L
I M
|
ISRG
-
NASDAQ
Intuitive Surgical Inc
HEALTH SERVICES - Medical Appliances and Equipment
|
$455.66
|
+15.66
3.56% |
$455.66
|
524,107
150.22% of 50 DAV
50 DAV is 348,900
|
$476.49
-4.37%
|
12/20/2011
|
$442.43
|
PP = $449.16
|
|
MB = $471.62
|
Most Recent Note - 1/25/2012 5:05:26 PM
Y - Posted a solid gain on higher volume today and rallied up above its 50 DMA line. Reported earnings +24% on +28% sales revenues for the quarter ended December 31, 2011 versus the year ago period.
>>> The latest Featured Stock Update with an annotated graph appeared on 1/18/2012. Click here.
View all notes |
Alert me of new notes |
CANSLIM.net Company Profile |
SEC |
Zacks Reports |
StockTalk |
News |
Chart |
Request a new note
C
A N
S L
I M
|
LULU
-
NASDAQ
Lululemon Athletica
MANUFACTURING - Textile Manufacturing
|
$63.37
|
+1.19
1.91% |
$63.79
|
2,361,031
60.40% of 50 DAV
50 DAV is 3,909,100
|
$64.49
-1.74%
|
1/10/2012
|
$60.97
|
PP = $59.46
|
|
MB = $62.43
|
Most Recent Note - 1/25/2012 5:08:32 PM
G - Color code is changed to green after today's gain lifted it above its "max buy" level while challenging its all-time high. No resistance remains due to overhead supply.
>>> The latest Featured Stock Update with an annotated graph appeared on 1/10/2012. Click here.
View all notes |
Alert me of new notes |
CANSLIM.net Company Profile |
SEC |
Zacks Reports |
StockTalk |
News |
Chart |
Request a new note
C
A N
S L
I M
|
MA
-
NYSE
Mastercard Inc Cl A
DIVERSIFIED SERVICES - Business/Management Services
|
$348.77
|
+6.09
1.78% |
$349.88
|
897,725
88.73% of 50 DAV
50 DAV is 1,011,700
|
$384.99
-9.41%
|
1/3/2012
|
$367.87
|
PP = $385.09
|
|
MB = $404.34
|
Most Recent Note - 1/25/2012 5:48:27 PM
G - Up today with below average volume. Its 200 DMA line is the nearest support level to watch. A rebound above its 50 DMA line is needed, otherwise its technical stance is not that of a sound looking buy candidate.
>>> The latest Featured Stock Update with an annotated graph appeared on 1/3/2012. Click here.
View all notes |
Alert me of new notes |
CANSLIM.net Company Profile |
SEC |
Zacks Reports |
StockTalk |
News |
Chart |
Request a new note
C
A N
S L
I M
|
Symbol/Exchange
Company Name
Industry Group |
PRICE |
CHANGE
(%Change) |
Day High |
Volume
(% DAV)
(% 50 day avg vol) |
52 Wk Hi
% From Hi |
Featured
Date |
Price
Featured |
Pivot Featured |
|
Max Buy |
MKTX
-
NASDAQ
Marketaxess Holdings Inc
FINANCIAL SERVICES - Investment Brokerage - Nationa
|
$31.41
|
+0.44
1.42% |
$31.54
|
146,743
84.58% of 50 DAV
50 DAV is 173,500
|
$32.23
-2.54%
|
10/28/2011
|
$29.79
|
PP = $31.05
|
|
MB = $32.60
|
Most Recent Note - 1/23/2012 12:44:40 PM
Y - Volume totals have been cooling in recent weeks while hovering near its all-time high and no resistance remains due to overhead supply. The 50 DMA line defines initial chart support to watch.
>>> The latest Featured Stock Update with an annotated graph appeared on 1/24/2012. Click here.
View all notes |
Alert me of new notes |
CANSLIM.net Company Profile |
SEC |
Zacks Reports |
StockTalk |
News |
Chart |
Request a new note
C
A N
S L
I M
|
OSIS
-
NASDAQ
O S I Systems Inc
ELECTRONICS - Semiconductor Equipment and Mate
|
$56.22
|
-0.24
-0.43% |
$57.51
|
153,819
154.59% of 50 DAV
50 DAV is 99,500
|
$56.62
-0.71%
|
11/1/2011
|
$42.07
|
PP = $45.57
|
|
MB = $47.85
|
Most Recent Note - 1/24/2012 12:10:13 PM
G - Gapped up today after it reported earnings +20% on +11% sales revenues for the quarter ended December 31, 2011 versus the year ago period. Results below the +25% minimum earnings guideline, and marking its weakest earnings comparison in 2 years, raised concerns. Its 50 DMA line defines important support to watch.
>>> The latest Featured Stock Update with an annotated graph appeared on 12/27/2011. Click here.
View all notes |
Alert me of new notes |
CANSLIM.net Company Profile |
SEC |
Zacks Reports |
StockTalk |
News |
Chart |
Request a new note
C
A N
S L
I M
|
PRGO
-
NASDAQ
Perrigo Co
DRUGS - Drug Related Products
|
$98.77
|
+1.23
1.26% |
$99.13
|
591,987
46.56% of 50 DAV
50 DAV is 1,271,500
|
$104.70
-5.66%
|
12/9/2011
|
$99.54
|
PP = $101.56
|
|
MB = $106.64
|
Most Recent Note - 1/24/2012 11:23:38 AM
G - Still quietly perched just -6.6% off its 52-week high with little resistance remaining due to overhead supply. Found support at its 50 DMA line
>>> The latest Featured Stock Update with an annotated graph appeared on 1/9/2012. Click here.
View all notes |
Alert me of new notes |
CANSLIM.net Company Profile |
SEC |
Zacks Reports |
StockTalk |
News |
Chart |
Request a new note
C
A N
S L
I M
|
RAX
-
NYSE
Rackspace Hosting Inc
INTERNET - Internet Software and; Services
|
$43.00
|
+0.06
0.14% |
$43.13
|
1,154,761
75.80% of 50 DAV
50 DAV is 1,523,500
|
$46.50
-7.52%
|
11/8/2011
|
$44.28
|
PP = $46.27
|
|
MB = $48.58
|
Most Recent Note - 1/20/2012 7:22:50 PM
G - Color code is changed to green after today's loss on slightly higher volume led to a close below its 50 DMA line. Its recent low ($41.37 on 1/09/12) defines important near-term support to watch above its 200 DMA line.
>>> The latest Featured Stock Update with an annotated graph appeared on 1/5/2012. Click here.
View all notes |
Alert me of new notes |
CANSLIM.net Company Profile |
SEC |
Zacks Reports |
StockTalk |
News |
Chart |
Request a new note
C
A N
S L
I M
|
SXCI
-
NASDAQ
S X C Health Solutions
COMPUTER SOFTWARE and SERVICES - Healthcare Information Service
|
$63.45
|
+0.81
1.29% |
$63.46
|
488,280
127.92% of 50 DAV
50 DAV is 381,700
|
$66.40
-4.44%
|
1/10/2012
|
$62.05
|
PP = $60.10
|
|
MB = $63.11
|
Most Recent Note - 1/20/2012 7:17:23 PM
Y - Color code is changed to yellow while consolidating just below the "max buy" level. See the latest FSU analysis for more details and a new annotated weekly graph.
>>> The latest Featured Stock Update with an annotated graph appeared on 1/20/2012. Click here.
View all notes |
Alert me of new notes |
CANSLIM.net Company Profile |
SEC |
Zacks Reports |
StockTalk |
News |
Chart |
Request a new note
C
A N
S L
I M
|
Symbol/Exchange
Company Name
Industry Group |
PRICE |
CHANGE
(%Change) |
Day High |
Volume
(% DAV)
(% 50 day avg vol) |
52 Wk Hi
% From Hi |
Featured
Date |
Price
Featured |
Pivot Featured |
|
Max Buy |
TDG
-
NYSE
Transdigm Group Inc
AEROSPACE/DEFENSE - Aerospace/Defense Products and; Services
|
$102.20
|
+1.65
1.64% |
$102.48
|
311,686
94.88% of 50 DAV
50 DAV is 328,500
|
$102.73
-0.52%
|
1/10/2012
|
$98.83
|
PP = $102.83
|
|
MB = $107.97
|
Most Recent Note - 1/23/2012 12:25:20 PM
Y - Announced plans to acquire AmSafe Global Holdings Inc for a total purchase price of approximately $750 million in cash. Spiked higher today with above average volume behind its gain while challenging its 52-week high and approaching its pivot point. No overhead supply remains to act as resistance Recent lows in the $92 area define the next important support level to watch if it slumps below its 50 DMA line.
>>> The latest Featured Stock Update with an annotated graph appeared on 1/4/2012. Click here.
View all notes |
Alert me of new notes |
CANSLIM.net Company Profile |
SEC |
Zacks Reports |
StockTalk |
News |
Chart |
Request a new note
C
A N
S L
I M
|
TSCO
-
NASDAQ
Tractor Supply Co
SPECIALTY RETAIL - Specialty Retail, Other
|
$80.80
|
+0.10
0.12% |
$81.10
|
542,614
77.46% of 50 DAV
50 DAV is 700,500
|
$81.98
-1.44%
|
1/12/2012
|
$79.12
|
PP = $75.58
|
|
MB = $79.36
|
Most Recent Note - 1/19/2012 5:42:51 PM
G - After hitting a new all-time high today it reversed into the red for a loss on above average volume, raising concerns. Prior highs in the mid-$70s which were a resistance area now define initial support to watch on pullbacks.
>>> The latest Featured Stock Update with an annotated graph appeared on 1/12/2012. Click here.
View all notes |
Alert me of new notes |
CANSLIM.net Company Profile |
SEC |
Zacks Reports |
StockTalk |
News |
Chart |
Request a new note
C
A N
S L
I M
|
ULTA
-
NASDAQ
Ulta Salon Cosm & Frag
SPECIALTY RETAIL - Specialty Retail, Other
|
$78.80
|
+1.42
1.84% |
$79.14
|
627,637
67.07% of 50 DAV
50 DAV is 935,800
|
$77.83
1.25%
|
1/11/2012
|
$71.97
|
PP = $75.80
|
|
MB = $79.59
|
Most Recent Note - 1/25/2012 5:44:55 PM
Y - Gain on below average volume today helped it hit another new all-time high, wedging up from a riskier late-stage base without sufficient volume to trigger a proper technical buy signal. Prior lows near $64 define important chart support above its 200 DMA line.
>>> The latest Featured Stock Update with an annotated graph appeared on 1/11/2012. Click here.
View all notes |
Alert me of new notes |
CANSLIM.net Company Profile |
SEC |
Zacks Reports |
StockTalk |
News |
Chart |
Request a new note
C
A N
S L
I M
|
V
-
NYSE
Visa Inc Cl A
DIVERSIFIED SERVICES - Business/Management Services
|
$100.56
|
-0.45
-0.45% |
$100.97
|
3,772,078
100.12% of 50 DAV
50 DAV is 3,767,500
|
$104.20
-3.49%
|
10/24/2011
|
$94.21
|
PP = $94.85
|
|
MB = $99.59
|
Most Recent Note - 1/19/2012 5:46:35 PM
G - Reversed into the red for a loss today with slightly higher (near average) volume than the prior session after touching another new all-time high. No overhead supply remains to act as resistance. Its recent low ($98.33 on 1/11/12) and its 50 DMA line define chart support to watch on pullbacks.
>>> The latest Featured Stock Update with an annotated graph appeared on 1/23/2012. Click here.
View all notes |
Alert me of new notes |
CANSLIM.net Company Profile |
SEC |
Zacks Reports |
StockTalk |
News |
Chart |
Request a new note
C
A N
S L
I M
|