You are not logged in.
This means you
CAN ONLY VIEW reports that were published prior to Monday, April 14, 2025.
You
MUST UPGRADE YOUR MEMBERSHIP if you want to see any current reports.
AFTER MARKET UPDATE - MONDAY, JANUARY 25TH, 2010
Previous After Market Report Next After Market Report >>>
|
|
|
|
DOW |
+23.88 |
10,196.86 |
+0.23% |
|
Volume |
1,050,095,310 |
-30% |
|
Volume |
2,177,294,600 |
-23% |
|
NASDAQ |
+5.51 |
2,210.80 |
+0.25% |
|
Advancers |
1,753 |
55% |
|
Advancers |
1,333 |
47% |
|
S&P 500 |
+5.02 |
1,096.78 |
+0.46% |
|
Decliners |
1,290 |
41% |
|
Decliners |
1,385 |
49% |
|
Russell 2000 |
+0.99 |
618.11 |
+0.16% |
|
52 Wk Highs |
75 |
|
|
52 Wk Highs |
34 |
|
|
S&P 600 |
+0.47 |
329.52 |
+0.14% |
|
52 Wk Lows |
6 |
|
|
52 Wk Lows |
11 |
|
|
 |
Major Averages Post Gains On Lighter Volume
Adam Sarhan, Contributing Writer,
Stocks closed with modest gains on Monday as fears subsided that Ben S. Bernanke may not be reconfirmed as chairman of the Federal Reserve. Volume was reported lower than Friday's session on the Nasdaq exchange and on the NYSE which suggested large institutions were not aggressively buying stocks. Monday's gains were enough to mark Day 1 of a new rally attempt for the major averages. Advancers led decliners by nearly a 3-to-2 ratio on the NYSE while the mix was just about even on the Nasdaq exchange. There were only 7 high-ranked companies from the CANSLIM.net Leaders List that made a new 52-week high and appeared on the CANSLIM.net BreakOuts Page, higher than the 4 issues that appeared on the prior session. New 52-week highs still outnumbered new 52-week lows on the NYSE and on the Nasdaq exchange.
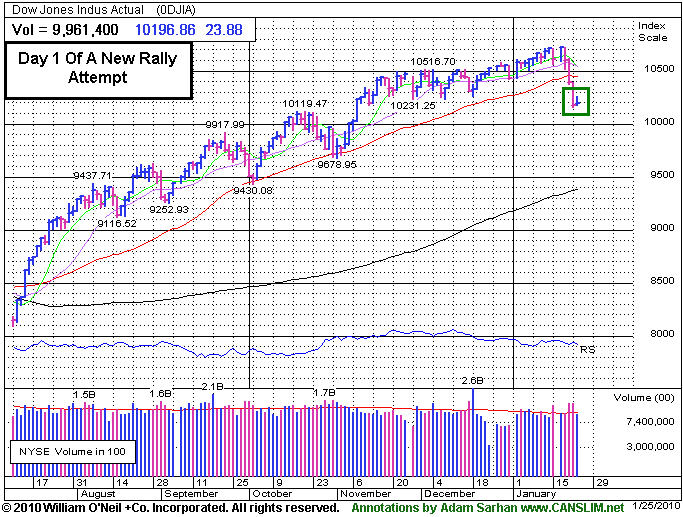
On Friday, January 22, US stocks ended their 46 week rally and entered a correction when all the major averages plunged below their respective 50-day moving average (DMA) lines. Since the March 2009 low, none of the major averages fell more than -10% from their post recovery highs which reiterates how strong this market actually is. Even other developed markets overseas have performed rather well over the past 10 months. However, the Hang Seng Index, Hong Kong's stock market, fell -10% from its recent high which could drag the rest of the world lower.
The latest round of corporate earnings continue to top analysts' estimates but fail to impress Wall Street. This week alone, more than 130 companies in the benchmark S&P 500 are slated to report their Q4 results. Barring some unforeseen event, earnings will have expanded nearly +70% and snapped a record nine-quarter earnings slump. Longstanding readers of this column know that in addition to analyzing the numbers we pay equal, if not more, attention to how the market reacts to the numbers. So far, the reaction has been lackluster at best.
On the economic front, existing home sales plunged in December and missed estimates even though home prices held steady during the month. The report showed sales skidded -16.7% for the largest monthly drop in over 40 years! Meanwhile, the annual rate of 5.45 million units fell short of the Street's estimate for 5.90 million. The data showed that sales plunged across all regions of the country, especially the Midwest, and were split evenly between single-family homes, down -16.8% to a 4.79 million rate, and condos, down -15.4% to 0.66 million. However, investors were pleased that prices actually rose +4.9% on the median to $178,300 and up +6.4% on the average to $225,400.
Looking at the market, Monday marked Day 1 of a new rally attempt which means that as long as Monday's lows are not breached, the earliest a possible follow-through day could emerge will be this Thursday. However, if Monday's lows are taken out, then the day count will be reset and the chances for a steeper correction increase markedly. It is also important to see how the major averages react to their respective 50 DMA lines. Until they all close above that important level the technical damage remaining on the charts is a concern. So far, the market's reaction has been tepid at best to the latest round of economic and earnings data. Remember that the recent series of distribution days coupled with the deleterious action in the major averages suggests large institutions are aggressively selling stocks. Disciplined investors will now wait for a new follow-through day to be produced before resuming any buying efforts. Until then, patience is key.
PICTURED: The Dow Jones Industrial Average's gain marked Day 1 of a new rally attempt.
|
|
|
 |
Internet Index's Recent Deterioration Hurts Group's Outlook
Kenneth J. Gruneisen - Passed the CAN SLIM® Master's Exam
While gains in energy-related shares boosted the Oil Services Index ($OSX +1.46%) and Integrated Oil Index ($XOI +1.00%), the Gold & Silver Index ($XAU -0.97%) and Healthcare Index ($HMO -0.45%) slumped to modest losses. The Retail Index ($RLX +0.03%) ended essentially flat while the Broker/Dealer Index ($XBD +0.52%) and Bank Index ($BKX +0.17%) traded with a slightly positive bias. The Semiconductor Index ($SOX +1.42%) bounced back a little bit after last week's steep losses while the Networking Index ($NWX +0.24%) and Internet Index ($IIX +0.06%) barely put up gains and the Biotechnology Index ($BTK -0.29%) edged lower.
Charts courtesy www.stockcharts.com
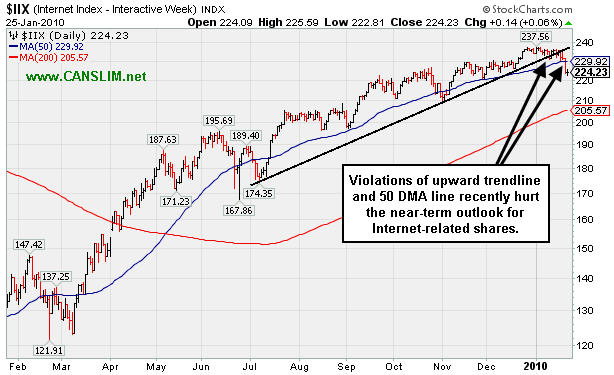
PICTURED: The Internet Index's ($IIX +0.06%) violations of an upward trendline and its 50 DMA line recently hurt the near-term outlook for Internet-related shares.
| Oil Services |
$OSX |
199.92 |
+2.88 |
+1.46% |
+2.57% |
| Healthcare |
$HMO |
1,499.77 |
-6.76 |
-0.45% |
+1.82% |
| Integrated Oil |
$XOI |
1,048.14 |
+10.36 |
+1.00% |
-1.88% |
| Semiconductor |
$SOX |
334.18 |
+4.69 |
+1.42% |
-7.15% |
| Networking |
$NWX |
229.23 |
+0.54 |
+0.24% |
-0.79% |
| Internet |
$IIX |
224.23 |
+0.14 |
+0.06% |
-4.12% |
| Broker/Dealer |
$XBD |
115.34 |
+0.60 |
+0.52% |
+0.25% |
| Retail |
$RLX |
395.76 |
+0.12 |
+0.03% |
-3.74% |
| Gold & Silver |
$XAU |
157.24 |
-1.54 |
-0.97% |
-6.54% |
| Bank |
$BKX |
46.40 |
+0.08 |
+0.17% |
+8.64% |
| Biotech |
$BTK |
957.69 |
-2.75 |
-0.29% |
+1.65% |
|
|
|
 |
No Buy Signal Since Recently Featured in CANSLIM.net News
Kenneth J. Gruneisen - Passed the CAN SLIM® Master's Exam
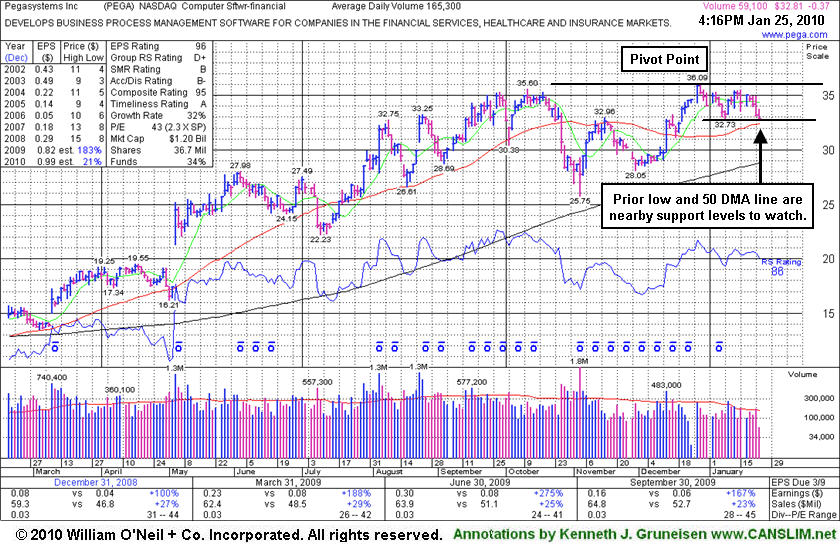
Pegasystems Inc. (PEGA -0.25 or -0.75% to $32.93) suffered a 4th consecutive loss today with light volume, closing near prior chart lows and just above its 50-day moving average (DMA) line in the $32-33 area which define important chart support. Additional deterioration would raise concerns and hurt it chances for the near term. Prior highs in the $35-36 area have been a stubborn resistance level since featured in the January 2010 issue of CANSLIM.net News (read here). Since that appearance it did not trigger a proper technical buy signal, so disciplined investors did not risk any capital if they simply waited for the critical confirming gains that would have dictated taking action.
This high-ranked Computer Software - Financial firm develops, markets, licenses, and supports software to automate various business processes primarily the United States, the United Kingdom, and Europe. It has attracted an increasing number of institutional investors, as the number of top-rated funds owning its shares rose from 43 in Sep '08 to 79 in Dec '09, which is a solid reassurance concerning the investment system's I criteria. PEGA has shown good sales revenues increases and its earnings increases were well above the +25% guideline in the 4 last quarterly comparisons versus the year ago period. The previously noted downturn in annual earnings (the A criteria) from 2003 to 2006 has been followed by a solid turn around and big earnings increases in '07, '08 and '09.
Caution and patience are suggested until the stock manages to trigger a solid technical buy signal with gains above its pivot point. Until then, investors may be wise to resist the urge to get in "early." Confirming gains backed by more than the minimum +50% above average volume guideline would provide a reassuring proof of institutional buying demand which could sustain a more meaningful upward advance. Keep in mind that much of a stock's success depends on the broader market's (the M criteria) ability to sustain a meaningful rally, otherwise 3 out of 4 stocks are likely to struggle in the event that the market encounters more distributional pressure in the new year. Since the market is currently in a corrections, odds are not in favor of new buys working out until a new rally is confirmed with a follow-through-day of gains from at least one of the 3 major market averages.
|
|
|
Color Codes Explained :
Y - Better candidates highlighted by our
staff of experts.
G - Previously featured
in past reports as yellow but may no longer be buyable under the
guidelines.
***Last / Change / Volume quote data in this table corresponds with the timestamp on the note***
Symbol/Exchange
Company Name
Industry Group |
Last |
Chg. |
Vol
% DAV |
Date Featured |
Price Featured |
Latest Pivot Point
Featured |
Status |
| Latest Max Buy Price |
ARST
-
|
$25.62
|
+0.10
|
418,331
82% DAV
509,900
|
12/22/2009
(Date
Featured) |
$25.94
(Price
Featured) |
PP = $27.20 |
G |
| MB = $28.56 |
Most Recent Note - 1/25/2010 4:31:24 PM
G - Posted a quiet gain today after a positive reversal on 1/22/10 for a small gain, struggling to stay above its 50 DMA line since distributional pressure completely negated its latest breakout. ARST was first featured in yellow at $19.91 in the 9/01/09 mid-day report with an annotated daily graph (read here).
>>> The latest Featured Stock Update with an annotated graph appeared on 1/21/2010. click here.
|
|
C
A
S
I |
News |
Chart |
SEC
View all notes Alert
me of new notes
Company
Profile
|
ASIA
-
|
$24.40
|
-0.45
|
1,092,453
85% DAV
1,285,900
|
12/24/2009
(Date
Featured) |
$31.05
(Price
Featured) |
PP = $32.40 |
G |
| MB = $34.02 |
Most Recent Note - 1/25/2010 4:33:42 PM
G - Loss today with lighter volume was its 12th loss in 14 sessions, but it has still failed to make a stand since noted on 1/20/10 - "violating its 50-day moving average (DMA) line and breaching recent chart lows, raising concerns and triggering technical sell signals." Traded up as much as +68.13% since first featured in the August 2009 CANSLIM.net News (read here).
>>> The latest Featured Stock Update with an annotated graph appeared on 1/12/2010. click here.
|
|
C
A
S
I |
News |
Chart |
SEC
View all notes Alert
me of new notes
Company
Profile
|
BIDU
- NASDAQ
Baidu Inc Ads
INTERNET - Internet Information Providers
|
$415.16
|
-1.74
|
1,033,607
56% DAV
1,829,900
|
1/13/2010
(Date
Featured) |
$431.25
(Price
Featured) |
PP = $426.75 |
G |
| MB = $448.09 |
Most Recent Note - 1/25/2010 4:38:04 PM
G - Small loss today on very quiet volume after a gap down on 1/22/10 and violation of its 50 DMA line while falling on higher than average volume. A 1/19/10 gap down for a considerable loss on above average volume pressured it under its November '09 high closes.
>>> The latest Featured Stock Update with an annotated graph appeared on 1/14/2010. click here.
|
|
C
A
S
I |
News |
Chart |
SEC
View all notes Alert
me of new notes
Company
Profile
|
CAAS
- NASDAQ
China Automotive Systems
AUTOMOTIVE - Auto Parts
|
$18.51
|
+0.19
|
1,013,645
83% DAV
1,215,900
|
11/30/2009
(Date
Featured) |
$18.84
(Price
Featured) |
PP = $17.62 |
G |
| MB = $18.50 |
Most Recent Note - 1/25/2010 4:40:02 PM
G - Small gain today on lighter volume halted a losing streak of losses on higher volume that violated its short-term average line last week while many China-based firms encountered heavy distributional pressure. CAAS was actually rather late-stage at $18.84 when first featured in the 11/30/09 mid-day report (read here).
>>> The latest Featured Stock Update with an annotated graph appeared on 1/15/2010. click here.
|
|
C
A
S
I |
News |
Chart |
SEC
View all notes Alert
me of new notes
Company
Profile
|
CACC
- NASDAQ
Credit Acceptance Corp
FINANCIAL SERVICES - Credit Services
|
$49.15
|
+0.07
|
37,479
80% DAV
46,800
|
9/29/2009
(Date
Featured) |
$33.48
(Price
Featured) |
PP = $37.10 |
G |
| MB = $38.96 |
Most Recent Note - 1/25/2010 4:41:17 PM
G - Small gain today on light volume, stubbornly holding its ground near all-time highs, but extended from any sound base. It is well above its 50 DMA line, an important support level to watch.
>>> The latest Featured Stock Update with an annotated graph appeared on 1/8/2010. click here.
|
|
C
A
S
I |
News |
Chart |
SEC
View all notes Alert
me of new notes
Company
Profile
|
CRM
- NYSE
Salesforce.com Inc
INTERNET - Internet Software & Services
|
$64.13
|
-0.41
|
2,465,792
127% DAV
1,938,200
|
12/18/2009
(Date
Featured) |
$67.32
(Price
Featured) |
PP = $67.82 |
G |
| MB = $71.21 |
Most Recent Note - 1/25/2010 4:43:05 PM
G - Today's loss on slightly higher than average volume was its 4th consecutive loss. Last week's deterioration below its 50 DMA line and under its November '09 high close triggered technical sell signals. A damaging gap down on 1/12/10 was noted as "indicative of institutional (I criteria) distribution."
>>> The latest Featured Stock Update with an annotated graph appeared on 1/6/2010. click here.
|
|
C
A
S
I |
News |
Chart |
SEC
View all notes Alert
me of new notes
Company
Profile
|
CTRP
- NASDAQ
Ctrip.com Intl Ltd Adr
LEISURE - Resorts & Casinos
|
$32.64
|
+0.78
|
1,933,296
90% DAV
2,142,200
|
1/14/2010
(Date
Featured) |
$36.67
(Price
Featured) |
PP = $39.35 |
G |
| MB = $41.32 |
Most Recent Note - 1/25/2010
G - Small gain today on lighter volume. Damaging losses with above average volume last week violated its 50 DMA line and recent chart lows, triggering technical sell signals. Do not be confused by the 2:1 split effective as of 1/21/10.
>>> The latest Featured Stock Update with an annotated graph appeared on 1/20/2010. click here.
|
|
C
A
S
I |
News |
Chart |
SEC
View all notes Alert
me of new notes
Company
Profile
|
GMCR
- NASDAQ
Green Mtn Coffee Roastrs
FOOD & BEVERAGE - Processed & Packaged Goods
|
$79.98
|
-1.18
|
1,283,082
77% DAV
1,667,700
|
12/28/2009
(Date
Featured) |
$77.49
(Price
Featured) |
PP = $76.50 |
G |
| MB = $80.33 |
Most Recent Note - 1/25/2010 4:49:10 PM
G - Consolidating in a tight range for the past 4 weeks perched near all-time highs. Keep in mind that market conditions (M criteria) have recently turned less favorable for stock buyers, and investors' bias should be toward raising cash rather than accumulating shares during market corrections. Support to watch is at prior high closes in the $76-77 area.
>>> The latest Featured Stock Update with an annotated graph appeared on 1/13/2010. click here.
|
|
C
A
S
I |
News |
Chart |
SEC
View all notes Alert
me of new notes
Company
Profile
|
HEAT
-
|
$13.71
|
+0.21
|
1,246,964
97% DAV
1,279,400
|
1/6/2010
(Date
Featured) |
$17.19
(Price
Featured) |
PP = $17.27 |
G |
| MB = $18.13 |
Most Recent Note - 1/25/2010 4:51:43 PM
G - Closed today with a gain on lighter volume after a choppy session. Last week's 50 DMA line violation and damaging losses on higher volume triggered technical sell signals while also sinking under prior chart lows in the $14 area.
>>> The latest Featured Stock Update with an annotated graph appeared on 1/19/2010. click here.
|
|
C
A
S
I |
News |
Chart |
SEC
View all notes Alert
me of new notes
Company
Profile
|
ISRG
- NASDAQ
Intuitive Surgical Inc
HEALTH SERVICES - Medical Appliances & Equipment
|
$338.51
|
-1.84
|
656,016
132% DAV
496,500
|
1/22/2010
(Date
Featured) |
$340.40
(Price
Featured) |
PP = $314.00 |
Y |
| MB = $329.70 |
Most Recent Note - 1/25/2010 4:52:53 PM
Y - Held its ground stubbornly today. It was featured in yellow in the 1/22/10 mid-day report (read here) when hitting a new 52-week high with its "breakaway gap" following 4-weeks of tight consolidation after reporting accelerating sales and earnings increases for the period ended Dec 31, 2009. The action exemplifies that stocks often have swift reactions to fundamental news, so investors can expect to encounter greater volume and volatility during earnings season. Its annual earnings history (the A criteria) has been very impressive. ISRG has rebounded impressively from its March low ($84.86) and may be on course for its all-time high ($359 in 2007). Notes outlined technical deterioration before and when it was dropped from the Featured Stocks list on 6/10/08. ISRG traded up more than 13-fold since first featured in yellow in CANSLIM.net reports in the summer of 2004.
>>> The latest Featured Stock Update with an annotated graph appeared on 1/22/2010. click here.
|
|
C
A
S
I |
News |
Chart |
SEC
View all notes Alert
me of new notes
Company
Profile
|
LFT
-
|
$36.72
|
+1.32
|
749,391
165% DAV
453,400
|
11/17/2009
(Date
Featured) |
$31.77
(Price
Featured) |
PP = $33.04 |
G |
| MB = $34.69 |
Most Recent Note - 1/25/2010 4:55:21 PM
G - Positive reversal today for a considerable gain with above average volume, rallying back above its 50 DMA line, helping its outlook improve. Widespread weakness in China-based issues has clearly been a factor in recent days.
>>> The latest Featured Stock Update with an annotated graph appeared on 1/5/2010. click here.
|
|
C
A
S
I |
News |
Chart |
SEC
View all notes Alert
me of new notes
Company
Profile
|
PEGA
- NASDAQ
Pegasystems Inc
COMPUTER SOFTWARE & SERVICES - Business Software & Services
|
$32.93
|
-0.25
|
70,245
42% DAV
165,300
|
1/4/2010
(Date
Featured) |
$34.00
(Price
Featured) |
PP = $36.19 |
Y |
| MB = $38.00 |
Most Recent Note - 1/25/2010 4:26:02 PM
Y - Suffered a 4th consecutive loss today with light volume, closing near prior chart lows and just above its 50 DMA line in the $32-33 area which define important chart support. Prior highs in the $35-36 area have been a stubborn resistance level since featured in the January 2010 issue of CANSLIM.net News (read here).
>>> The latest Featured Stock Update with an annotated graph appeared on 1/25/2010. click here.
|
|
C
A
S
I |
News |
Chart |
SEC
View all notes Alert
me of new notes
Company
Profile
|
VIT
-
|
$17.56
|
-0.74
|
516,623
91% DAV
568,000
|
12/24/2009
(Date
Featured) |
$20.07
(Price
Featured) |
PP = $21.17 |
G |
| MB = $22.23 |
Most Recent Note - 1/25/2010 4:28:33 PM
G - Loss on average volume today showed a lack of support after its considerable loss on 1/22/10 with more than 2 times average volume violated recent chart lows and its 50 DMA line, raising concerns and triggering a technical sell signal. Distributional pressure raised concerns as it abruptly reversed under its pivot point following its big 1/06/10 gain on heavy volume and 1/11/10 gain on +36% above average volume.
>>> The latest Featured Stock Update with an annotated graph appeared on 1/11/2010. click here.
|
|
C
A
S
I |
News |
Chart |
SEC
View all notes Alert
me of new notes
Company
Profile
|
|
 |
|
| Subscriber Questions: |
January 23, 2010 |
Ken,
For a stock to qualify as a Featured Stock does the stock have to experience a technical buy signal?
Gil |
| Ken's Response: |
January 25, 2010 |
Dear Gil,
Thanks for writing in with a great question. The answer is NO - for a stock to qualify as a Featured Stock it does not have to experience a technical buy signal. Stocks appearing on the Featured Stocks page may be on the cusp of possibly triggering a technical buy signal, or they may have already triggered a recent or earlier technical buy signal(s). However, stocks appearing on the Featured Stocks page could also be in the midst of corrections and they may have triggered recent technical sell signals. Featured Stocks are closely monitored and routinely summarized through the expert notes and occasional appearances members will see with annotated graphs in the Featured Stock Update section of the daily After Market Update. Key support and resistance levels and technical buy/sell signals are discussed and analyzed on an ongoing basis, which makes CANSLIM.net reports a great help to members in determining if the stock is an ideal candidate for them to buy or sell.
We like to leverage the Q&A with members when they ask good questions! For example, several months ago there was question about the color codes (read here) which are used on the Featured Stocks coverage to help members quickly see which issues may be most action-worthy under the investment system guidelines. The answer we provided appeared, like this response will, in the "Mail Bag - Q&A" section which is occasionally inserted into the daily After Market Update.
Please let me know if you have any feedback or suggestions on how we can make the reports any clearer and easier to use by filling out the inquiry form.

Kenneth J. Gruneisen
Founder & Contributing Writer for CANSLIM.net
www.canslim.net |
|
|
|
THESE ARE NOT BUY RECOMMENDATIONS!
Comments contained in the body of this report are technical
opinions only. The material herein has been obtained
from sources believed to be reliable and accurate, however,
its accuracy and completeness cannot be guaranteed.
This site is not an investment advisor, hence it does
not endorse or recommend any securities or other investments.
Any recommendation contained in this report may not
be suitable for all investors and it is not to be deemed
an offer or solicitation on our part with respect to
the purchase or sale of any securities. All trademarks,
service marks and trade names appearing in this report
are the property of their respective owners, and are
likewise used for identification purposes only.
This report is a service available
only to active Paid Premium Members.
You may opt-out of receiving report notifications
at any time. Questions or comments may be submitted
by writing to Premium Membership Services 665 S.E. 10 Street, Suite 201 Deerfield Beach, FL 33441-5634 or by calling 1-800-965-8307
or 954-785-1121.
|
|
|


