You are not logged in.
This means you
CAN ONLY VIEW reports that were published prior to Monday, April 14, 2025.
You
MUST UPGRADE YOUR MEMBERSHIP if you want to see any current reports.
AFTER MARKET UPDATE - TUESDAY, JANUARY 24TH, 2012
Previous After Market Report Next After Market Report >>>
|
|
|
|
DOW |
-33.07 |
12,675.75 |
-0.26% |
|
Volume |
742,708,940 |
+3% |
|
Volume |
1,569,592,100 |
-4% |
|
NASDAQ |
+2.47 |
2,786.64 |
+0.09% |
|
Advancers |
1,617 |
52% |
|
Advancers |
1,491 |
57% |
|
S&P 500 |
-1.35 |
1,314.65 |
-0.10% |
|
Decliners |
1,378 |
44% |
|
Decliners |
999 |
38% |
|
Russell 2000 |
+5.22 |
788.27 |
+0.67% |
|
52 Wk Highs |
85 |
|
|
52 Wk Highs |
56 |
|
|
S&P 600 |
+3.11 |
440.72 |
+0.71% |
|
52 Wk Lows |
10 |
|
|
52 Wk Lows |
14 |
|
|
 |
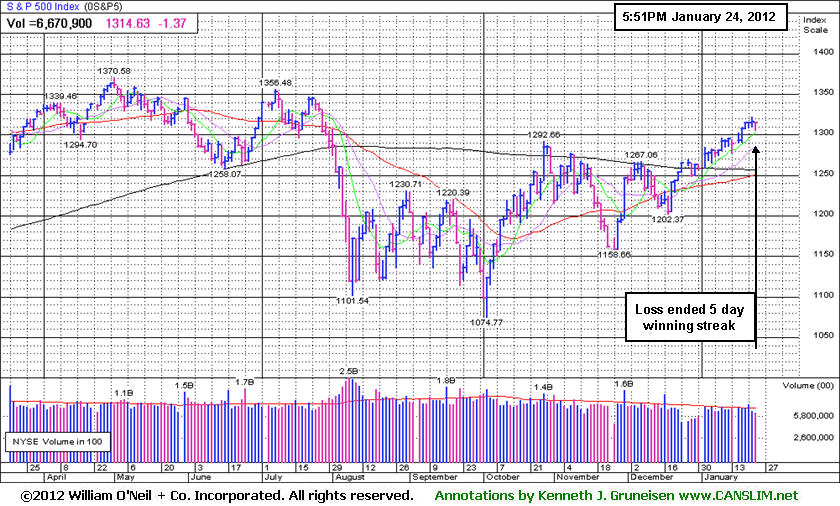
State of Calm; Indices Pause Following 3 Weekly Wins
Kenneth J. Gruneisen - Passed the CAN SLIM® Master's Exam
Tuesday's volume totals were mixed, higher than the prior session on the NYSE and lower on the Nasdaq exchange. Advancers led decliners 8-7 on the NYSE while advancers led decliners by a 3-2 margin on the Nasdaq exchange. Stocks hitting new 52-week highs easily outnumbered new 52-week lows on both exchanges. There were 46 high-ranked companies from the CANSLIM.net Leaders List that made new 52-week highs and appeared on the CANSLIM.net BreakOuts Page, matching the prior session total of 46 stocks. There were gains for 11 of the 19 high-ranked companies currently included on the Featured Stocks Page.
Headlines out of Europe and earnings results continue to weigh on investor sentiment. Stocks were lower at the open amid a stalemate between European policy makers and Greek bondholders. European Union finance ministers rejected proposals by private creditors over the extent of the debt losses they were willing to accept in order to avoid a Greek default. Also from the region, S&P said it will likely downgrade Greece's ratings to "selective default" when the country concludes its debt restructuring, and the head of the International Monetary Fund said the group needs an additional $500 billion to help prevent the debt crisis from spreading.
Fourth-quarter earnings season ramped up with a mixed bag of earnings reports. E.I. du Pont de Nemours and Co (DD +0.12%) ended flat after earnings topped expectations, but revenue missed estimates. Verizon Communications Inc (VZ -1.59%) posted a rare drop in operating income for the fourth quarter after booking a pension charge and due to higher iPhone costs. The Travelers Companies, Inc (TRV -3.80%) reported earnings slightly below analysts' forecasts as its fourth-quarter profit fell 31%. Texas Instruments Inc (TXN -2.02%) edged lower as sales and profit declined less than predicted. Johnson & Johnson's (JNJ unch) earnings beat expectations and its shares were unchanged despite issuing disappointing guidance. McDonald's Corp (MCD -2.18%) fell despite reporting net income that rose by +16% in the fourth quarter.
The 10-year Treasury note was off 1/32 to yield 2.05% as the government sold $35 billion of 2-year notes. The Federal Reserve began its two-day policy meeting with an announcement on interest rates due out Wednesday. Also, for the first time it will offer interest rate forecasts. Markets had a cautious tone as investors looked ahead to the State of the Union address from President Obama.
The recent expansion in leadership (stocks making new 52-week highs) has been noted as a reassuring sign concerning the current confirmed market uptrend and the M criteria, as a healthy crop of strong leaders is necessary for any sustained market advance. Technical improvement from financial shares and key growth areas including the tech sector has been another encouraging sign helping the market outlook.
The Q4 2011 CANSLIM.net Webcast is still available "ON DEMAND" to all upgraded members at no additional cost. Via the Premium Member Homepage links to all prior reports and webcasts are always available.
PICTURED: The S&P 500 Index ended its five-day advance.
|
 Kenneth J. Gruneisen started out as a licensed stockbroker in August 1987, a couple of months prior to the historic stock market crash that took the Dow Jones Industrial Average down -22.6% in a single day. He has published daily fact-based fundamental and technical analysis on high-ranked stocks online for two decades. Through FACTBASEDINVESTING.COM, Kenneth provides educational articles, news, market commentary, and other information regarding proven investment systems that work in good times and bad.
Comments contained in the body of this report are technical opinions only and are not necessarily those of Gruneisen Growth Corp. The material herein has been obtained from sources believed to be reliable and accurate, however, its accuracy and completeness cannot be guaranteed. Our firm, employees, and customers may effect transactions, including transactions contrary to any recommendation herein, or have positions in the securities mentioned herein or options with respect thereto. Any recommendation contained in this report may not be suitable for all investors and it is not to be deemed an offer or solicitation on our part with respect to the purchase or sale of any securities. |
|
 |
Mixed Group Action With Little Decisiveness
Kenneth J. Gruneisen - Passed the CAN SLIM® Master's Exam
The Networking Index ($NWX +1.28%) and Biotechnology Index ($BTK +1.38%) led the tech sector higher while the Semiconductor Index ($SOX +0.35%) and Internet Index ($IIX +0.42%) followed with smaller gains. The Broker/Dealer Index ($XBD -0.85%) slumped while the Bank Index ($BKX -0.07%) finished flat, meanwhile the Retail Index ($RLX +0.69%) was a positive influence on the major averages and the Oil Services Index ($OSX +0.73%) tallied a gain. The Healthcare Index ($HMO -0.45%) ended with a small loss, rounding out a mixed session marked by little decisiveness.
Charts courtesy www.stockcharts.com
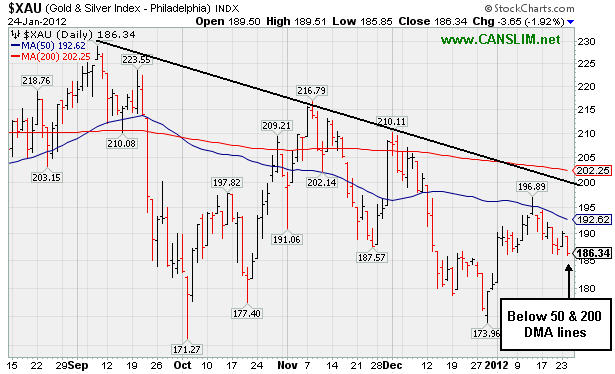
PICTURED: The Gold & Silver Index ($XAU -1.92%) appeared to be the session's worst laggard. The XAU has shown a negative bias for months and is trading below its 50 & 200-day moving average (DMA) lines.
| Oil Services |
$OSX |
235.76 |
+1.70 |
+0.73% |
+9.01% |
| Healthcare |
$HMO |
2,496.91 |
-11.17 |
-0.45% |
+9.44% |
| Integrated Oil |
$XOI |
1,281.61 |
-1.89 |
-0.15% |
+4.27% |
| Semiconductor |
$SOX |
414.54 |
+1.45 |
+0.35% |
+13.75% |
| Networking |
$NWX |
247.28 |
+3.12 |
+1.28% |
+14.93% |
| Internet |
$IIX |
298.52 |
+1.25 |
+0.42% |
+5.96% |
| Broker/Dealer |
$XBD |
94.83 |
-0.81 |
-0.85% |
+13.88% |
| Retail |
$RLX |
553.53 |
+3.81 |
+0.69% |
+5.80% |
| Gold & Silver |
$XAU |
186.34 |
-3.65 |
-1.92% |
+3.16% |
| Bank |
$BKX |
43.47 |
-0.03 |
-0.07% |
+10.39% |
| Biotech |
$BTK |
1,248.95 |
+16.97 |
+1.38% |
+14.43% |
|
|
|
 |
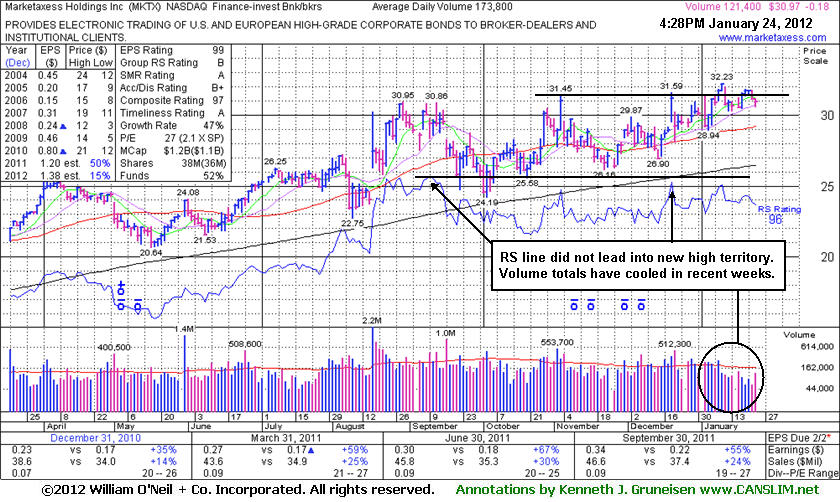
Relatively Uninspired Leader Sees Volume Cooling
Kenneth J. Gruneisen - Passed the CAN SLIM® Master's Exam
Marketaxess Holdings Inc's (MKTX -$0.18 or -0.58% to $30.97) last appearance in this FSU section was on 12/20/11 with an annotated graph under the headline, " Volume Backed Gains Lift Stock Above Pivot Point Previously Cited", as it posted a solid gain with +88% above average volume, its 4th consecutive gain, finishing at a best-ever close. It was added - "If a new pivot point was now cited based upon its 11/03/11 high ($31.45) the close today would technically have fallen short of triggering a proper buy signal. Additional confirming gains would be a welcome reassurance." Since then there was an immediate gap down followed by some wedging action.
The annotated graph below illustrates where daily volume totals have been cooling in recent weeks while the stock has been hovering near its all-time high. There is no resistance remaining due to overhead supply. Given such favorable circumstance, its inability to make meaningful price progress raises concern and has also led to the development of a minor technical flaw. Its 96 Relative Strength rating remains very adequate as far as buy candidates are concerned, well above the 80+ guideline. But upon closer inspection, the Relative Strength line (jagged blue line) peaked out earlier. The RS line failed to lead the way into new high territory as (or before, preferably) the stock saw its price actually reach new all-time high territory. Superior buy candidates in the past winning models studied frequently saw their RS lines leading the way into new high territory before the price rose and also hit new high ground.
Its fundamentals remain strong and it reported earnings +55% on +24% sales revenues for the quarter ended September 30, 2011 versus the year ago period. MKTX has earned high ranks and reasonably satisfies the guidelines concerning quarterly and annual earnings (C and A criteria), however a downturn in FY '08 was previously noted as a flaw. Additionally, the Finance - Investment Bankers industry group currently has a Group Relative Strength rating of 62 which indicates the group has been a mediocre performer rather than a truly strong group showing great leadership (L criteria). The number of top-rated funds owning its shares rose from 168 in Dec '10 to 242 in Dec '11, a reassuring sign concerning the I criteria.
|
|
|
Color Codes Explained :
Y - Better candidates highlighted by our
staff of experts.
G - Previously featured
in past reports as yellow but may no longer be buyable under the
guidelines.
***Last / Change / Volume data in this table is the closing quote data***
Symbol/Exchange
Company Name
Industry Group |
PRICE |
CHANGE
(%Change) |
Day High |
Volume
(% DAV)
(% 50 day avg vol) |
52 Wk Hi
% From Hi |
Featured
Date |
Price
Featured |
Pivot Featured |
|
Max Buy |
ADS
-
NYSE
Alliance Data Sys Corp
COMPUTER SOFTWARE and SERVICES - Information and Delivery Service
|
$110.50
|
+1.71
1.57% |
$110.80
|
762,734
112.13% of 50 DAV
50 DAV is 680,200
|
$110.16
0.31%
|
1/17/2012
|
$108.24
|
PP = $107.43
|
|
MB = $112.80
|
Most Recent Note - 1/20/2012 3:57:58 PM
Y - Perched at its all-time high with volume totals cooling since its 1/17/12 gain backed by +40% above average volume, near the bare minimum volume required to trigger a proper technical buy signal. Its 50 DMA line and the 1/04/12 session low ($100.42) define near-term support where violations would raise greater concerns and trigger technical sell signals.
>>> The latest Featured Stock Update with an annotated graph appeared on 1/17/2012. Click here.
View all notes |
Alert me of new notes |
CANSLIM.net Company Profile |
SEC |
Zacks Reports |
StockTalk |
News |
Chart |
Request a new note
C
A N
S L
I M


|
ALXN
-
NASDAQ
Alexion Pharmaceuticals
DRUGS - Drug Manufacturers - Other
|
$73.98
|
-0.35
-0.47% |
$74.96
|
1,094,129
91.03% of 50 DAV
50 DAV is 1,202,000
|
$77.58
-4.64%
|
11/30/2011
|
$68.66
|
PP = $70.52
|
|
MB = $74.05
|
Most Recent Note - 1/20/2012 2:40:04 PM
Y - Pulling back below its "max buy" level with today's 3rd consecutive loss and its color code is changed to yellow. Prior resistance in the $70 area defines initial chart support above its 50 DMA line.
>>> The latest Featured Stock Update with an annotated graph appeared on 1/13/2012. Click here.
View all notes |
Alert me of new notes |
CANSLIM.net Company Profile |
SEC |
Zacks Reports |
StockTalk |
News |
Chart |
Request a new note
C
A N
S L
I M
|
CATM
-
NASDAQ
Cardtronics Inc
DIVERSIFIED SERVICES - Business/Management Services
|
$27.66
|
+0.38
1.39% |
$27.69
|
299,936
88.74% of 50 DAV
50 DAV is 338,000
|
$28.74
-3.76%
|
12/23/2011
|
$28.64
|
PP = $28.56
|
|
MB = $29.99
|
Most Recent Note - 1/19/2012 11:46:41 AM
Y - Considerable gain today with above average volume following a new analyst buy rating. Rallying above its 50 DMA line, helping its technical stance improve with a 3rd consecutive gain. Color code was changed to yellow while approaching its previously cited pivot point and trading within close striking distance of its 52-week high.
>>> The latest Featured Stock Update with an annotated graph appeared on 12/23/2011. Click here.
View all notes |
Alert me of new notes |
CANSLIM.net Company Profile |
SEC |
Zacks Reports |
StockTalk |
News |
Chart |
Request a new note
C
A N
S L
I M
|
CELG
-
NASDAQ
Celgene Corp
DRUGS - Drug Manufacturers - Major
|
$74.02
|
+0.59
0.80% |
$74.04
|
2,947,237
84.60% of 50 DAV
50 DAV is 3,483,900
|
$75.11
-1.45%
|
12/20/2011
|
$66.68
|
PP = $68.35
|
|
MB = $71.77
|
Most Recent Note - 1/20/2012 12:04:47 PM
G - Today's gain has it challenging its 52-week high hit on Tuesday and trading within close striking distance of its all-time high ($77.39 in Aug '08). Prior highs in the $68 area define support to watch on pullbacks.
>>> The latest Featured Stock Update with an annotated graph appeared on 12/29/2011. Click here.
View all notes |
Alert me of new notes |
CANSLIM.net Company Profile |
SEC |
Zacks Reports |
StockTalk |
News |
Chart |
Request a new note
C
A N
S L
I M
|
FEIC
-
NASDAQ
F E I Co
ELECTRONICS - Diversified Electronics
|
$44.61
|
+0.40
0.90% |
$44.64
|
241,450
86.79% of 50 DAV
50 DAV is 278,200
|
$44.99
-0.84%
|
12/7/2011
|
$41.41
|
PP = $42.35
|
|
MB = $44.47
|
Most Recent Note - 1/23/2012 12:47:34 PM
G - Quietly consolidating near its all-time high and "max buy" level, slightly extended from its prior base. No overhead supply remains to hinder its upward progress. The 50 DMA line defines chart support above prior lows.
>>> The latest Featured Stock Update with an annotated graph appeared on 12/21/2011. Click here.
View all notes |
Alert me of new notes |
CANSLIM.net Company Profile |
SEC |
Zacks Reports |
StockTalk |
News |
Chart |
Request a new note
C
A N
S L
I M
|
Symbol/Exchange
Company Name
Industry Group |
PRICE |
CHANGE
(%Change) |
Day High |
Volume
(% DAV)
(% 50 day avg vol) |
52 Wk Hi
% From Hi |
Featured
Date |
Price
Featured |
Pivot Featured |
|
Max Buy |
GNC
-
NYSE
G N C Holdings Inc
RETAIL - Drug Stores
|
$29.05
|
-0.35
-1.19% |
$29.29
|
840,243
81.30% of 50 DAV
50 DAV is 1,033,500
|
$29.50
-1.53%
|
1/19/2012
|
$28.99
|
PP = $29.60
|
|
MB = $31.08
|
Most Recent Note - 1/23/2012 12:49:23 PM
Y - Touched a new 52-week high today. Color code was changed to yellow with new pivot point cited after forming a new flat base pattern. See the latest FSU analysis for more details and a new annotated graph.
>>> The latest Featured Stock Update with an annotated graph appeared on 1/19/2012. Click here.
View all notes |
Alert me of new notes |
CANSLIM.net Company Profile |
SEC |
Zacks Reports |
StockTalk |
News |
Chart |
Request a new note
C
A N
S L
I M
|
HMSY
-
NASDAQ
H M S Holdings Corp
COMPUTER SOFTWARE and SERVICES - Healthcare Information Service
|
$33.10
|
-0.09
-0.27% |
$33.25
|
618,121
68.60% of 50 DAV
50 DAV is 901,100
|
$34.73
-4.69%
|
10/27/2011
|
$26.44
|
PP = $28.37
|
|
MB = $29.79
|
Most Recent Note - 1/23/2012 12:38:00 PM
G - Pulling back on light volume while perched near its all-time high after recent gains with below average volume. No resistance remains to hinder its progress, but it is extended from its prior base.
>>> The latest Featured Stock Update with an annotated graph appeared on 12/28/2011. Click here.
View all notes |
Alert me of new notes |
CANSLIM.net Company Profile |
SEC |
Zacks Reports |
StockTalk |
News |
Chart |
Request a new note
C
A N
S L
I M
|
ISRG
-
NASDAQ
Intuitive Surgical Inc
HEALTH SERVICES - Medical Appliances and Equipment
|
$440.00
|
-4.39
-0.99% |
$446.09
|
422,335
121.96% of 50 DAV
50 DAV is 346,300
|
$476.49
-7.66%
|
12/20/2011
|
$442.43
|
PP = $449.16
|
|
MB = $471.62
|
Most Recent Note - 1/23/2012 12:03:08 PM
Y - Holding its ground today. Showed resilience and closed in the upper part of its intra-day range after gapping down on the prior session and briefly undercutting below prior lows and its 50 DMA line. Reported earnings +24% on +28% sales revenues for the quarter ended December 31, 2011 versus the year ago period.
>>> The latest Featured Stock Update with an annotated graph appeared on 1/18/2012. Click here.
View all notes |
Alert me of new notes |
CANSLIM.net Company Profile |
SEC |
Zacks Reports |
StockTalk |
News |
Chart |
Request a new note
C
A N
S L
I M
|
LULU
-
NASDAQ
Lululemon Athletica
MANUFACTURING - Textile Manufacturing
|
$62.18
|
-0.26
-0.42% |
$62.30
|
1,617,580
41.13% of 50 DAV
50 DAV is 3,932,700
|
$64.49
-3.58%
|
1/10/2012
|
$60.97
|
PP = $59.46
|
|
MB = $62.43
|
Most Recent Note - 1/23/2012 12:41:00 PM
Y - Holding its ground in a tight range since the considerable gap up gain on 1/10/12 helped it break out from a "double bottom" base. The company recently raised its outlook, which is a reassuring sign. Prior chart highs in the low $60s have been acting as a recent resistance level.
>>> The latest Featured Stock Update with an annotated graph appeared on 1/10/2012. Click here.
View all notes |
Alert me of new notes |
CANSLIM.net Company Profile |
SEC |
Zacks Reports |
StockTalk |
News |
Chart |
Request a new note
C
A N
S L
I M
|
MA
-
NYSE
Mastercard Inc Cl A
DIVERSIFIED SERVICES - Business/Management Services
|
$342.68
|
+3.62
1.07% |
$344.60
|
682,994
66.94% of 50 DAV
50 DAV is 1,020,300
|
$384.99
-10.99%
|
1/3/2012
|
$367.87
|
PP = $385.09
|
|
MB = $404.34
|
Most Recent Note - 1/20/2012 2:31:02 PM
G - Gapped down today for a damaging loss with above average volume, slumping near its recent low. Its 200 DMA line is the nearest support level to watch. A rebound above its 50 DMA line is needed, otherwise its technical stance is not that of a sound looking buy candidate.
>>> The latest Featured Stock Update with an annotated graph appeared on 1/3/2012. Click here.
View all notes |
Alert me of new notes |
CANSLIM.net Company Profile |
SEC |
Zacks Reports |
StockTalk |
News |
Chart |
Request a new note
C
A N
S L
I M
|
Symbol/Exchange
Company Name
Industry Group |
PRICE |
CHANGE
(%Change) |
Day High |
Volume
(% DAV)
(% 50 day avg vol) |
52 Wk Hi
% From Hi |
Featured
Date |
Price
Featured |
Pivot Featured |
|
Max Buy |
MKTX
-
NASDAQ
Marketaxess Holdings Inc
FINANCIAL SERVICES - Investment Brokerage - Nationa
|
$30.97
|
-0.18
-0.58% |
$31.19
|
133,038
76.55% of 50 DAV
50 DAV is 173,800
|
$32.23
-3.91%
|
10/28/2011
|
$29.79
|
PP = $31.05
|
|
MB = $32.60
|
Most Recent Note - 1/23/2012 12:44:40 PM
Y - Volume totals have been cooling in recent weeks while hovering near its all-time high and no resistance remains due to overhead supply. The 50 DMA line defines initial chart support to watch.
>>> The latest Featured Stock Update with an annotated graph appeared on 1/24/2012. Click here.
View all notes |
Alert me of new notes |
CANSLIM.net Company Profile |
SEC |
Zacks Reports |
StockTalk |
News |
Chart |
Request a new note
C
A N
S L
I M
|
OSIS
-
NASDAQ
O S I Systems Inc
ELECTRONICS - Semiconductor Equipment and Mate
|
$56.46
|
+3.35
6.31% |
$56.62
|
341,065
357.89% of 50 DAV
50 DAV is 95,300
|
$56.50
-0.07%
|
11/1/2011
|
$42.07
|
PP = $45.57
|
|
MB = $47.85
|
 Most Recent Note - 1/24/2012 12:10:13 PM
G - Gapped up today after it reported earnings +20% on +11% sales revenues for the quarter ended December 31, 2011 versus the year ago period. Results below the +25% minimum earnings guideline, and marking its weakest earnings comparison in 2 years, raised concerns. Its 50 DMA line defines important support to watch.
>>> The latest Featured Stock Update with an annotated graph appeared on 12/27/2011. Click here.
View all notes |
Alert me of new notes |
CANSLIM.net Company Profile |
SEC |
Zacks Reports |
StockTalk |
News |
Chart |
Request a new note
C
A N
S L
I M
|
PRGO
-
NASDAQ
Perrigo Co
DRUGS - Drug Related Products
|
$97.54
|
-2.12
-2.13% |
$99.24
|
982,746
76.96% of 50 DAV
50 DAV is 1,277,000
|
$104.70
-6.84%
|
12/9/2011
|
$99.54
|
PP = $101.56
|
|
MB = $106.64
|
Most Recent Note - 1/24/2012 11:23:38 AM
G - Still quietly perched just -6.6% off its 52-week high with little resistance remaining due to overhead supply. Found support at its 50 DMA line
>>> The latest Featured Stock Update with an annotated graph appeared on 1/9/2012. Click here.
View all notes |
Alert me of new notes |
CANSLIM.net Company Profile |
SEC |
Zacks Reports |
StockTalk |
News |
Chart |
Request a new note
C
A N
S L
I M
|
RAX
-
NYSE
Rackspace Hosting Inc
INTERNET - Internet Software and; Services
|
$42.94
|
+0.66
1.56% |
$43.04
|
1,730,231
112.69% of 50 DAV
50 DAV is 1,535,400
|
$46.50
-7.65%
|
11/8/2011
|
$44.28
|
PP = $46.27
|
|
MB = $48.58
|
Most Recent Note - 1/20/2012 7:22:50 PM
G - Color code is changed to green after today's loss on slightly higher volume led to a close below its 50 DMA line. Its recent low ($41.37 on 1/09/12) defines important near-term support to watch above its 200 DMA line.
>>> The latest Featured Stock Update with an annotated graph appeared on 1/5/2012. Click here.
View all notes |
Alert me of new notes |
CANSLIM.net Company Profile |
SEC |
Zacks Reports |
StockTalk |
News |
Chart |
Request a new note
C
A N
S L
I M
|
SXCI
-
NASDAQ
S X C Health Solutions
COMPUTER SOFTWARE and SERVICES - Healthcare Information Service
|
$62.64
|
+0.26
0.42% |
$62.95
|
160,363
41.05% of 50 DAV
50 DAV is 390,700
|
$66.40
-5.66%
|
1/10/2012
|
$62.05
|
PP = $60.10
|
|
MB = $63.11
|
Most Recent Note - 1/20/2012 7:17:23 PM
Y - Color code is changed to yellow while consolidating just below the "max buy" level. See the latest FSU analysis for more details and a new annotated weekly graph.
>>> The latest Featured Stock Update with an annotated graph appeared on 1/20/2012. Click here.
View all notes |
Alert me of new notes |
CANSLIM.net Company Profile |
SEC |
Zacks Reports |
StockTalk |
News |
Chart |
Request a new note
C
A N
S L
I M
|
Symbol/Exchange
Company Name
Industry Group |
PRICE |
CHANGE
(%Change) |
Day High |
Volume
(% DAV)
(% 50 day avg vol) |
52 Wk Hi
% From Hi |
Featured
Date |
Price
Featured |
Pivot Featured |
|
Max Buy |
TDG
-
NYSE
Transdigm Group Inc
AEROSPACE/DEFENSE - Aerospace/Defense Products and; Services
|
$100.55
|
-0.56
-0.55% |
$101.84
|
250,255
73.58% of 50 DAV
50 DAV is 340,100
|
$102.73
-2.12%
|
1/10/2012
|
$98.83
|
PP = $102.83
|
|
MB = $107.97
|
Most Recent Note - 1/23/2012 12:25:20 PM
Y - Announced plans to acquire AmSafe Global Holdings Inc for a total purchase price of approximately $750 million in cash. Spiked higher today with above average volume behind its gain while challenging its 52-week high and approaching its pivot point. No overhead supply remains to act as resistance Recent lows in the $92 area define the next important support level to watch if it slumps below its 50 DMA line.
>>> The latest Featured Stock Update with an annotated graph appeared on 1/4/2012. Click here.
View all notes |
Alert me of new notes |
CANSLIM.net Company Profile |
SEC |
Zacks Reports |
StockTalk |
News |
Chart |
Request a new note
C
A N
S L
I M
|
TSCO
-
NASDAQ
Tractor Supply Co
SPECIALTY RETAIL - Specialty Retail, Other
|
$80.70
|
+0.21
0.26% |
$80.83
|
420,006
59.69% of 50 DAV
50 DAV is 703,700
|
$81.98
-1.56%
|
1/12/2012
|
$79.12
|
PP = $75.58
|
|
MB = $79.36
|
Most Recent Note - 1/19/2012 5:42:51 PM
G - After hitting a new all-time high today it reversed into the red for a loss on above average volume, raising concerns. Prior highs in the mid-$70s which were a resistance area now define initial support to watch on pullbacks.
>>> The latest Featured Stock Update with an annotated graph appeared on 1/12/2012. Click here.
View all notes |
Alert me of new notes |
CANSLIM.net Company Profile |
SEC |
Zacks Reports |
StockTalk |
News |
Chart |
Request a new note
C
A N
S L
I M
|
ULTA
-
NASDAQ
Ulta Salon Cosm & Frag
SPECIALTY RETAIL - Specialty Retail, Other
|
$77.38
|
+0.48
0.62% |
$77.45
|
454,339
48.28% of 50 DAV
50 DAV is 941,100
|
$77.83
-0.58%
|
1/11/2012
|
$71.97
|
PP = $75.80
|
|
MB = $79.59
|
Most Recent Note - 1/19/2012 5:43:44 PM
Y - Posted an 8th consecutive gain on near or below average volume and hit another new all-time high today, wedging up from a riskier late-stage base without sufficient volume to trigger a proper technical buy signal. Prior lows near $64 define important chart support above its 200 DMA line.
>>> The latest Featured Stock Update with an annotated graph appeared on 1/11/2012. Click here.
View all notes |
Alert me of new notes |
CANSLIM.net Company Profile |
SEC |
Zacks Reports |
StockTalk |
News |
Chart |
Request a new note
C
A N
S L
I M
|
V
-
NYSE
Visa Inc Cl A
DIVERSIFIED SERVICES - Business/Management Services
|
$101.01
|
+1.41
1.42% |
$101.27
|
3,035,174
79.77% of 50 DAV
50 DAV is 3,804,800
|
$104.20
-3.06%
|
10/24/2011
|
$94.21
|
PP = $94.85
|
|
MB = $99.59
|
Most Recent Note - 1/19/2012 5:46:35 PM
G - Reversed into the red for a loss today with slightly higher (near average) volume than the prior session after touching another new all-time high. No overhead supply remains to act as resistance. Its recent low ($98.33 on 1/11/12) and its 50 DMA line define chart support to watch on pullbacks.
>>> The latest Featured Stock Update with an annotated graph appeared on 1/23/2012. Click here.
View all notes |
Alert me of new notes |
CANSLIM.net Company Profile |
SEC |
Zacks Reports |
StockTalk |
News |
Chart |
Request a new note
C
A N
S L
I M
|
|
|
|
THESE ARE NOT BUY RECOMMENDATIONS!
Comments contained in the body of this report are technical
opinions only. The material herein has been obtained
from sources believed to be reliable and accurate, however,
its accuracy and completeness cannot be guaranteed.
This site is not an investment advisor, hence it does
not endorse or recommend any securities or other investments.
Any recommendation contained in this report may not
be suitable for all investors and it is not to be deemed
an offer or solicitation on our part with respect to
the purchase or sale of any securities. All trademarks,
service marks and trade names appearing in this report
are the property of their respective owners, and are
likewise used for identification purposes only.
This report is a service available
only to active Paid Premium Members.
You may opt-out of receiving report notifications
at any time. Questions or comments may be submitted
by writing to Premium Membership Services 665 S.E. 10 Street, Suite 201 Deerfield Beach, FL 33441-5634 or by calling 1-800-965-8307
or 954-785-1121.
|
|
|

