You are not logged in.
This means you
CAN ONLY VIEW reports that were published prior to Monday, March 31, 2025.
You
MUST UPGRADE YOUR MEMBERSHIP if you want to see any current reports.
AFTER MARKET UPDATE - WEDNESDAY, JANUARY 23RD, 2013
Previous After Market Report Next After Market Report >>>
|
|
|
|
DOW |
+67.12 |
13,779.33 |
+0.49% |
|
Volume |
638,691,090 |
-9% |
|
Volume |
1,658,949,000 |
-4% |
|
NASDAQ |
+10.49 |
3,153.67 |
+0.33% |
|
Advancers |
1,423 |
46% |
|
Advancers |
1,045 |
41% |
|
S&P 500 |
+2.25 |
1,494.81 |
+0.15% |
|
Decliners |
1,553 |
50% |
|
Decliners |
1,420 |
55% |
|
Russell 2000 |
-2.54 |
896.70 |
-0.28% |
|
52 Wk Highs |
355 |
|
|
52 Wk Highs |
167 |
|
|
S&P 600 |
-1.68 |
502.20 |
-0.33% |
|
52 Wk Lows |
6 |
|
|
52 Wk Lows |
5 |
|
|
 |
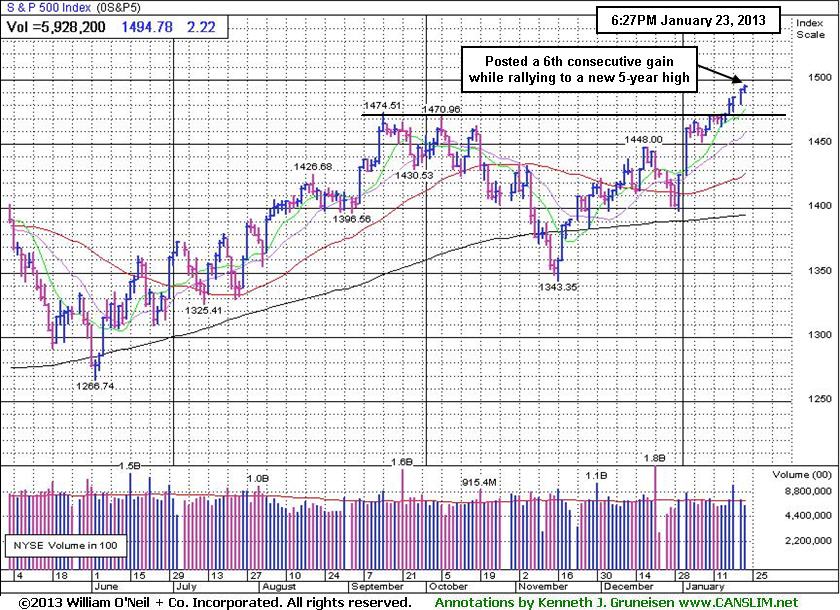
Major Averages Rise Again With Less Volume Conviction
Kenneth J. Gruneisen - Passed the CAN SLIM® Master's Exam
The major averages posted gains on Wednesday's session and the Dow Jones Industrial Average gained 66 points to 13,779, putting it on pace for its best January since 1997. The volume totals were reported lower on the NYSE and on the Nasdaq exchange, down from Tuesday's totals. The small cap indexes lagged, however, and breadth was negative as decliners led advancers by a 7-5 margin on the Nasdaq exchange while decliners narrowly led advancers on the NYSE. The total number of stocks hitting new 52-week highs easily outnumbered new 52-week lows on the NYSE and on the Nasdaq exchange. New 52-week lows totals were in the single digits on both exchanges again. There were 98 high-ranked companies from the CANSLIM.net Leaders List making new 52-week highs and appearing on the CANSLIM.net BreakOuts Page, down from the prior session total of 114 stocks. There were gains for 7 of the 10 high-ranked companies currently included on the Featured Stocks Page. Patience and selectivity are required, however, as the latest rally has produced very few action worthy candidates meeting all of the fact-based investment system's criteria.
Reduced fears surrounding U.S. budget negotiations and encouraging earnings results lifted the market. In Washington, the House approved an extension of the debt ceiling until mid-May and the Senate is expected to pass the measure without any changes.
On the earnings front, better-than-expected technology profit tallies helped the group lead the market's advance. Google Inc (GOOG +5.50%) and International Business Machines Inc (IBM +4.41%) both topped earnings estimates and delivered encouraging 2013 forecasts. Apple Inc (AAPL +1.83%) also gained ground ahead of its scheduled release. SanDisk Corp (SNDK -0.63%) gave up ground ahead of their earnings report.
Materials and utilities were among the worst performing laggards as Exelon Corp (EXC -1.51%) declined, and Praxair Inc (PX -2.85%) also fell after forecasting full year earnings below analyst projections. Consumer discretionary was a notable laggard, led by a decline in Coach Inc (COH -16.36%) after the luxury goods maker reported earnings below consensus estimates and said holiday sales were disappointing.
Over in fixed-income, Treasuries were slightly higher as the 10-year note increased 4/32 to yield 1.83% and the 30-year bond rose 3/32 to yield 3.02%.
Investors may consider new buying efforts in stocks meeting all key criteria, as the market's (M criteria) confirmed uptrend showed a great expansion in leadership (stocks hitting new 52-week highs). Widespread gains helped all of the major averages blast higher, and the benchmark S&P 500 Index is perched at its best level in more than five years.
Watch for an announcement via email concerning the next WEBCAST. The webcast will also be available via an updated link highlighted at the top of the Premium Member Homepage.
PICTURED: The benchmark S&P 500 Index advanced for the sixth-straight session as it rose further above five-year highs.
|
 Kenneth J. Gruneisen started out as a licensed stockbroker in August 1987, a couple of months prior to the historic stock market crash that took the Dow Jones Industrial Average down -22.6% in a single day. He has published daily fact-based fundamental and technical analysis on high-ranked stocks online for two decades. Through FACTBASEDINVESTING.COM, Kenneth provides educational articles, news, market commentary, and other information regarding proven investment systems that work in good times and bad.
Comments contained in the body of this report are technical opinions only and are not necessarily those of Gruneisen Growth Corp. The material herein has been obtained from sources believed to be reliable and accurate, however, its accuracy and completeness cannot be guaranteed. Our firm, employees, and customers may effect transactions, including transactions contrary to any recommendation herein, or have positions in the securities mentioned herein or options with respect thereto. Any recommendation contained in this report may not be suitable for all investors and it is not to be deemed an offer or solicitation on our part with respect to the purchase or sale of any securities. |
|
 |
Gold & Silver Index Slumps Further Below 50 & 200 DMA Lines
Kenneth J. Gruneisen - Passed the CAN SLIM® Master's Exam
The Broker/Dealer Index ($XBD -1.14%) and Bank Index ($BKX -0.33%) ended lower. Energy-related stocks were mixed as the Integrated Oil Index ($XOI -0.24%) edged lower and the Oil Services Index ($OSX +0.30%) edged higher. The Healthcare Index ($HMO +0.42%) posted a modest gain. The Semiconductor Index ($SOX +1.04%) was a standout leader in the tech sector while the Internet Index ($IIX +0.55%) posted a smaller gain, but the Biotechnology Index ($BTK -1.17%) and Networking Index ($NWX -0.44%) both ended in the red.
Charts courtesy www.stockcharts.com
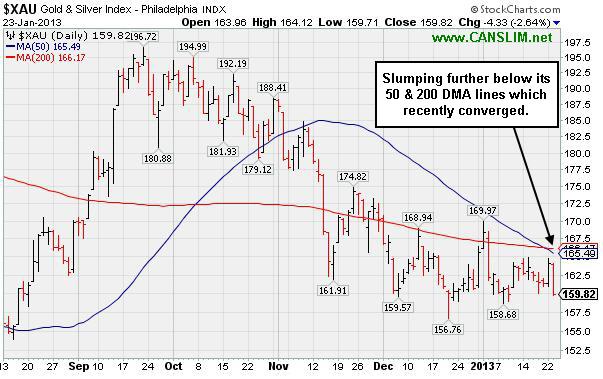
PICTURED: The Gold & Silver Index ($XAU -2.64%) is slumping further below its 50-day and 200-day moving average (DMA) lines which recently converged.
| Oil Services |
$OSX |
242.72 |
+0.72 |
+0.30% |
+10.25% |
| Healthcare |
$HMO |
2,655.72 |
+11.06 |
+0.42% |
+5.63% |
| Integrated Oil |
$XOI |
1,311.00 |
-3.17 |
-0.24% |
+5.57% |
| Semiconductor |
$SOX |
413.88 |
+4.28 |
+1.04% |
+7.76% |
| Networking |
$NWX |
243.89 |
-1.07 |
-0.44% |
+7.65% |
| Internet |
$IIX |
345.38 |
+1.89 |
+0.55% |
+5.62% |
| Broker/Dealer |
$XBD |
100.20 |
-1.15 |
-1.14% |
+6.23% |
| Retail |
$RLX |
686.39 |
+0.73 |
+0.11% |
+5.10% |
| Gold & Silver |
$XAU |
159.82 |
-4.33 |
-2.64% |
-3.49% |
| Bank |
$BKX |
53.73 |
-0.18 |
-0.33% |
+4.78% |
| Biotech |
$BTK |
1,650.75 |
-19.56 |
-1.17% |
+6.70% |
|
|
|
 |
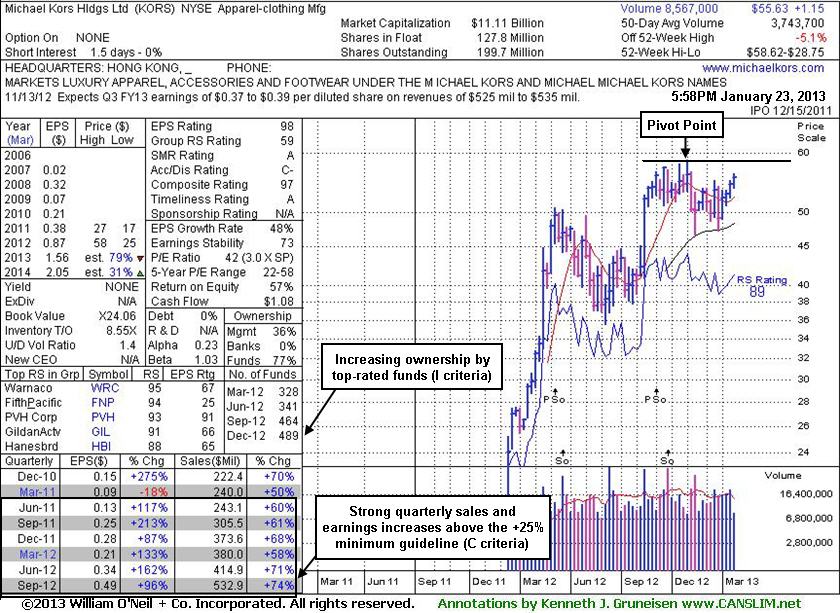
High-Ranked Luxury Apparel Firm Worthy For Watchlist
Kenneth J. Gruneisen - Passed the CAN SLIM® Master's Exam
Often, when a leading stock is setting up to breakout of a solid base it is highlighted in CANSLIM.net's Mid-Day Breakouts Report. Sometimes stocks are highlighted shortly after a technical breakout, yet while the potential buy candidate may still be considered action-worthy. The most relevant factors are noted in the report which alerts prudent CANSLIM oriented investors to place the issue in their watch list. After doing any necessary backup research, the investor is prepared to act after the stock triggers a technical buy signal (breaks above its pivot point on more than +50% average turnover) but before it gets too extended from a sound base. In the event the stock fails to trigger a technical buy signal and its price declines then it will simply be removed from the watch list. Disciplined investors know to buy as near as possible to the pivot point and avoid chasing stocks after they have rallied more than +5% above their pivot point. It is crucial to always limit losses whenever any stock heads the wrong direction, and disciplined investors sell if a struggling stock ever falls more than -7% from their purchase price.
Michael Kors Hldgs Ltd (KORS +$0.68 or +1.24% to $55.63) was highlighted in yellow with pivot point cited based on its 11/02/12 high plus 10 cents in the earlier mid-day report (read here). It is on track for its 4th consecutive weekly gain and perched within -5.1% striking distance of its 52-week high. Disciplined investors may watch for volume-driven gains above the pivot point to trigger a proper technical buy signal before taking action. Currently it is consolidating above its downward sloping 50-day moving average (DMA) line and it recently encountered distributional pressure. This high-ranked Apparel - Clothing Manufacturing firm headquartered in Hong Kong met stubborn resistance in the $57 area and then tested support at its 200 DMA line in the months after pricing another Secondary Offering on 9/25/12. An earlier Secondary Offering was completed on 3/23/12.
Its strong quarterly and annual earnings history (C and A criteria) meet the fundamental guidelines of the fact-based investment system. It has traded up considerably from its 12/15/11 IPO priced at $20. The number of top-rated funds owning its shares rose from 328 n Mar '12 to 429 in Dec '12, a reassuring sign concerning the I criteria. Its current Up/Down Volume Ratio of 1.4 is an unbiased indication that its shares have been under accumulation over the past 50 days. The weekly graph below shows its current base still being built, and it could spend more time base building. There is no advantage gained by jumping in "early" before definitive proof of meaningful new buying demand from the institutional crowd, yet it is an ideal candidate for investors to have on their watchlist until a decisive breakout might warrant action.
 |
|
|
Color Codes Explained :
Y - Better candidates highlighted by our
staff of experts.
G - Previously featured
in past reports as yellow but may no longer be buyable under the
guidelines.
***Last / Change / Volume data in this table is the closing quote data***
Symbol/Exchange
Company Name
Industry Group |
PRICE |
CHANGE
(%Change) |
Day High |
Volume
(% DAV)
(% 50 day avg vol) |
52 Wk Hi
% From Hi |
Featured
Date |
Price
Featured |
Pivot Featured |
|
Max Buy |
CELG
-
NASDAQ
Celgene Corp
DRUGS - Drug Manufacturers - Major
|
$98.22
|
-1.09
-1.10% |
$99.33
|
4,150,051
113.37% of 50 DAV
50 DAV is 3,660,500
|
$100.12
-1.90%
|
12/11/2012
|
$82.24
|
PP = $81.34
|
|
MB = $85.41
|
Most Recent Note - 1/18/2013 4:28:11 PM
G - Hit a new all-time high and finished near the session high today. Very extended from its prior base, but having rallied more than +20% in the first 2-3 weeks after its breakout, the investment system rules suggest holding such winners for a minimum of 8 weeks. See the latest FSU analysis for more details and a new annotated graph.
>>> The latest Featured Stock Update with an annotated graph appeared on 1/17/2013. Click here.
View all notes |
Alert me of new notes |
CANSLIM.net Company Profile |
SEC |
Zacks Reports |
StockTalk |
News |
Chart |
Request a new note
C
A N
S L
I M


|
CFNL
-
NASDAQ
Cardinal Financial Corp
BANKING - Regional - Southeast Banks
|
$16.11
|
-0.13
-0.80% |
$16.21
|
201,359
89.85% of 50 DAV
50 DAV is 224,100
|
$16.90
-4.67%
|
12/3/2012
|
$15.20
|
PP = $16.31
|
|
MB = $17.13
|
Most Recent Note - 1/18/2013 12:06:45 PM
Y - Trading near its 50 DMA line (now $15.79) today following a gap down and loss with above average volume on the prior session. That important short-term average acted as support throughout its ongoing ascent. A damaging violation may trigger a technical sell signal. Reported earnings +54% on +28% sales revenues for the quarter ended December 31, 2012 versus the year ago period, continuing its strong earnings track record satisfying the C criteria.
>>> The latest Featured Stock Update with an annotated graph appeared on 1/15/2013. Click here.
View all notes |
Alert me of new notes |
CANSLIM.net Company Profile |
SEC |
Zacks Reports |
StockTalk |
News |
Chart |
Request a new note
C
A N
S L
I M
|
CMCSA
-
NASDAQ
Comcast Corp Cl A
MEDIA - CATV Systems
|
$40.00
|
+0.19
0.48% |
$40.12
|
9,539,829
85.43% of 50 DAV
50 DAV is 11,166,900
|
$40.28
-0.70%
|
12/3/2012
|
$37.08
|
PP = $38.06
|
|
MB = $39.96
|
Most Recent Note - 1/18/2013 12:08:06 PM
G - Color code was changed to green after rallying to its "max buy" level. Perched at its 52-week high with no resistance remaining due to overhead supply. Prior highs in the $38 area define initial support to watch on pullbacks.
>>> The latest Featured Stock Update with an annotated graph appeared on 1/11/2013. Click here.
View all notes |
Alert me of new notes |
CANSLIM.net Company Profile |
SEC |
Zacks Reports |
StockTalk |
News |
Chart |
Request a new note
C
A N
S L
I M
|
KORS
-
NYSE
Michael Kors Hldgs Ltd
RETAIL - Apparel Stores
|
$55.63
|
+0.68
1.24% |
$56.28
|
5,012,461
133.89% of 50 DAV
50 DAV is 3,743,700
|
$58.62
-5.10%
|
1/23/2013
|
$54.98
|
PP = $58.72
|
|
MB = $61.66
|
 Most Recent Note - 1/23/2013 6:43:47 PM
Y - Color code was changed to yellow with pivot point cited based on its 11/02/12 high plus 10 cents in the mid-day report. Disciplined investors may watch for volume-driven gains above the pivot point to trigger a proper technical buy signal before taking action. Meanwhile, it is currently consolidating above its downward sloping 50 DMA line and recently encountered distributional pressure. This high-ranked Apparel - Clothing Manufacturing firm headquartered in Hong Kong met stubborn resistance in the $57 area and then tested support at its 200 DMA line in the months after pricing another Secondary Offering on 9/25/12. An earlier Secondary Offering was completed on 3/23/12. Its strong quarterly and annual earnings history (C and A criteria) meet the fundamental guidelines of the fact-based investment system. It has traded up considerably from its 12/15/11 IPO priced at $20. See the latest FSU analysis for more details and an annotated weekly graph.
>>> The latest Featured Stock Update with an annotated graph appeared on 1/23/2013. Click here.
View all notes |
Alert me of new notes |
CANSLIM.net Company Profile |
SEC |
Zacks Reports |
StockTalk |
News |
Chart |
Request a new note
C
A N
S L
I M
|
MIDD
-
NASDAQ
Middleby Corp
MANUFACTURING - Diversified Machinery
|
$138.21
|
+3.75
2.79% |
$141.00
|
353,227
438.79% of 50 DAV
50 DAV is 80,500
|
$134.73
2.58%
|
10/8/2012
|
$118.46
|
PP = $122.67
|
|
MB = $128.80
|
Most Recent Note - 1/23/2013 12:19:37 PM
G - Rallying today for a considerable volume-driven gain and new 52-week and all-time highs after an analyst upgrade. Prior reports noted - "Disciplined investors may watch closely for sell signals if holding it and giving it a chance to produce more climactic gains. Its 50-day moving average (DMA) line defines near-term chart support to watch where any violation would trigger a technical sell signal." Earnings +23% on +18% sales for the Sep '12 quarter, below the +25% minimum earnings guideline (C criteria), raised concerns.
>>> The latest Featured Stock Update with an annotated graph appeared on 1/14/2013. Click here.
View all notes |
Alert me of new notes |
CANSLIM.net Company Profile |
SEC |
Zacks Reports |
StockTalk |
News |
Chart |
Request a new note
C
A N
S L
I M
|
Symbol/Exchange
Company Name
Industry Group |
PRICE |
CHANGE
(%Change) |
Day High |
Volume
(% DAV)
(% 50 day avg vol) |
52 Wk Hi
% From Hi |
Featured
Date |
Price
Featured |
Pivot Featured |
|
Max Buy |
N
-
NYSE
Netsuite Inc
DIVERSIFIED SERVICES - Business/Management Services
|
$68.00
|
+1.85
2.80% |
$69.11
|
299,303
84.84% of 50 DAV
50 DAV is 352,800
|
$70.80
-3.95%
|
12/12/2012
|
$64.75
|
PP = $67.12
|
|
MB = $70.48
|
Most Recent Note - 1/23/2013 6:41:50 PM
Y - Gapped up today for a gain with higher (near average) volume. Recent gains above its pivot point were marked by below average volume, still leaving questions concerning the level of institutional buying demand lurking.
>>> The latest Featured Stock Update with an annotated graph appeared on 1/18/2013. Click here.
View all notes |
Alert me of new notes |
CANSLIM.net Company Profile |
SEC |
Zacks Reports |
StockTalk |
News |
Chart |
Request a new note
C
A N
S L
I M
|
NSR
-
NYSE
Neustar Inc
TELECOMMUNICATIONS - Diversified Communication Serv
|
$43.88
|
+0.09
0.21% |
$44.06
|
158,333
38.16% of 50 DAV
50 DAV is 414,900
|
$45.49
-3.54%
|
12/11/2012
|
$41.85
|
PP = $41.41
|
|
MB = $43.48
|
Most Recent Note - 1/17/2013 4:24:25 PM
G - After hitting a new 52-week high today there was a worrisome "negative reversal" for a loss with above average volume. Prior highs and its 50 DMA line coincide near $41 defining chart support to watch on pullbacks. See the latest FSU analysis for more details and a new annotated graph.
>>> The latest Featured Stock Update with an annotated graph appeared on 1/16/2013. Click here.
View all notes |
Alert me of new notes |
CANSLIM.net Company Profile |
SEC |
Zacks Reports |
StockTalk |
News |
Chart |
Request a new note
C
A N
S L
I M
|
RAX
-
NYSE
Rackspace Hosting Inc
INTERNET - Internet Software and; Services
|
$77.13
|
+0.57
0.74% |
$77.46
|
765,498
64.20% of 50 DAV
50 DAV is 1,192,400
|
$78.62
-1.90%
|
12/18/2012
|
$71.88
|
PP = $70.10
|
|
MB = $73.61
|
Most Recent Note - 1/22/2013 5:37:34 PM
G - Pulling back today with higher volume but not heavy volume, retreating from its all-time high. See the latest FSU analysis for more details and a new annotated graph.
>>> The latest Featured Stock Update with an annotated graph appeared on 1/22/2013. Click here.
View all notes |
Alert me of new notes |
CANSLIM.net Company Profile |
SEC |
Zacks Reports |
StockTalk |
News |
Chart |
Request a new note
C
A N
S L
I M
|
RNF
-
NYSE
Rentech Nitrogen Ptnr Lp
CHEMICALS - Agricultural Chemicals
|
$46.34
|
+0.94
2.07% |
$46.73
|
264,572
83.62% of 50 DAV
50 DAV is 316,400
|
$48.19
-3.84%
|
11/1/2012
|
$39.11
|
PP = $40.15
|
|
MB = $42.16
|
Most Recent Note - 1/22/2013 3:27:53 PM
G - Up today for a 3rd consecutive gain with lighter volume. Consolidating well above prior highs in the $40 area defining near-term support to watch.
>>> The latest Featured Stock Update with an annotated graph appeared on 1/9/2013. Click here.
View all notes |
Alert me of new notes |
CANSLIM.net Company Profile |
SEC |
Zacks Reports |
StockTalk |
News |
Chart |
Request a new note
C
A N
S L
I M
|
VRX
-
NYSE
Valeant Pharmaceuticals
DRUGS - Drug Manufacturers - Other
|
$63.84
|
-0.36
-0.56% |
$64.45
|
1,074,313
69.54% of 50 DAV
50 DAV is 1,544,800
|
$64.69
-1.31%
|
12/20/2012
|
$60.24
|
PP = $61.21
|
|
MB = $64.27
|
Most Recent Note - 1/22/2013 4:35:30 PM
G - Managed a gain today for a new high close near its "max buy" level without great volume conviction and its color code is changed to green. Previously repeated guidelines for a proper technical buy signal were not satisfied.
>>> The latest Featured Stock Update with an annotated graph appeared on 1/10/2013. Click here.
View all notes |
Alert me of new notes |
CANSLIM.net Company Profile |
SEC |
Zacks Reports |
StockTalk |
News |
Chart |
Request a new note
C
A N
S L
I M
|
Symbol/Exchange
Company Name
Industry Group |
PRICE |
CHANGE
(%Change) |
Day High |
Volume
(% DAV)
(% 50 day avg vol) |
52 Wk Hi
% From Hi |
Featured
Date |
Price
Featured |
Pivot Featured |
|
Max Buy |
|
|
|
THESE ARE NOT BUY RECOMMENDATIONS!
Comments contained in the body of this report are technical
opinions only. The material herein has been obtained
from sources believed to be reliable and accurate, however,
its accuracy and completeness cannot be guaranteed.
This site is not an investment advisor, hence it does
not endorse or recommend any securities or other investments.
Any recommendation contained in this report may not
be suitable for all investors and it is not to be deemed
an offer or solicitation on our part with respect to
the purchase or sale of any securities. All trademarks,
service marks and trade names appearing in this report
are the property of their respective owners, and are
likewise used for identification purposes only.
This report is a service available
only to active Paid Premium Members.
You may opt-out of receiving report notifications
at any time. Questions or comments may be submitted
by writing to Premium Membership Services 665 S.E. 10 Street, Suite 201 Deerfield Beach, FL 33441-5634 or by calling 1-800-965-8307
or 954-785-1121.
|
|
|

