You are not logged in.
This means you
CAN ONLY VIEW reports that were published prior to Wednesday, March 5, 2025.
You
MUST UPGRADE YOUR MEMBERSHIP if you want to see any current reports.
AFTER MARKET UPDATE - TUESDAY, JANUARY 22ND, 2013
Previous After Market Report Next After Market Report >>>
|
|
|
|
DOW |
+62.51 |
13,712.21 |
+0.46% |
|
Volume |
698,986,380 |
-35% |
|
Volume |
1,728,929,480 |
-6% |
|
NASDAQ |
+8.47 |
3,143.18 |
+0.27% |
|
Advancers |
2,097 |
66% |
|
Advancers |
1,539 |
59% |
|
S&P 500 |
+6.58 |
1,492.56 |
+0.44% |
|
Decliners |
929 |
29% |
|
Decliners |
927 |
36% |
|
Russell 2000 |
+6.44 |
899.24 |
+0.72% |
|
52 Wk Highs |
431 |
|
|
52 Wk Highs |
216 |
|
|
S&P 600 |
+3.82 |
503.88 |
+0.76% |
|
52 Wk Lows |
7 |
|
|
52 Wk Lows |
9 |
|
|
 |
Major Averages Posted Gains With Positive Breadth
Kenneth J. Gruneisen - Passed the CAN SLIM® Master's Exam
The major averages posted gains and Tuesday's session kicked off the shortened trading week on a positive note. The volume totals were reported lower on the NYSE and on the Nasdaq exchange, down from Friday's totals which had been boosted by options expirations. Breadth was positive as advancers led decliners by more than 2-1 on the NYSE and by a 3-2 margin on the Nasdaq exchange. The total number of stocks hitting new 52-week highs easily outnumbered new 52-week lows on the NYSE and on the Nasdaq exchange. New 52-week lows totals were in the single digits on both exchanges again. There were 114 high-ranked companies from the CANSLIM.net Leaders List making new 52-week highs and appearing on the CANSLIM.net BreakOuts Page, up from the prior session total of 83 stocks. There were gains for 4 of the 9 high-ranked companies currently included on the Featured Stocks Page. Patience and selectivity are required, however, as the latest rally has produced very few action worthy candidates meeting all of the fact-based investment system's criteria.
A batch of disappointing economic data weighed on the market. Existing home sales unexpectedly dropped by -1% in December, restrained by the lowest supply of properties in more than a decade. Regional gauges on economic activity were also weak. Business conditions in the mid-Atlantic region fell in January to the worst level since July 2012 and the Chicago Fed's national activity index ticked lower in December. The spotlight now turns to Washington as House leaders prepared to vote on a three-month extension of the nation's borrowing limit.
Overall, sectors were mixed. Health care lagged behind, pressured by Johnson & Johnson's (JNJ -0.74%) loss after delivering a full-year forecast below estimates. Material stocks are helping limit losses as a ramp-up in copper sales helped Freeport-McMoRan Copper & Gold Inc (FCX +4.61%) best street expectations. Among other earnings results, E. I. du Pont de Nemours and Company (DD +1.77%) and The Travelers Companies Inc (TRV +2.15%) advanced after both companies handily exceeded profit expectations. Financials also helped the market advance.
On the downside, consumer staples were the worst performers as The Coca-Cola Co (KO -1.51%) fell. Profit tallies stay in focus after the closing bell with Google Inc (GOOG -0.23%) International Business Machines Inc (IBM +0.83%) and Texas Instruments Corp (TXN -0.18%) all scheduled to report.
In fixed-income, Treasuries eked out minor gains as the 10-year note increased 2/32 to yield 1.83%.
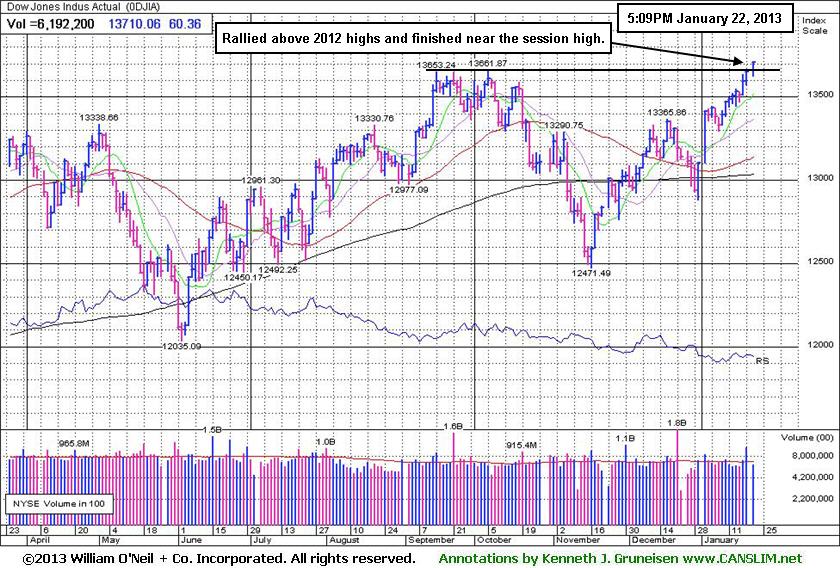
Investors may consider new buying efforts in stocks meeting all key criteria, as the market's (M criteria) confirmed uptrend showed a great expansion in leadership (stocks hitting new 52-week highs). Widespread gains helped all of the major averages blast higher, and the benchmark S&P 500 Index is perched at its best level in more than five years.
Watch for an announcement via email concerning the next WEBCAST. The webcast will also be available via an updated link highlighted at the top of the Premium Member Homepage.
PICTURED: The Dow Jones Industrial Average rallied above its 2012 highs and finished near the session high.
|
 Kenneth J. Gruneisen started out as a licensed stockbroker in August 1987, a couple of months prior to the historic stock market crash that took the Dow Jones Industrial Average down -22.6% in a single day. He has published daily fact-based fundamental and technical analysis on high-ranked stocks online for two decades. Through FACTBASEDINVESTING.COM, Kenneth provides educational articles, news, market commentary, and other information regarding proven investment systems that work in good times and bad.
Comments contained in the body of this report are technical opinions only and are not necessarily those of Gruneisen Growth Corp. The material herein has been obtained from sources believed to be reliable and accurate, however, its accuracy and completeness cannot be guaranteed. Our firm, employees, and customers may effect transactions, including transactions contrary to any recommendation herein, or have positions in the securities mentioned herein or options with respect thereto. Any recommendation contained in this report may not be suitable for all investors and it is not to be deemed an offer or solicitation on our part with respect to the purchase or sale of any securities. |
|
 |
Financial, Defensive, and Energy-Linked Groups Led Gainers
Kenneth J. Gruneisen - Passed the CAN SLIM® Master's Exam
Strength in influential financial shares underpinned the major averages' gains on Tuesday as the Bank Index ($BKX +0.79%) and Broker/Dealer Index ($XBD +1.00%) traded higher. Defensive groups also has a positive bias as the Gold & Silver Index ($XAU +1.74%) and the Healthcare Index ($HMO +2.05%) tallied solid gains. Gains in energy-related shares also boosted the Integrated Oil Index ($XOI +0.77%) and the Oil Services Index ($OSX +0.77%). Meanwhile, the Semiconductor Index ($SOX -0.25%) edged lower and the Internet Index ($IIX +0.15%), Networking Index ($NWX +0.18%), and the Biotechnology Index ($BTK +0.43%) edged higher along with a modest gain for the Retail Index ($RLX +0.17%).
Charts courtesy www.stockcharts.com
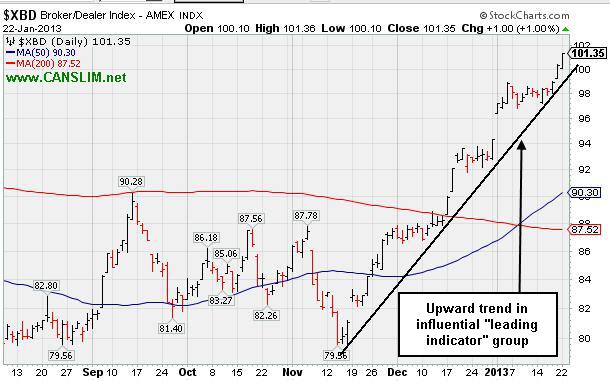
PICTURED: The Broker/Dealer Index ($XBD +1.00%) has a well established upward trend in recent months. The financial group is an important leading indicator, so this strength gives evidence for a favorable outlook for the broader market.
| Oil Services |
$OSX |
242.00 |
+1.86 |
+0.77% |
+9.92% |
| Healthcare |
$HMO |
2,644.66 |
+53.10 |
+2.05% |
+5.19% |
| Integrated Oil |
$XOI |
1,314.16 |
+10.10 |
+0.77% |
+5.82% |
| Semiconductor |
$SOX |
409.60 |
-1.04 |
-0.25% |
+6.65% |
| Networking |
$NWX |
244.96 |
+0.43 |
+0.18% |
+8.13% |
| Internet |
$IIX |
343.49 |
+0.50 |
+0.15% |
+5.04% |
| Broker/Dealer |
$XBD |
101.35 |
+1.00 |
+1.00% |
+7.45% |
| Retail |
$RLX |
685.56 |
+1.16 |
+0.17% |
+4.98% |
| Gold & Silver |
$XAU |
164.15 |
+2.81 |
+1.74% |
-0.88% |
| Bank |
$BKX |
53.90 |
+0.42 |
+0.79% |
+5.11% |
| Biotech |
$BTK |
1,670.31 |
+7.08 |
+0.43% |
+7.97% |
|
|
|
 |
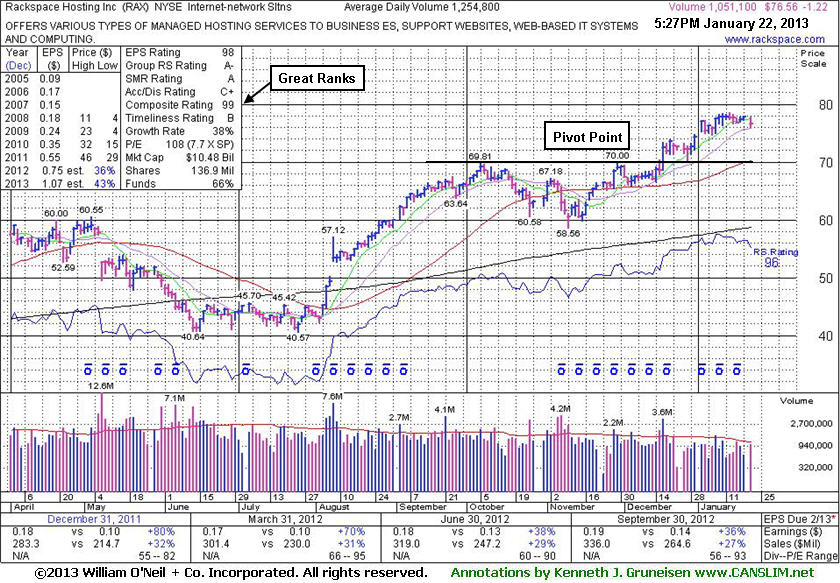
Pulled Back After Getting Extended Following Technical Breakout
Kenneth J. Gruneisen - Passed the CAN SLIM® Master's Exam
Rackspace Hosting Inc (RAX -$1.22 or -1.57% to $76.56) pulled back today with higher volume but not heavy volume, retreating from its all-time high. It is extended from its prior base, and it was previously noted "Prior highs in the $70 area define initial support to watch." It was last shown in this FSU section on 1/08/12 with an annotated graph under the headline, "Unhindered by Overhead Supply, But Extended From Prior Base", as we reminded members - "Disciplined investors avoid chasing extended stocks more than +5% above their pivot point. Making sloppy buy decisions by chasing extended stocks invites a much greater chance that an ordinary consolidation might prompt investors to invoke the investment system's strict loss-limiting sell rule after a pullback of -7% or more from their purchase price."
It reported earnings +36% on +27% sales revenues for the quarter ended September 30, 2012 versus the year ago period and its fundamentals remain strong. The past 11 quarterly earnings comparisons have shown better than +25% increases (C criteria). Its annual earnings history (A criteria) since trading began in 2008 has been good. Increasing institutional ownership (I criteria) is a reassuring sign, as the number of top-rated funds owning its shares rose from 408 in Dec '10 to 653 in Dec '12.
|
|
|
Color Codes Explained :
Y - Better candidates highlighted by our
staff of experts.
G - Previously featured
in past reports as yellow but may no longer be buyable under the
guidelines.
***Last / Change / Volume data in this table is the closing quote data***
Symbol/Exchange
Company Name
Industry Group |
PRICE |
CHANGE
(%Change) |
Day High |
Volume
(% DAV)
(% 50 day avg vol) |
52 Wk Hi
% From Hi |
Featured
Date |
Price
Featured |
Pivot Featured |
|
Max Buy |
CELG
-
NASDAQ
Celgene Corp
DRUGS - Drug Manufacturers - Major
|
$99.31
|
-0.72
-0.72% |
$100.05
|
4,346,244
120.00% of 50 DAV
50 DAV is 3,621,900
|
$100.12
-0.81%
|
12/11/2012
|
$82.24
|
PP = $81.34
|
|
MB = $85.41
|
Most Recent Note - 1/18/2013 4:28:11 PM
G - Hit a new all-time high and finished near the session high today. Very extended from its prior base, but having rallied more than +20% in the first 2-3 weeks after its breakout, the investment system rules suggest holding such winners for a minimum of 8 weeks. See the latest FSU analysis for more details and a new annotated graph.
>>> The latest Featured Stock Update with an annotated graph appeared on 1/17/2013. Click here.
View all notes |
Alert me of new notes |
CANSLIM.net Company Profile |
SEC |
Zacks Reports |
StockTalk |
News |
Chart |
Request a new note
C
A N
S L
I M


|
CFNL
-
NASDAQ
Cardinal Financial Corp
BANKING - Regional - Southeast Banks
|
$16.24
|
+0.28
1.75% |
$16.26
|
219,637
97.18% of 50 DAV
50 DAV is 226,000
|
$16.90
-3.91%
|
12/3/2012
|
$15.20
|
PP = $16.31
|
|
MB = $17.13
|
Most Recent Note - 1/18/2013 12:06:45 PM
Y - Trading near its 50 DMA line (now $15.79) today following a gap down and loss with above average volume on the prior session. That important short-term average acted as support throughout its ongoing ascent. A damaging violation may trigger a technical sell signal. Reported earnings +54% on +28% sales revenues for the quarter ended December 31, 2012 versus the year ago period, continuing its strong earnings track record satisfying the C criteria.
>>> The latest Featured Stock Update with an annotated graph appeared on 1/15/2013. Click here.
View all notes |
Alert me of new notes |
CANSLIM.net Company Profile |
SEC |
Zacks Reports |
StockTalk |
News |
Chart |
Request a new note
C
A N
S L
I M
|
CMCSA
-
NASDAQ
Comcast Corp Cl A
MEDIA - CATV Systems
|
$39.81
|
-0.46
-1.13% |
$40.25
|
13,542,079
120.44% of 50 DAV
50 DAV is 11,243,900
|
$40.28
-1.17%
|
12/3/2012
|
$37.08
|
PP = $38.06
|
|
MB = $39.96
|
Most Recent Note - 1/18/2013 12:08:06 PM
G - Color code was changed to green after rallying to its "max buy" level. Perched at its 52-week high with no resistance remaining due to overhead supply. Prior highs in the $38 area define initial support to watch on pullbacks.
>>> The latest Featured Stock Update with an annotated graph appeared on 1/11/2013. Click here.
View all notes |
Alert me of new notes |
CANSLIM.net Company Profile |
SEC |
Zacks Reports |
StockTalk |
News |
Chart |
Request a new note
C
A N
S L
I M
|
MIDD
-
NASDAQ
Middleby Corp
MANUFACTURING - Diversified Machinery
|
$134.46
|
+2.45
1.86% |
$134.73
|
66,432
80.62% of 50 DAV
50 DAV is 82,400
|
$134.51
-0.04%
|
10/8/2012
|
$118.46
|
PP = $122.67
|
|
MB = $128.80
|
 Most Recent Note - 1/22/2013 3:23:24 PM
G - Hitting new 52-week and all-time highs with today's 3rd consecutive gain. Earnings +23% on +18% sales for the Sep '12 quarter, below the +25% minimum earnings guideline (C criteria), raised concerns.
>>> The latest Featured Stock Update with an annotated graph appeared on 1/14/2013. Click here.
View all notes |
Alert me of new notes |
CANSLIM.net Company Profile |
SEC |
Zacks Reports |
StockTalk |
News |
Chart |
Request a new note
C
A N
S L
I M
|
N
-
NYSE
Netsuite Inc
DIVERSIFIED SERVICES - Business/Management Services
|
$66.15
|
-0.41
-0.62% |
$67.31
|
139,712
39.36% of 50 DAV
50 DAV is 355,000
|
$70.80
-6.57%
|
12/12/2012
|
$64.75
|
PP = $67.12
|
|
MB = $70.48
|
Most Recent Note - 1/18/2013 5:53:18 PM
Y - Gapped down today yet finished near the session high and -6% off its 52-week high. Recent gains above its pivot point were marked by below average volume. See the latest FSU analysis for more details and a new annotated graph,
>>> The latest Featured Stock Update with an annotated graph appeared on 1/18/2013. Click here.
View all notes |
Alert me of new notes |
CANSLIM.net Company Profile |
SEC |
Zacks Reports |
StockTalk |
News |
Chart |
Request a new note
C
A N
S L
I M
|
Symbol/Exchange
Company Name
Industry Group |
PRICE |
CHANGE
(%Change) |
Day High |
Volume
(% DAV)
(% 50 day avg vol) |
52 Wk Hi
% From Hi |
Featured
Date |
Price
Featured |
Pivot Featured |
|
Max Buy |
NSR
-
NYSE
Neustar Inc
TELECOMMUNICATIONS - Diversified Communication Serv
|
$43.79
|
-0.17
-0.39% |
$44.20
|
385,352
92.54% of 50 DAV
50 DAV is 416,400
|
$45.49
-3.74%
|
12/11/2012
|
$41.85
|
PP = $41.41
|
|
MB = $43.48
|
Most Recent Note - 1/17/2013 4:24:25 PM
G - After hitting a new 52-week high today there was a worrisome "negative reversal" for a loss with above average volume. Prior highs and its 50 DMA line coincide near $41 defining chart support to watch on pullbacks. See the latest FSU analysis for more details and a new annotated graph.
>>> The latest Featured Stock Update with an annotated graph appeared on 1/16/2013. Click here.
View all notes |
Alert me of new notes |
CANSLIM.net Company Profile |
SEC |
Zacks Reports |
StockTalk |
News |
Chart |
Request a new note
C
A N
S L
I M
|
RAX
-
NYSE
Rackspace Hosting Inc
INTERNET - Internet Software and; Services
|
$76.56
|
-1.22
-1.57% |
$77.78
|
1,052,168
83.85% of 50 DAV
50 DAV is 1,254,800
|
$78.62
-2.62%
|
12/18/2012
|
$71.88
|
PP = $70.10
|
|
MB = $73.61
|
Most Recent Note - 1/22/2013 5:37:34 PM
G - Pulling back today with higher volume but not heavy volume, retreating from its all-time high. See the latest FSU analysis for more details and a new annotated graph.
>>> The latest Featured Stock Update with an annotated graph appeared on 1/22/2013. Click here.
View all notes |
Alert me of new notes |
CANSLIM.net Company Profile |
SEC |
Zacks Reports |
StockTalk |
News |
Chart |
Request a new note
C
A N
S L
I M
|
RNF
-
NYSE
Rentech Nitrogen Ptnr Lp
CHEMICALS - Agricultural Chemicals
|
$45.40
|
+0.55
1.23% |
$45.50
|
257,003
80.92% of 50 DAV
50 DAV is 317,600
|
$48.19
-5.79%
|
11/1/2012
|
$39.11
|
PP = $40.15
|
|
MB = $42.16
|
Most Recent Note - 1/22/2013 3:27:53 PM
G - Up today for a 3rd consecutive gain with lighter volume. Consolidating well above prior highs in the $40 area defining near-term support to watch.
>>> The latest Featured Stock Update with an annotated graph appeared on 1/9/2013. Click here.
View all notes |
Alert me of new notes |
CANSLIM.net Company Profile |
SEC |
Zacks Reports |
StockTalk |
News |
Chart |
Request a new note
C
A N
S L
I M
|
VRX
-
NYSE
Valeant Pharmaceuticals
DRUGS - Drug Manufacturers - Other
|
$64.20
|
+0.43
0.67% |
$64.41
|
1,368,403
88.18% of 50 DAV
50 DAV is 1,551,900
|
$64.69
-0.76%
|
12/20/2012
|
$60.24
|
PP = $61.21
|
|
MB = $64.27
|
Most Recent Note - 1/22/2013 4:35:30 PM
G - Managed a gain today for a new high close near its "max buy" level without great volume conviction and its color code is changed to green. Previously repeated guidelines for a proper technical buy signal were not satisfied.
>>> The latest Featured Stock Update with an annotated graph appeared on 1/10/2013. Click here.
View all notes |
Alert me of new notes |
CANSLIM.net Company Profile |
SEC |
Zacks Reports |
StockTalk |
News |
Chart |
Request a new note
C
A N
S L
I M
|
|
|
|
THESE ARE NOT BUY RECOMMENDATIONS!
Comments contained in the body of this report are technical
opinions only. The material herein has been obtained
from sources believed to be reliable and accurate, however,
its accuracy and completeness cannot be guaranteed.
This site is not an investment advisor, hence it does
not endorse or recommend any securities or other investments.
Any recommendation contained in this report may not
be suitable for all investors and it is not to be deemed
an offer or solicitation on our part with respect to
the purchase or sale of any securities. All trademarks,
service marks and trade names appearing in this report
are the property of their respective owners, and are
likewise used for identification purposes only.
This report is a service available
only to active Paid Premium Members.
You may opt-out of receiving report notifications
at any time. Questions or comments may be submitted
by writing to Premium Membership Services 665 S.E. 10 Street, Suite 201 Deerfield Beach, FL 33441-5634 or by calling 1-800-965-8307
or 954-785-1121.
|
|
|

