***Last / Change / Volume data in this table is the closing quote data***
Symbol/Exchange
Company Name
Industry Group |
PRICE |
CHANGE
(%Change) |
Day High |
Volume
(% DAV)
(% 50 day avg vol) |
52 Wk Hi
% From Hi |
Featured
Date |
Price
Featured |
Pivot Featured |
|
Max Buy |
ABV
-
NYSE
Comp De Bebidas Adr
FOOD and BEVERAGE - Beverages - Brewers
|
$27.08
|
-0.20
-0.73% |
$27.67
|
6,351,010
225.91% of 50 DAV
50 DAV is 2,811,300
|
$32.00
-15.38%
|
12/10/2010
|
$27.97
|
PP = $29.09
|
|
MB = $30.54
|
 Most Recent Note - 1/21/2011 4:23:17 PM
G - Down today with above average volume for a 7th consecutive loss, closing -15.4% off its 52-week high while slumping near October-December lows in the $27 area. Based on weak technical action it will be dropped from the Featured Stocks list tonight.
>>> The latest Featured Stock Update with an annotated graph appeared on 1/18/2011. Click here.
View all notes |
Alert me of new notes |
CANSLIM.net Company Profile |
SEC |
Zacks Reports |
StockTalk |
News |
Chart |
Request a new note
C
A N
S L
I M


|
ARUN
-
NASDAQ
Aruba Networks Inc
COMPUTER HARDWARE - Networking andamp; Communication Dev
|
$21.84
|
-0.57
-2.54% |
$23.60
|
3,704,589
147.86% of 50 DAV
50 DAV is 2,505,500
|
$26.00
-16.00%
|
1/3/2011
|
$22.55
|
PP = $24.38
|
|
MB = $25.60
|
Most Recent Note - 1/21/2011 4:25:59 PM
G - Reversed an early gain today and closed near the session low for another damaging loss with above average volume. Its 50 DMA line violation triggered a technical sell signal this week after undercutting prior highs in the $23-24 area and negating its recent breakout. Prior lows in the $20.50 area define support above its 200 DMA line.
>>> The latest Featured Stock Update with an annotated graph appeared on 12/14/2010. Click here.
View all notes |
Alert me of new notes |
CANSLIM.net Company Profile |
SEC |
Zacks Reports |
StockTalk |
News |
Chart |
Request a new note
C
A N
S L
I M
|
CIS
-
NYSE
Camelot Info Systems Ads
COMPUTER SOFTWARE andamp; SERVICES - Information Technology Service
|
$25.01
|
+0.14
0.56% |
$25.33
|
168,040
36.09% of 50 DAV
50 DAV is 465,600
|
$28.18
-11.25%
|
11/26/2010
|
$18.93
|
PP = $19.72
|
|
MB = $20.71
|
Most Recent Note - 1/21/2011 4:27:40 PM
G - Endured distributional pressure this week yet showed some resilience near prior highs in the $25 area.
>>> The latest Featured Stock Update with an annotated graph appeared on 1/11/2011. Click here.
View all notes |
Alert me of new notes |
CANSLIM.net Company Profile |
SEC |
Zacks Reports |
StockTalk |
News |
Chart |
Request a new note
C
A N
S L
I M
|
DECK
-
NASDAQ
Deckers Outdoor Corp
CONSUMER NON-DURABLES - Textile - Apparel Footwear
|
$72.90
|
-2.01
-2.68% |
$75.92
|
1,754,977
88.73% of 50 DAV
50 DAV is 1,977,900
|
$87.88
-17.05%
|
10/27/2010
|
$54.16
|
PP = $54.86
|
|
MB = $57.60
|
Most Recent Note - 1/21/2011 4:31:16 PM
G - Down for 4 consecutive losses with near average volume. It violated its 50 DMA line this week amid broad-based weakness in the market (M criteria), raising concerns and triggering a technical sell signal.
>>> The latest Featured Stock Update with an annotated graph appeared on 12/16/2010. Click here.
View all notes |
Alert me of new notes |
CANSLIM.net Company Profile |
SEC |
Zacks Reports |
StockTalk |
News |
Chart |
Request a new note
C
A N
S L
I M
|
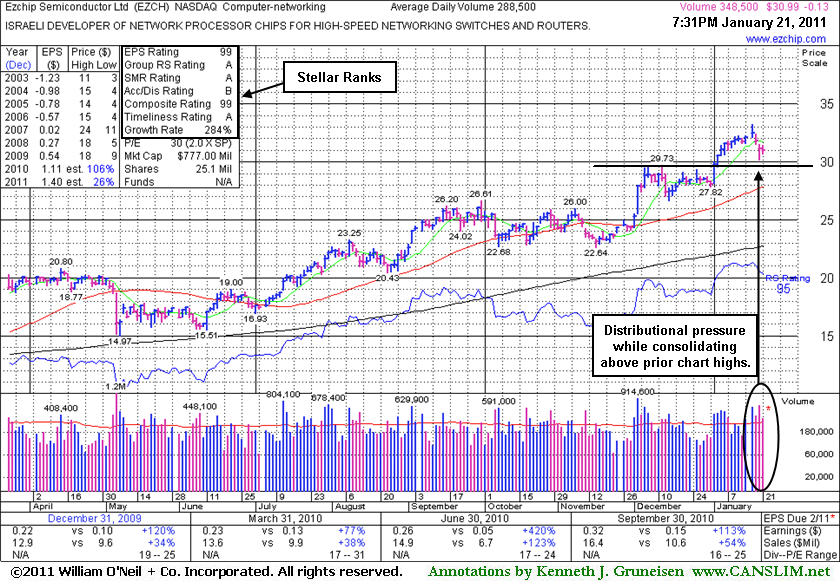
EZCH
-
NASDAQ
Ezchip Semiconductor Ltd
ELECTRONICS - Semiconductor - Specialized
|
$31.01
|
-0.11
-0.35% |
$31.49
|
349,923
125.56% of 50 DAV
50 DAV is 278,700
|
$33.20
-6.60%
|
12/2/2010
|
$27.53
|
PP = $26.00
|
|
MB = $27.30
|
Most Recent Note - 1/21/2011 4:33:32 PM
G - Small loss today following the prior session's gap down loss with more than 2 times average volume. Pulling back from the new 52-week high hit this week, its prior chart highs in the $29 area define initial support to watch well above its 50 DMA line.
>>> The latest Featured Stock Update with an annotated graph appeared on 1/21/2011. Click here.
View all notes |
Alert me of new notes |
CANSLIM.net Company Profile |
SEC |
Zacks Reports |
StockTalk |
News |
Chart |
Request a new note
C
A N
S L
I M
|
Symbol/Exchange
Company Name
Industry Group |
PRICE |
CHANGE
(%Change) |
Day High |
Volume
(% DAV)
(% 50 day avg vol) |
52 Wk Hi
% From Hi |
Featured
Date |
Price
Featured |
Pivot Featured |
|
Max Buy |
EZPW
-
NASDAQ
Ezcorp Inc Cl A
SPECIALTY RETAIL - Specialty Retail, Other
|
$28.01
|
-0.51
-1.79% |
$29.60
|
655,403
174.17% of 50 DAV
50 DAV is 376,300
|
$29.94
-6.45%
|
11/5/2010
|
$24.02
|
PP = $23.85
|
|
MB = $25.04
|
Most Recent Note - 1/21/2011 4:38:09 PM
G - Negative reversal today and wider than normal intra-day price swings are signs of uncertainty and cause for some concern. Recent low and its 50 DMA line near $27 coincide to define an important chart support level to watch.
>>> The latest Featured Stock Update with an annotated graph appeared on 12/29/2010. Click here.
View all notes |
Alert me of new notes |
CANSLIM.net Company Profile |
SEC |
Zacks Reports |
StockTalk |
News |
Chart |
Request a new note
C
A N
S L
I M
|
FFIV
-
NASDAQ
F 5 Networks Inc
INTERNET - Internet Software and Services
|
$109.97
|
+0.82
0.75% |
$113.82
|
9,441,332
375.22% of 50 DAV
50 DAV is 2,516,200
|
$145.76
-24.55%
|
1/13/2011
|
$145.71
|
PP = $143.85
|
|
MB = $151.04
|
Most Recent Note - 1/21/2011 4:40:39 PM
G - Held its ground today following a damaging gap down on 1/20/11 that violated its 50 DMA line and prior chart lows in the $129 area, triggering technical sell signals. Based on weak technical action it will be dropped from the Featured Stocks list tonight. Color code was changed to green after a small but damaging loss with heavier volume on the prior session, as it was noted - "The loss is a sign of more serious distributional pressure while slumping below its pivot point after not breaking out with volume conviction from a late-stage base."
>>> The latest Featured Stock Update with an annotated graph appeared on 1/20/2011. Click here.
View all notes |
Alert me of new notes |
CANSLIM.net Company Profile |
SEC |
Zacks Reports |
StockTalk |
News |
Chart |
Request a new note
C
A N
S L
I M
|
FOSL
-
NASDAQ
Fossil Inc
CONSUMER DURABLES - Recreational Goods, Other
|
$69.24
|
-0.81
-1.16% |
$70.95
|
606,802
75.30% of 50 DAV
50 DAV is 805,800
|
$74.34
-6.86%
|
11/26/2010
|
$69.10
|
PP = $70.17
|
|
MB = $73.68
|
Most Recent Note - 1/21/2011 4:42:16 PM
G - Consolidating just under its 50 DMA line just -6.9% off its 52-week high. Color code was changed to green due to its recent deterioration and general lack of progress since its 12/02/10 breakout from a "3-weeks tight" pattern. Now perched near an upward trendline connecting its July - October lows, and any further deterioration may trigger a more worrisome technical sell signal.
>>> The latest Featured Stock Update with an annotated graph appeared on 1/12/2011. Click here.
View all notes |
Alert me of new notes |
CANSLIM.net Company Profile |
SEC |
Zacks Reports |
StockTalk |
News |
Chart |
Request a new note
C
A N
S L
I M
|
HMSY
-
NASDAQ
H M S Holdings Corp
COMPUTER SOFTWARE and SERVICES - Healthcare Information Service
|
$66.40
|
+0.16
0.24% |
$66.90
|
159,648
103.94% of 50 DAV
50 DAV is 153,600
|
$67.10
-1.04%
|
11/19/2010
|
$61.89
|
PP = $63.01
|
|
MB = $66.16
|
Most Recent Note - 1/21/2011 4:44:26 PM
G - Stubbornly holding its ground after a base-on-base type pattern. It found support at its 50 DMA line, while its waning Relative Strength rank (now 75) has been noted as a concern.
>>> The latest Featured Stock Update with an annotated graph appeared on 1/3/2011. Click here.
View all notes |
Alert me of new notes |
CANSLIM.net Company Profile |
SEC |
Zacks Reports |
StockTalk |
News |
Chart |
Request a new note
C
A N
S L
I M
|
JOBS
-
NASDAQ
Fifty One Job Inc Ads
DIVERSIFIED SERVICES - Staffing and; Outsourcing Service
|
$55.28
|
-0.43
-0.77% |
$56.98
|
104,869
59.62% of 50 DAV
50 DAV is 175,900
|
$61.28
-9.79%
|
10/13/2010
|
$42.07
|
PP = $40.60
|
|
MB = $42.63
|
Most Recent Note - 1/21/2011 4:46:41 PM
G - Consolidating above prior resistance following a negative reversal on 1/19/11 at its all-time high. It had not formed a sound new base, only having recently consolidated for just 4 weeks after a considerable rally from below $20 in July.
>>> The latest Featured Stock Update with an annotated graph appeared on 12/30/2010. Click here.
View all notes |
Alert me of new notes |
CANSLIM.net Company Profile |
SEC |
Zacks Reports |
StockTalk |
News |
Chart |
Request a new note
C
A N
S L
I M
|
Symbol/Exchange
Company Name
Industry Group |
PRICE |
CHANGE
(%Change) |
Day High |
Volume
(% DAV)
(% 50 day avg vol) |
52 Wk Hi
% From Hi |
Featured
Date |
Price
Featured |
Pivot Featured |
|
Max Buy |
LULU
-
NASDAQ
Lululemon Athletica
MANUFACTURING - Textile Manufacturing
|
$66.95
|
-1.00
-1.47% |
$69.24
|
1,325,780
66.61% of 50 DAV
50 DAV is 1,990,500
|
$74.60
-10.25%
|
10/8/2010
|
$47.66
|
PP = $46.67
|
|
MB = $49.00
|
Most Recent Note - 1/21/2011 4:47:58 PM
G - Down today on below average volume for a 4th consecutive loss. It did not form a sound new base, and it is extended from its 50 DMA line.
>>> The latest Featured Stock Update with an annotated graph appeared on 1/14/2011. Click here.
View all notes |
Alert me of new notes |
CANSLIM.net Company Profile |
SEC |
Zacks Reports |
StockTalk |
News |
Chart |
Request a new note
C
A N
S L
I M
|
MWIV
-
NASDAQ
M W I Veterinary Supply
HEALTH SERVICES - Medical Instruments and; Supplies
|
$62.77
|
-0.54
-0.85% |
$64.17
|
71,819
145.38% of 50 DAV
50 DAV is 49,400
|
$67.13
-6.49%
|
11/4/2010
|
$61.79
|
PP = $59.60
|
|
MB = $62.58
|
Most Recent Note - 1/21/2011 4:49:41 PM
G - Enduring mild distribution this week with 3 consecutive small losses with above average volume, consolidating near its 50 DMA line. That short-term average repeatedly has defined support to watch.
>>> The latest Featured Stock Update with an annotated graph appeared on 12/21/2010. Click here.
View all notes |
Alert me of new notes |
CANSLIM.net Company Profile |
SEC |
Zacks Reports |
StockTalk |
News |
Chart |
Request a new note
C
A N
S L
I M
|
NEOG
-
NASDAQ
Neogen Corp
DRUGS - Diagnostic Substances
|
$36.16
|
-0.41
-1.12% |
$37.30
|
282,297
277.03% of 50 DAV
50 DAV is 101,900
|
$43.14
-16.18%
|
9/1/2010
|
$30.79
|
PP = $30.49
|
|
MB = $32.01
|
Most Recent Note - 1/21/2011 4:52:15 PM
G - Damaging losses with above average volume this week triggered a technical sell signal. Based on weak technical action it will be dropped from the Featured Stocks list tonight. It would need to rebound above its 50 DMA line for its outlook to improve.
>>> The latest Featured Stock Update with an annotated graph appeared on 1/19/2011. Click here.
View all notes |
Alert me of new notes |
CANSLIM.net Company Profile |
SEC |
Zacks Reports |
StockTalk |
News |
Chart |
Request a new note
C
A N
S L
I M
|
NFLX
-
NASDAQ
Netflix Inc
SPECIALTY RETAIL - Music and Video Stores
|
$182.09
|
-2.91
-1.57% |
$185.58
|
3,559,999
64.37% of 50 DAV
50 DAV is 5,530,900
|
$206.80
-11.95%
|
1/10/2011
|
$187.88
|
PP = $209.34
|
|
MB = $219.81
|
Most Recent Note - 1/21/2011 5:08:19 PM
G - Quietly slumped to a close just below its 50 DMA line, now -13% off its 52-week high. Color code was changed to green based on its technical weakness shortly after a new pivot point was cited. Gains above its recent high ($194.84) are needed for its outlook to improve.
>>> The latest Featured Stock Update with an annotated graph appeared on 1/10/2011. Click here.
View all notes |
Alert me of new notes |
CANSLIM.net Company Profile |
SEC |
Zacks Reports |
StockTalk |
News |
Chart |
Request a new note
C
A N
S L
I M
|
NTAP
-
NASDAQ
Netapp Inc
COMPUTER HARDWARE - Data Storage Devices
|
$55.77
|
-0.45
-0.80% |
$57.15
|
5,404,181
96.06% of 50 DAV
50 DAV is 5,625,800
|
$59.79
-6.72%
|
1/6/2011
|
$57.49
|
PP = $58.06
|
|
MB = $60.96
|
Most Recent Note - 1/21/2011 5:20:25 PM
G - Down today for a 4th consecutive decline without great volume conviction, finishing -6.7% off its 52-week high. Color code was changed to green while technical deterioration has followed since a new pivot point was cited.
>>> The latest Featured Stock Update with an annotated graph appeared on 12/27/2010. Click here.
View all notes |
Alert me of new notes |
CANSLIM.net Company Profile |
SEC |
Zacks Reports |
StockTalk |
News |
Chart |
Request a new note
C
A N
S L
I M
|
Symbol/Exchange
Company Name
Industry Group |
PRICE |
CHANGE
(%Change) |
Day High |
Volume
(% DAV)
(% 50 day avg vol) |
52 Wk Hi
% From Hi |
Featured
Date |
Price
Featured |
Pivot Featured |
|
Max Buy |
OPEN
-
NASDAQ
Opentable Inc
INTERNET - Internet Software and Services
|
$74.87
|
-1.25
-1.64% |
$78.42
|
971,300
123.78% of 50 DAV
50 DAV is 784,700
|
$82.70
-9.46%
|
1/5/2011
|
$74.05
|
PP = $76.79
|
|
MB = $80.63
|
Most Recent Note - 1/21/2011 5:22:51 PM
Y - Down today for a 4th consecutive loss with slightly above average volume, slumping further below its pivot point, raising concerns. Waning leadership (fewer new highs) and distributional pressure has weighed on the broader market (M criteria). Disciplined investors limit losses by always selling any stock that falls -7% from their purchase price. Prior highs in the $76 area define initial support to watch above its 50 DMA line.
>>> The latest Featured Stock Update with an annotated graph appeared on 1/5/2011. Click here.
View all notes |
Alert me of new notes |
CANSLIM.net Company Profile |
SEC |
Zacks Reports |
StockTalk |
News |
Chart |
Request a new note
C
A N
S L
I M
|
ORCL
-
NASDAQ
Oracle Corp
COMPUTER SOFTWARE and SERVICES - Application Software
|
$32.51
|
+0.21
0.63% |
$32.68
|
34,482,058
121.54% of 50 DAV
50 DAV is 28,371,400
|
$32.35
0.49%
|
1/20/2011
|
$32.31
|
PP = $32.37
|
|
MB = $33.99
|
Most Recent Note - 1/21/2011 5:26:21 PM
Y - Posted a 6th consecutive gain today and closed above its pivot point, but volume was +21% above average, below the minimum guideline for a proper technical buy signal. Rallied against a negative market backdrop for a new 52-week high on the prior session with +68% above average volume, rising from an orderly flat base. Color code was changed to yellow with new pivot point cited base on its 12/17/11 high plus ten cents.
>>> The latest Featured Stock Update with an annotated graph appeared on 1/7/2011. Click here.
View all notes |
Alert me of new notes |
CANSLIM.net Company Profile |
SEC |
Zacks Reports |
StockTalk |
News |
Chart |
Request a new note
C
A N
S L
I M
|
PAY
-
NYSE
Verifone Systems Inc
COMPUTER HARDWARE - Transaction Automation Systems
|
$41.17
|
-0.21
-0.51% |
$42.29
|
1,301,373
82.34% of 50 DAV
50 DAV is 1,580,400
|
$44.87
-8.25%
|
11/29/2010
|
$33.96
|
PP = $36.04
|
|
MB = $37.84
|
Most Recent Note - 1/21/2011 5:27:39 PM
G - Today marked a 4th consecutive loss with near average volume. Now -8.2% off its 52-week high, it is extended from any sound base. Recent lows in the $38 area along with its 50 DMA line define important near-term chart support to watch.
>>> The latest Featured Stock Update with an annotated graph appeared on 12/15/2010. Click here.
View all notes |
Alert me of new notes |
CANSLIM.net Company Profile |
SEC |
Zacks Reports |
StockTalk |
News |
Chart |
Request a new note
C
A N
S L
I M
|
PCLN
-
NASDAQ
Priceline.Com Inc
INTERNET - Internet Software and Services
|
$425.60
|
+1.38
0.33% |
$431.01
|
1,137,088
111.33% of 50 DAV
50 DAV is 1,021,400
|
$443.19
-3.97%
|
11/1/2002
|
$399.55
|
PP = $428.20
|
|
MB = $449.61
|
Most Recent Note - 1/21/2011 5:30:41 PM
Y - Small gain today after enduring mild distributional pressure this week. Testing prior highs in the $426 area previously cited as initial support to watch. Its 50 DMA line ($415.10 now) defines a very important support level to watch.
>>> The latest Featured Stock Update with an annotated graph appeared on 1/2/2011. Click here.
View all notes |
Alert me of new notes |
CANSLIM.net Company Profile |
SEC |
Zacks Reports |
StockTalk |
News |
Chart |
Request a new note
C
A N
S L
I M
|
RAX
-
NYSE
Rackspace Hosting Inc
INTERNET - Internet Software and; Services
|
$31.21
|
+1.43
4.80% |
$31.64
|
2,938,769
174.43% of 50 DAV
50 DAV is 1,684,800
|
$35.00
-10.83%
|
1/10/2011
|
$22.84
|
PP = $32.76
|
|
MB = $34.40
|
Most Recent Note - 1/21/2011 5:32:00 PM
G - Gain today was a sign of prompt support near its 50 DMA line after negating its recent breakout. Its prior session low ($29.52) defines support to watch where subsequent violations would raise more serious concerns.
>>> The latest Featured Stock Update with an annotated graph appeared on 12/31/2010. Click here.
View all notes |
Alert me of new notes |
CANSLIM.net Company Profile |
SEC |
Zacks Reports |
StockTalk |
News |
Chart |
Request a new note
C
A N
S L
I M
|
Symbol/Exchange
Company Name
Industry Group |
PRICE |
CHANGE
(%Change) |
Day High |
Volume
(% DAV)
(% 50 day avg vol) |
52 Wk Hi
% From Hi |
Featured
Date |
Price
Featured |
Pivot Featured |
|
Max Buy |
ROVI
-
NASDAQ
Rovi Corp
COMPUTER SOFTWARE andamp; SERVICES - Security Software andamp; Services
|
$63.53
|
-0.29
-0.45% |
$64.59
|
906,627
59.89% of 50 DAV
50 DAV is 1,513,700
|
$69.50
-8.59%
|
10/29/2010
|
$49.99
|
PP = $53.10
|
|
MB = $55.76
|
Most Recent Note - 1/21/2011 5:33:33 PM
G - Small loss on light volume today after a damaging distributional session with above average volume. The recent low near $58.50 and its 50 DMA line define chart support levels to watch.
>>> The latest Featured Stock Update with an annotated graph appeared on 12/13/2010. Click here.
View all notes |
Alert me of new notes |
CANSLIM.net Company Profile |
SEC |
Zacks Reports |
StockTalk |
News |
Chart |
Request a new note
C
A N
S L
I M
|
SHOO
-
NASDAQ
Steven Madden Limited
CONSUMER NON-DURABLES - Textile - Apparel Footwear
|
$38.79
|
-1.10
-2.76% |
$40.40
|
463,034
128.48% of 50 DAV
50 DAV is 360,400
|
$47.69
-18.66%
|
11/23/2010
|
$44.61
|
PP = $44.95
|
|
MB = $47.20
|
Most Recent Note - 1/21/2011 5:37:00 PM
G - More distributional pressure led to a close today -18.6% off its 52-week high and it slumped below previously cited support at prior highs near $40, raising serious concerns and triggering a technical sell signal. Based on weak action if will be dropped from the Featured Stocks list tonight. Its 200 DMA line may now act as support.
>>> The latest Featured Stock Update with an annotated graph appeared on 1/4/2011. Click here.
View all notes |
Alert me of new notes |
CANSLIM.net Company Profile |
SEC |
Zacks Reports |
StockTalk |
News |
Chart |
Request a new note
C
A N
S L
I M
|
UA
-
NYSE
Under Armour Inc Cl A
CONSUMER NON-DURABLES - Textile - Apparel Clothing
|
$53.25
|
-0.84
-1.55% |
$54.59
|
767,995
120.62% of 50 DAV
50 DAV is 636,700
|
$60.14
-11.46%
|
9/9/2010
|
$39.99
|
PP = $40.10
|
|
MB = $42.11
|
Most Recent Note - 1/21/2011 5:47:42 PM
G - Today's 3rd consecutive loss came with volume picking up to above average as it slumped to its lowest close since November 18th. It violated its 50 DMA line this week, raising concerns. The previously noted recent low ($52.66 on 1 10/11) defines an important chart support level to watch.
>>> The latest Featured Stock Update with an annotated graph appeared on 12/23/2010. Click here.
View all notes |
Alert me of new notes |
CANSLIM.net Company Profile |
SEC |
Zacks Reports |
StockTalk |
News |
Chart |
Request a new note
C
A N
S L
I M
|
ULTA
-
NASDAQ
Ulta Salon Cosm & Frag
SPECIALTY RETAIL - Specialty Retail, Other
|
$35.87
|
-0.25
-0.69% |
$36.83
|
350,391
60.56% of 50 DAV
50 DAV is 578,600
|
$38.25
-6.22%
|
1/6/2011
|
$36.12
|
PP = $37.34
|
|
MB = $39.21
|
Most Recent Note - 1/21/2011 5:50:10 PM
Y - Losses with near average or light volume this week led to a close just pennies below its 12/01/10 high close, raising some concerns. Technically it negated its recent breakout gain with a close back in its prior base. Perched only -6.2% off its 52-week high, subsequent volume-driven gains above its pivot point would be a very reassuring sign.
>>> The latest Featured Stock Update with an annotated graph appeared on 1/6/2011. Click here.
View all notes |
Alert me of new notes |
CANSLIM.net Company Profile |
SEC |
Zacks Reports |
StockTalk |
News |
Chart |
Request a new note
C
A N
S L
I M
|