***Last / Change / Volume data in this table is the closing quote data***
Symbol/Exchange
Company Name
Industry Group |
PRICE |
CHANGE
(%Change) |
Day High |
Volume
(% DAV)
(% 50 day avg vol) |
52 Wk Hi
% From Hi |
Featured
Date |
Price
Featured |
Pivot Featured |
|
Max Buy |
ABV
-
NYSE
Comp De Bebidas Adr
FOOD and BEVERAGE - Beverages - Brewers
|
$27.28
|
-0.44
-1.59% |
$28.01
|
4,428,253
161.82% of 50 DAV
50 DAV is 2,736,500
|
$32.00
-14.75%
|
12/10/2010
|
$27.97
|
PP = $29.09
|
|
MB = $30.54
|
Most Recent Note - 1/19/2011 6:57:30 PM
G - Down slightly again today with above average volume, closing -13.4% off its 52-week high while slumping near October-December lows in the $27 area that may act as support. Waning Relative Strength is a concern. Last week it violated prior highs in the $29 area and its 50 DMA line with a damaging loss on heavy volume triggering technical sell signals.
>>> The latest Featured Stock Update with an annotated graph appeared on 1/18/2011. Click here.
View all notes |
Alert me of new notes |
CANSLIM.net Company Profile |
SEC |
Zacks Reports |
StockTalk |
News |
Chart |
Request a new note
C
A N
S L
I M


|
ARUN
-
NASDAQ
Aruba Networks Inc
COMPUTER HARDWARE - Networking andamp; Communication Dev
|
$22.41
|
-1.90
-7.82% |
$23.63
|
6,286,770
253.56% of 50 DAV
50 DAV is 2,479,400
|
$26.00
-13.81%
|
1/3/2011
|
$22.55
|
PP = $24.38
|
|
MB = $25.60
|
 Most Recent Note - 1/20/2011 11:15:09 AM
G - Trading near its 50 DMA line now, up from earlier lows that nearly tested prior chart lows in the $20.50 area. After a weak finish on the prior session it gapped down today and undercut prior highs in the $23-24 area, negating its recent breakout.
>>> The latest Featured Stock Update with an annotated graph appeared on 12/14/2010. Click here.
View all notes |
Alert me of new notes |
CANSLIM.net Company Profile |
SEC |
Zacks Reports |
StockTalk |
News |
Chart |
Request a new note
C
A N
S L
I M
|
CIS
-
NYSE
Camelot Info Systems Ads
COMPUTER SOFTWARE andamp; SERVICES - Information Technology Service
|
$24.87
|
-0.58
-2.28% |
$25.18
|
564,563
121.52% of 50 DAV
50 DAV is 464,600
|
$28.18
-11.75%
|
11/26/2010
|
$18.93
|
PP = $19.72
|
|
MB = $20.71
|
Most Recent Note - 1/20/2011 11:38:37 AM
G - Up from earlier lows after a gap down today and dip under prior highs in the $25 area.
>>> The latest Featured Stock Update with an annotated graph appeared on 1/11/2011. Click here.
View all notes |
Alert me of new notes |
CANSLIM.net Company Profile |
SEC |
Zacks Reports |
StockTalk |
News |
Chart |
Request a new note
C
A N
S L
I M
|
DECK
-
NASDAQ
Deckers Outdoor Corp
CONSUMER NON-DURABLES - Textile - Apparel Footwear
|
$74.91
|
-2.23
-2.89% |
$76.51
|
2,037,610
102.72% of 50 DAV
50 DAV is 1,983,700
|
$87.88
-14.76%
|
10/27/2010
|
$54.16
|
PP = $54.86
|
|
MB = $57.60
|
Most Recent Note - 1/20/2011 11:41:27 AM
G - Violation of its 50 DMA line amid broad-based weakness in the market (M criteria) today raises concerns. It last traded below that important short-term average in September.
>>> The latest Featured Stock Update with an annotated graph appeared on 12/16/2010. Click here.
View all notes |
Alert me of new notes |
CANSLIM.net Company Profile |
SEC |
Zacks Reports |
StockTalk |
News |
Chart |
Request a new note
C
A N
S L
I M
|
EZCH
-
NASDAQ
Ezchip Semiconductor Ltd
ELECTRONICS - Semiconductor - Specialized
|
$31.12
|
-0.69
-2.17% |
$31.53
|
666,714
240.78% of 50 DAV
50 DAV is 276,900
|
$33.20
-6.27%
|
12/2/2010
|
$27.53
|
PP = $26.00
|
|
MB = $27.30
|
Most Recent Note - 1/20/2011 5:41:40 PM
G - Small gap down today with more than 2 times average volume, pulling back from the new 52-week high hit this week. Prior chart highs in the $29 area define initial support to watch well above its 50 DMA line.
>>> The latest Featured Stock Update with an annotated graph appeared on 12/2/2010. Click here.
View all notes |
Alert me of new notes |
CANSLIM.net Company Profile |
SEC |
Zacks Reports |
StockTalk |
News |
Chart |
Request a new note
C
A N
S L
I M
|
Symbol/Exchange
Company Name
Industry Group |
PRICE |
CHANGE
(%Change) |
Day High |
Volume
(% DAV)
(% 50 day avg vol) |
52 Wk Hi
% From Hi |
Featured
Date |
Price
Featured |
Pivot Featured |
|
Max Buy |
EZPW
-
NASDAQ
Ezcorp Inc Cl A
SPECIALTY RETAIL - Specialty Retail, Other
|
$28.52
|
+0.09
0.32% |
$28.65
|
650,035
167.66% of 50 DAV
50 DAV is 387,700
|
$29.94
-4.74%
|
11/5/2010
|
$24.02
|
PP = $23.85
|
|
MB = $25.04
|
Most Recent Note - 1/20/2011 5:43:14 PM
G - Overcame early weakness for a positive reversal today following 2 consecutive losses with above average volume. Recent low and its 50 DMA line near $27 coincide to define an important chart support level to watch.
>>> The latest Featured Stock Update with an annotated graph appeared on 12/29/2010. Click here.
View all notes |
Alert me of new notes |
CANSLIM.net Company Profile |
SEC |
Zacks Reports |
StockTalk |
News |
Chart |
Request a new note
C
A N
S L
I M
|
FFIV
-
NASDAQ
F 5 Networks Inc
INTERNET - Internet Software and Services
|
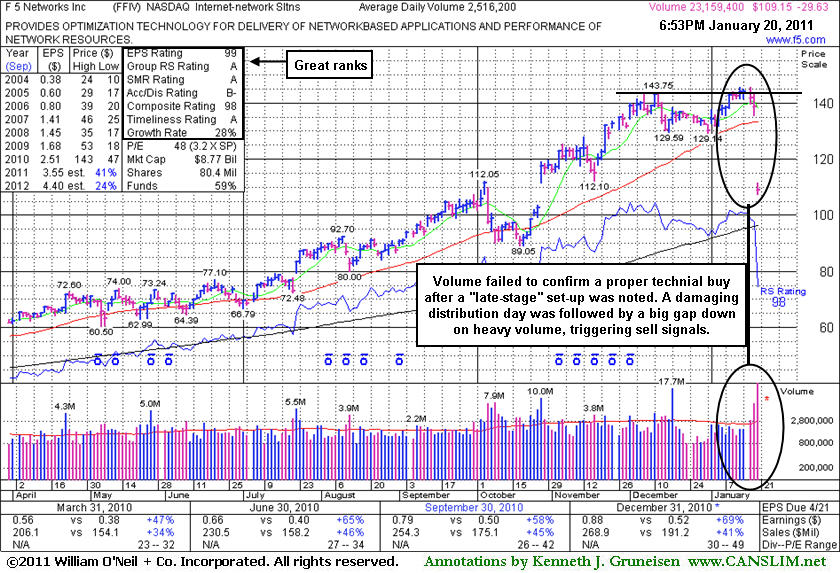
$109.15
|
-29.63
-21.35% |
$114.75
|
23,320,352
967.29% of 50 DAV
50 DAV is 2,410,900
|
$145.76
-25.12%
|
1/13/2011
|
$145.71
|
PP = $143.85
|
|
MB = $151.04
|
Most Recent Note - 1/20/2011 11:05:18 AM
G - Damaging gap down today violated its 50 DMA line and prior chart lows in the $129 area, triggering technical sell signals. Color code was changed to green after a small but damaging loss with heavier volume on the prior session, as it was noted - "The loss is a sign of more serious distributional pressure while slumping below its pivot point after not breaking out with volume conviction from a late-stage base."
>>> The latest Featured Stock Update with an annotated graph appeared on 1/20/2011. Click here.
View all notes |
Alert me of new notes |
CANSLIM.net Company Profile |
SEC |
Zacks Reports |
StockTalk |
News |
Chart |
Request a new note
C
A N
S L
I M
|
FOSL
-
NASDAQ
Fossil Inc
CONSUMER DURABLES - Recreational Goods, Other
|
$70.05
|
+0.84
1.21% |
$70.88
|
622,454
77.66% of 50 DAV
50 DAV is 801,500
|
$74.34
-5.77%
|
11/26/2010
|
$69.10
|
PP = $70.17
|
|
MB = $73.68
|
Most Recent Note - 1/18/2011 4:27:22 PM
G - Consolidating near its 50 DMA line. Color code was changed to green due to its recent deterioration and general lack of progress since its 12/02/10 breakout from a "3-weeks tight" pattern. Now perched near an upward trendline connecting its July - October lows, and any further deterioration may trigger a more worrisome technical sell signal.
>>> The latest Featured Stock Update with an annotated graph appeared on 1/12/2011. Click here.
View all notes |
Alert me of new notes |
CANSLIM.net Company Profile |
SEC |
Zacks Reports |
StockTalk |
News |
Chart |
Request a new note
C
A N
S L
I M
|
HMSY
-
NASDAQ
H M S Holdings Corp
COMPUTER SOFTWARE and SERVICES - Healthcare Information Service
|
$66.24
|
-0.43
-0.64% |
$66.96
|
135,684
86.81% of 50 DAV
50 DAV is 156,300
|
$67.10
-1.28%
|
11/19/2010
|
$61.89
|
PP = $63.01
|
|
MB = $66.16
|
Most Recent Note - 1/18/2011 4:29:55 PM
G - Rallied today with below above average volume for yet another new high close. It built a base-on-base type pattern and found support at its 50 DMA line, while its waning Relative Strength rank (now 68) has been noted as a concern.
>>> The latest Featured Stock Update with an annotated graph appeared on 1/3/2011. Click here.
View all notes |
Alert me of new notes |
CANSLIM.net Company Profile |
SEC |
Zacks Reports |
StockTalk |
News |
Chart |
Request a new note
C
A N
S L
I M
|
JOBS
-
NASDAQ
Fifty One Job Inc Ads
DIVERSIFIED SERVICES - Staffing and; Outsourcing Service
|
$55.71
|
-2.14
-3.70% |
$57.39
|
379,059
219.24% of 50 DAV
50 DAV is 172,900
|
$61.28
-9.09%
|
10/13/2010
|
$42.07
|
PP = $40.60
|
|
MB = $42.63
|
Most Recent Note - 1/20/2011 11:27:02 AM
G - Down considerably today following a negative reversal on the prior session after an early gain for a new all-time high. It had not formed a sound new base, only having recently consolidated for just 4 weeks after a considerable rally from below $20 in July.
>>> The latest Featured Stock Update with an annotated graph appeared on 12/30/2010. Click here.
View all notes |
Alert me of new notes |
CANSLIM.net Company Profile |
SEC |
Zacks Reports |
StockTalk |
News |
Chart |
Request a new note
C
A N
S L
I M
|
Symbol/Exchange
Company Name
Industry Group |
PRICE |
CHANGE
(%Change) |
Day High |
Volume
(% DAV)
(% 50 day avg vol) |
52 Wk Hi
% From Hi |
Featured
Date |
Price
Featured |
Pivot Featured |
|
Max Buy |
LULU
-
NASDAQ
Lululemon Athletica
MANUFACTURING - Textile Manufacturing
|
$67.95
|
-0.36
-0.53% |
$69.85
|
2,016,633
100.39% of 50 DAV
50 DAV is 2,008,700
|
$74.60
-8.91%
|
10/8/2010
|
$47.66
|
PP = $46.67
|
|
MB = $49.00
|
Most Recent Note - 1/19/2011 6:16:04 PM
G - Down today on higher (near average) volume today. It did not form a sound new base, and it is extended from its 50 DMA line.
>>> The latest Featured Stock Update with an annotated graph appeared on 1/14/2011. Click here.
View all notes |
Alert me of new notes |
CANSLIM.net Company Profile |
SEC |
Zacks Reports |
StockTalk |
News |
Chart |
Request a new note
C
A N
S L
I M
|
MWIV
-
NASDAQ
M W I Veterinary Supply
HEALTH SERVICES - Medical Instruments and; Supplies
|
$63.31
|
-0.83
-1.29% |
$64.64
|
67,962
138.13% of 50 DAV
50 DAV is 49,200
|
$67.13
-5.69%
|
11/4/2010
|
$61.79
|
PP = $59.60
|
|
MB = $62.58
|
Most Recent Note - 1/20/2011 1:32:40 PM
G - Enduring mild distribution this week while consolidating above its 50 DMA line. That short-term average repeatedly has defined support to watch.
>>> The latest Featured Stock Update with an annotated graph appeared on 12/21/2010. Click here.
View all notes |
Alert me of new notes |
CANSLIM.net Company Profile |
SEC |
Zacks Reports |
StockTalk |
News |
Chart |
Request a new note
C
A N
S L
I M
|
NEOG
-
NASDAQ
Neogen Corp
DRUGS - Diagnostic Substances
|
$36.57
|
-2.42
-6.21% |
$38.98
|
237,155
235.98% of 50 DAV
50 DAV is 100,500
|
$43.14
-15.23%
|
9/1/2010
|
$30.79
|
PP = $30.49
|
|
MB = $32.01
|
Most Recent Note - 1/20/2011 5:21:34 PM
G - Gapped down today and violated its 50 DMA line with a considerable loss on more than twice average volume, triggering a technical sell signal. It would need to rebound above its 50 DMA line for its outlook to improve, meanwhile the path of least resistance may lead it lower, and time is needed for a new base to form.
>>> The latest Featured Stock Update with an annotated graph appeared on 1/19/2011. Click here.
View all notes |
Alert me of new notes |
CANSLIM.net Company Profile |
SEC |
Zacks Reports |
StockTalk |
News |
Chart |
Request a new note
C
A N
S L
I M
|
NFLX
-
NASDAQ
Netflix Inc
SPECIALTY RETAIL - Music and Video Stores
|
$185.00
|
-5.87
-3.08% |
$188.23
|
5,462,783
98.76% of 50 DAV
50 DAV is 5,531,500
|
$206.80
-10.54%
|
1/10/2011
|
$187.88
|
PP = $209.34
|
|
MB = $219.81
|
Most Recent Note - 1/20/2011 11:20:46 AM
G - Quietly slumping near its 50 DMA line, now -12.4% off its 52-week high. Color code is changed to green based on its technical weakness rather than strength since a new pivot point was recently cited. Gains above its recent high ($194.84) are needed for its outlook to improve.
>>> The latest Featured Stock Update with an annotated graph appeared on 1/10/2011. Click here.
View all notes |
Alert me of new notes |
CANSLIM.net Company Profile |
SEC |
Zacks Reports |
StockTalk |
News |
Chart |
Request a new note
C
A N
S L
I M
|
NTAP
-
NASDAQ
Netapp Inc
COMPUTER HARDWARE - Data Storage Devices
|
$56.22
|
-1.41
-2.45% |
$56.80
|
6,791,441
120.76% of 50 DAV
50 DAV is 5,624,100
|
$59.79
-5.97%
|
1/6/2011
|
$57.49
|
PP = $58.06
|
|
MB = $60.96
|
Most Recent Note - 1/20/2011 11:25:08 AM
G - Pulling back without great volume conviction, it gapped down today and is now -7% off its 52-week high. Color code is changed to green while technical deterioration has followed since a new pivot point was cited.
>>> The latest Featured Stock Update with an annotated graph appeared on 12/27/2010. Click here.
View all notes |
Alert me of new notes |
CANSLIM.net Company Profile |
SEC |
Zacks Reports |
StockTalk |
News |
Chart |
Request a new note
C
A N
S L
I M
|
Symbol/Exchange
Company Name
Industry Group |
PRICE |
CHANGE
(%Change) |
Day High |
Volume
(% DAV)
(% 50 day avg vol) |
52 Wk Hi
% From Hi |
Featured
Date |
Price
Featured |
Pivot Featured |
|
Max Buy |
OPEN
-
NASDAQ
Opentable Inc
INTERNET - Internet Software and Services
|
$76.12
|
-1.70
-2.18% |
$77.18
|
952,717
121.99% of 50 DAV
50 DAV is 781,000
|
$82.70
-7.95%
|
1/5/2011
|
$74.05
|
PP = $76.79
|
|
MB = $80.63
|
Most Recent Note - 1/20/2011 5:52:23 PM
Y - Small gap down today with slightly above average volume led to a close below its pivot point, raising concerns. Meanwhile, waning leadership (fewer new highs) and distributional pressure weighed on the broader market (M criteria). Disciplined investors limit losses by always selling any stock that falls -7% from their purchase price. Prior highs in the $76 area define initial support to watch above its 50 DMA line.
>>> The latest Featured Stock Update with an annotated graph appeared on 1/5/2011. Click here.
View all notes |
Alert me of new notes |
CANSLIM.net Company Profile |
SEC |
Zacks Reports |
StockTalk |
News |
Chart |
Request a new note
C
A N
S L
I M
|
ORCL
-
NASDAQ
Oracle Corp
COMPUTER SOFTWARE and SERVICES - Application Software
|
$32.31
|
+0.71
2.23% |
$32.35
|
47,748,659
168.14% of 50 DAV
50 DAV is 28,398,900
|
$32.27
0.11%
|
1/20/2011
|
$32.31
|
PP = $32.37
|
|
MB = $33.99
|
Most Recent Note - 1/20/2011 5:57:48 PM
Y - Rallied against a negative market backdrop for a new 52-week high today with +68% above average volume. It finished near the session high, rising from an orderly flat base. Color code is changed to yellow with new pivot point cited base on its 12/17/11 high plus ten cents.
>>> The latest Featured Stock Update with an annotated graph appeared on 1/7/2011. Click here.
View all notes |
Alert me of new notes |
CANSLIM.net Company Profile |
SEC |
Zacks Reports |
StockTalk |
News |
Chart |
Request a new note
C
A N
S L
I M
|
PAY
-
NYSE
Verifone Systems Inc
COMPUTER HARDWARE - Transaction Automation Systems
|
$41.38
|
-0.77
-1.83% |
$41.77
|
1,922,265
122.91% of 50 DAV
50 DAV is 1,563,900
|
$44.87
-7.78%
|
11/29/2010
|
$33.96
|
PP = $36.04
|
|
MB = $37.84
|
Most Recent Note - 1/19/2011 7:48:35 PM
G - Third consecutive loss today with near average volume, yet closing only -6.1% off its 52-week high. Extended from any sound base. Recent lows in the $38 area along with its 50 DMA line define important near-term chart support to watch.
>>> The latest Featured Stock Update with an annotated graph appeared on 12/15/2010. Click here.
View all notes |
Alert me of new notes |
CANSLIM.net Company Profile |
SEC |
Zacks Reports |
StockTalk |
News |
Chart |
Request a new note
C
A N
S L
I M
|
PCLN
-
NASDAQ
Priceline.Com Inc
INTERNET - Internet Software and Services
|
$424.22
|
-7.81
-1.81% |
$429.78
|
1,425,719
139.00% of 50 DAV
50 DAV is 1,025,700
|
$443.19
-4.28%
|
11/1/2002
|
$399.55
|
PP = $428.20
|
|
MB = $449.61
|
Most Recent Note - 1/20/2011 1:37:06 PM
Y - Down today, slumping under prior highs in the $426-428 area previously cited as initial support to watch, raising concerns. Its 50 DMA line ($414.97 now) defines a very important support level to watch.
>>> The latest Featured Stock Update with an annotated graph appeared on 1/2/2011. Click here.
View all notes |
Alert me of new notes |
CANSLIM.net Company Profile |
SEC |
Zacks Reports |
StockTalk |
News |
Chart |
Request a new note
C
A N
S L
I M
|
RAX
-
NYSE
Rackspace Hosting Inc
INTERNET - Internet Software and; Services
|
$29.78
|
-3.65
-10.92% |
$31.55
|
5,828,507
344.45% of 50 DAV
50 DAV is 1,692,100
|
$35.00
-14.91%
|
1/10/2011
|
$22.84
|
PP = $32.76
|
|
MB = $34.40
|
Most Recent Note - 1/20/2011 11:08:39 AM
G - Gapped down today and it has violated its 50 DMA line after negating its recent breakout. Raising more concerns while also undercutting prior lows near the $30 level.
>>> The latest Featured Stock Update with an annotated graph appeared on 12/31/2010. Click here.
View all notes |
Alert me of new notes |
CANSLIM.net Company Profile |
SEC |
Zacks Reports |
StockTalk |
News |
Chart |
Request a new note
C
A N
S L
I M
|
Symbol/Exchange
Company Name
Industry Group |
PRICE |
CHANGE
(%Change) |
Day High |
Volume
(% DAV)
(% 50 day avg vol) |
52 Wk Hi
% From Hi |
Featured
Date |
Price
Featured |
Pivot Featured |
|
Max Buy |
ROVI
-
NASDAQ
Rovi Corp
COMPUTER SOFTWARE andamp; SERVICES - Security Software andamp; Services
|
$63.82
|
-2.66
-4.00% |
$66.22
|
2,935,163
197.36% of 50 DAV
50 DAV is 1,487,200
|
$69.50
-8.17%
|
10/29/2010
|
$49.99
|
PP = $53.10
|
|
MB = $55.76
|
Most Recent Note - 1/20/2011 11:10:55 AM
G - Down for a second consecutive session today with above average volume. The recent low near $58.50 and its 50 DMA line define chart support levels to watch.
>>> The latest Featured Stock Update with an annotated graph appeared on 12/13/2010. Click here.
View all notes |
Alert me of new notes |
CANSLIM.net Company Profile |
SEC |
Zacks Reports |
StockTalk |
News |
Chart |
Request a new note
C
A N
S L
I M
|
SHOO
-
NASDAQ
Steven Madden Limited
CONSUMER NON-DURABLES - Textile - Apparel Footwear
|
$39.89
|
-0.56
-1.38% |
$40.67
|
396,115
111.11% of 50 DAV
50 DAV is 356,500
|
$47.69
-16.36%
|
11/23/2010
|
$44.61
|
PP = $44.95
|
|
MB = $47.20
|
Most Recent Note - 1/19/2011 7:50:48 PM
G - Distributional pressure led to a close today -15.2% off its 52-week high. It remains perched above previously cited support at prior highs near $40. Meanwhile, more damaging losses would raise serious concerns. Its downward sloping 50 DMA line may now act as resistance.
>>> The latest Featured Stock Update with an annotated graph appeared on 1/4/2011. Click here.
View all notes |
Alert me of new notes |
CANSLIM.net Company Profile |
SEC |
Zacks Reports |
StockTalk |
News |
Chart |
Request a new note
C
A N
S L
I M
|
UA
-
NYSE
Under Armour Inc Cl A
CONSUMER NON-DURABLES - Textile - Apparel Clothing
|
$54.09
|
-1.12
-2.03% |
$55.61
|
580,800
90.00% of 50 DAV
50 DAV is 645,300
|
$60.14
-10.06%
|
9/9/2010
|
$39.99
|
PP = $40.10
|
|
MB = $42.11
|
Most Recent Note - 1/20/2011 5:46:28 PM
G - Gapped down today, and losses this week with below average volume led to a violation of support at its 50 DMA line. The recent low ($52.66 on 1 10/11) defines an important chart support level to watch now.
>>> The latest Featured Stock Update with an annotated graph appeared on 12/23/2010. Click here.
View all notes |
Alert me of new notes |
CANSLIM.net Company Profile |
SEC |
Zacks Reports |
StockTalk |
News |
Chart |
Request a new note
C
A N
S L
I M
|
ULTA
-
NASDAQ
Ulta Salon Cosm & Frag
SPECIALTY RETAIL - Specialty Retail, Other
|
$36.12
|
+0.40
1.12% |
$36.94
|
535,256
93.84% of 50 DAV
50 DAV is 570,400
|
$38.25
-5.57%
|
1/6/2011
|
$36.12
|
PP = $37.34
|
|
MB = $39.21
|
Most Recent Note - 1/18/2011 5:20:05 PM
Y - Loss today with near average volume led to a close just pennies below its 12/01/10 high close, raising some concern while technically negating its recent breakout gain with a close back in its prior base. Subsequent volume-driven gains above its pivot point would be a very reassuring sign.
>>> The latest Featured Stock Update with an annotated graph appeared on 1/6/2011. Click here.
View all notes |
Alert me of new notes |
CANSLIM.net Company Profile |
SEC |
Zacks Reports |
StockTalk |
News |
Chart |
Request a new note
C
A N
S L
I M
|