You are not logged in.
This means you
CAN ONLY VIEW reports that were published prior to Monday, April 14, 2025.
You
MUST UPGRADE YOUR MEMBERSHIP if you want to see any current reports.
AFTER MARKET UPDATE - FRIDAY, JANUARY 20TH, 2012
Previous After Market Report Next After Market Report >>>
|
|
|
|
DOW |
+96.50 |
12,720.48 |
+0.76% |
|
Volume |
927,243,800 |
+15% |
|
Volume |
1,889,419,460 |
-3% |
|
NASDAQ |
-1.63 |
2,786.70 |
-0.06% |
|
Advancers |
1,721 |
55% |
|
Advancers |
1,512 |
58% |
|
S&P 500 |
+0.88 |
1,315.38 |
+0.07% |
|
Decliners |
1,252 |
40% |
|
Decliners |
997 |
38% |
|
Russell 2000 |
+2.25 |
784.62 |
+0.29% |
|
52 Wk Highs |
126 |
|
|
52 Wk Highs |
56 |
|
|
S&P 600 |
+1.32 |
438.68 |
+0.30% |
|
52 Wk Lows |
14 |
|
|
52 Wk Lows |
12 |
|
|
 |
Major Averages Cap Third Winning Week of New Year
Kenneth J. Gruneisen - Passed the CAN SLIM® Master's Exam
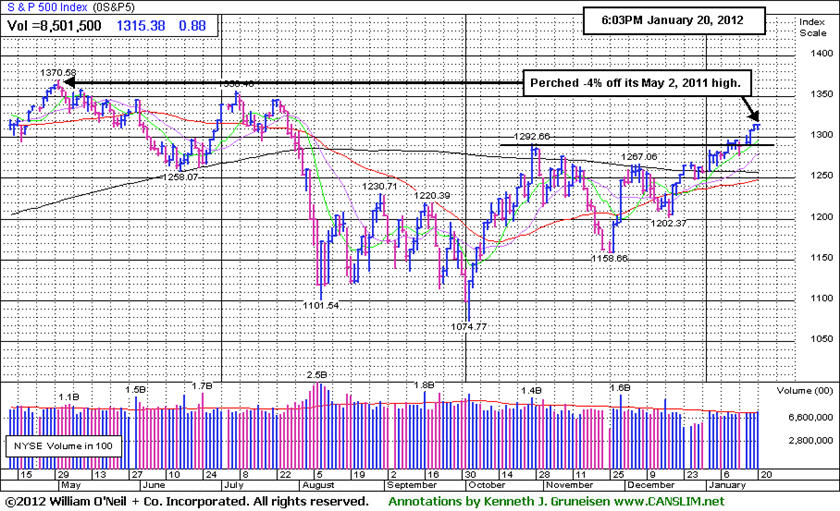
For the week, the Dow Jones Industrial Average gained +2.4%, the S&P Index rose +2.0%, and the Nasdaq Composite Index added +2.8%. On Friday the major averages were mixed and the volume totals were mixed yet again, reported higher than the prior session on the NYSE and lower on the Nasdaq exchange. Breadth on the session was positive as advancers led decliners about 3-2 on the Nasdaq exchange and on the NYSE. New 52-week highs totals contracted from the prior session yet easily outnumbered new 52-week lows on both the NYSE and the Nasdaq exchange. There were 49 high-ranked companies from the CANSLIM.net Leaders List that made new 52-week highs and appeared on the CANSLIM.net BreakOuts Page, down from the prior session total of 69 stocks. There were gains for only 4 of the 19 high-ranked companies currently included on the Featured Stocks Page, contrasting greatly with the positive breadth in the market overall.
Economic data was limited on Friday, but provided some support. December sales of previously owned homes rose, a third straight monthly increase, to their highest level since January 2011, increasing +5% last month and +1.7% in all of last year. Disappointing fourth-quarter earnings releases put a slight damper on investor sentiment. However, technology shares rose amid higher-than-estimated earnings results from International Business Machines (IBM +4.43%) and Microsoft Corp (MSFT +5.65%) which kept the Dow Jones Industrial Average in green territory while the other major indices lagged behind. In other action, Sears Holdings Corp (SHLD +13.03%) saw upside again, rallying for the largest gain in the S&P 500, following a report that CIT Group will approve financing for the company's vendors. After jumping +9.8% yesterday, it has tallied its biggest two-day gain in more than three years.
In bondland, Treasuries are off to their worst start since 2003 and the 10-year note fell for a third day down 14/32 to yield 2.03%. Investors are still keeping a watchful eye on Europe. Greek officials met with private creditors for a third day in attempts to strike a bond swap deal to help avoid a default. Details include the extent of a haircut on some of its bonds as part of an aid agreement with the European Union and the International Monetary Fund.
The recent expansion in leadership (stocks making new 52-week highs) has been noted as a reassuring sign concerning the current confirmed market uptrend and the M criteria, as a healthy crop of strong leaders is necessary for any sustained market advance. Technical improvement from financial shares and key growth areas including the tech sector has been another encouraging sign helping the market outlook.
The Q4 2011 CANSLIM.net Webcast is still available "ON DEMAND" to all upgraded members at no additional cost. Via the Premium Member Homepage links to all prior reports and webcasts are always available.
PICTURED: The S&P 500 Index is perched -4% off its May 2, 2011 after it and the major averages capped off 3 winning weeks to start the year. In January thus far the benchmark index has rallied +4.6% and posted gains in 11 of 13 sessions.
|
 Kenneth J. Gruneisen started out as a licensed stockbroker in August 1987, a couple of months prior to the historic stock market crash that took the Dow Jones Industrial Average down -22.6% in a single day. He has published daily fact-based fundamental and technical analysis on high-ranked stocks online for two decades. Through FACTBASEDINVESTING.COM, Kenneth provides educational articles, news, market commentary, and other information regarding proven investment systems that work in good times and bad.
Comments contained in the body of this report are technical opinions only and are not necessarily those of Gruneisen Growth Corp. The material herein has been obtained from sources believed to be reliable and accurate, however, its accuracy and completeness cannot be guaranteed. Our firm, employees, and customers may effect transactions, including transactions contrary to any recommendation herein, or have positions in the securities mentioned herein or options with respect thereto. Any recommendation contained in this report may not be suitable for all investors and it is not to be deemed an offer or solicitation on our part with respect to the purchase or sale of any securities. |
|
 |
Financial Groups' Gains Stand Out Again
Kenneth J. Gruneisen - Passed the CAN SLIM® Master's Exam
Financial shares were a source of market leadership on Friday as the Bank Index ($BKX +0.72%) and Broker/Dealer Index ($XBD +1.36%) tallied more gains. The Semiconductor Index ($SOX +0.54%) rose while the Biotechnology Index ($BTK -1.26%), Internet Index ($IIX -0.77%), and Networking Index ($NWX -0.24%) lost ground. Weakness in the Retail Index ($RLX -1.56%) and Healthcare Index ($HMO -0.76%) also created a drag on the major averages. Commodity-linked groups edged lower as the Oil Services Index ($OSX -0.68%), Integrated Oil Index ($XOI -0.12%), and Gold & Silver Index ($XAU -0.54%) finished the session lower.
Charts courtesy www.stockcharts.com
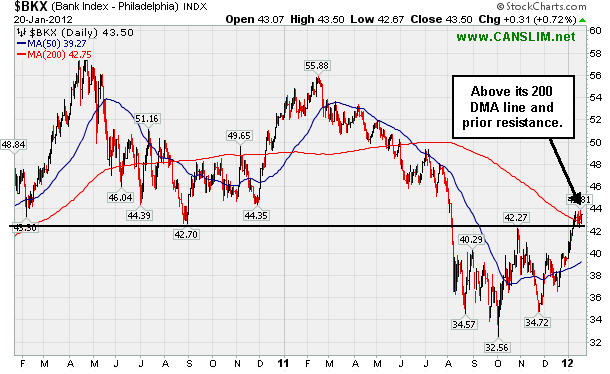
PICTURED: The Bank Index ($BKX +0.72%) recently rallied above its 200-day moving average (DMA) line and above prior chart resistance. The financial group has an important role as a "leading indicator" and the improved technical stance for financial stocks bodes well for the broader market outlook.
| Oil Services |
$OSX |
233.92 |
-1.59 |
-0.68% |
+8.16% |
| Healthcare |
$HMO |
2,512.32 |
-19.25 |
-0.76% |
+10.11% |
| Integrated Oil |
$XOI |
1,273.79 |
-1.59 |
-0.12% |
+3.64% |
| Semiconductor |
$SOX |
414.34 |
+2.23 |
+0.54% |
+13.69% |
| Networking |
$NWX |
244.61 |
-0.59 |
-0.24% |
+13.69% |
| Internet |
$IIX |
299.77 |
-2.33 |
-0.77% |
+6.40% |
| Broker/Dealer |
$XBD |
95.20 |
+1.28 |
+1.36% |
+14.33% |
| Retail |
$RLX |
551.44 |
-8.72 |
-1.56% |
+5.40% |
| Gold & Silver |
$XAU |
187.02 |
-1.02 |
-0.54% |
+3.53% |
| Bank |
$BKX |
43.50 |
+0.31 |
+0.72% |
+10.46% |
| Biotech |
$BTK |
1,242.41 |
-15.86 |
-1.26% |
+13.83% |
|
|
|
 |
Four Winning Weeks While Approaching 52-Week High
Kenneth J. Gruneisen - Passed the CAN SLIM® Master's Exam
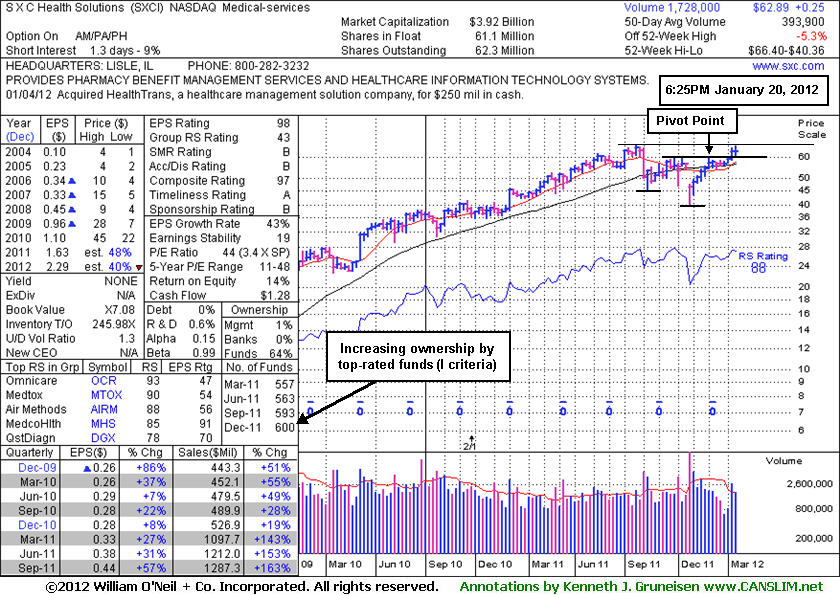
SXC Health Solutions Corp. (SXCI +$0.04 +0.06% to $62.89) provides pharmacy benefit management (PBM) services and healthcare information technology solutions to the healthcare benefits management industry in North America. It was first featured on 1/10/12 when highlighted in yellow in the mid-day report with an annotated daily graph (read here).
The weekly graph below shows that it has tallied 4 consecutive weekly gains. As prior notes suggested, it has encountered some resistance due to "overhead supply". It was getting extended from its previously noted breakout from a sound base pattern, especially as it challenged its 52-week high after gapping up on Thursday (best seen on a daily graph), but it closed near that session's low after a negative reversal. Volume was even lighter on Friday as it held its ground. Now it is consolidating just below the "max buy" level cited, which is +5% above the pivot point.
SXCI already technically broke out on 1/10/12 with twice its average volume behind the breakout gain. Some may consider the 52-week high a "pivot point" and may later argue that new (or add-on) buying efforts are worth considering if additional bullish action transpires. A view of the weekly graph below, however, would sooner be considered a 27-week consolidation, which is a big "double base" pattern with a lower, more conservative pivot point. Regardless of where any stock is bought, disciplined investors always limit losses if a stock ever falls more than -7% from their purchase price per the investment system's "Rule #1". If things ever go wrong, that is always the best insurance against greater losses.
One reassurance that things will not go wrong is when ownership by top-rated funds has been increasing, in this case rising from 453 in Jun '10 to 600 in Dec '11. Concerning the I criteria, that is a very favorable sign. Strong prior quarters and good annual earnings history satisfy the C and A criteria.
|
|
|
Color Codes Explained :
Y - Better candidates highlighted by our
staff of experts.
G - Previously featured
in past reports as yellow but may no longer be buyable under the
guidelines.
***Last / Change / Volume data in this table is the closing quote data***
Symbol/Exchange
Company Name
Industry Group |
PRICE |
CHANGE
(%Change) |
Day High |
Volume
(% DAV)
(% 50 day avg vol) |
52 Wk Hi
% From Hi |
Featured
Date |
Price
Featured |
Pivot Featured |
|
Max Buy |
ADS
-
NYSE
Alliance Data Sys Corp
COMPUTER SOFTWARE and SERVICES - Information and Delivery Service
|
$108.49
|
-1.36
-1.24% |
$109.69
|
446,713
65.08% of 50 DAV
50 DAV is 686,400
|
$110.16
-1.52%
|
1/17/2012
|
$108.24
|
PP = $107.43
|
|
MB = $112.80
|
 Most Recent Note - 1/20/2012 3:57:58 PM
Y - Perched at its all-time high with volume totals cooling since its 1/17/12 gain backed by +40% above average volume, near the bare minimum volume required to trigger a proper technical buy signal. Its 50 DMA line and the 1/04/12 session low ($100.42) define near-term support where violations would raise greater concerns and trigger technical sell signals.
>>> The latest Featured Stock Update with an annotated graph appeared on 1/17/2012. Click here.
View all notes |
Alert me of new notes |
CANSLIM.net Company Profile |
SEC |
Zacks Reports |
StockTalk |
News |
Chart |
Request a new note
C
A N
S L
I M


|
ALXN
-
NASDAQ
Alexion Pharmaceuticals
DRUGS - Drug Manufacturers - Other
|
$73.58
|
-2.11
-2.79% |
$75.65
|
1,682,658
142.28% of 50 DAV
50 DAV is 1,182,600
|
$77.58
-5.16%
|
11/30/2011
|
$68.66
|
PP = $70.52
|
|
MB = $74.05
|
Most Recent Note - 1/20/2012 2:40:04 PM
Y - Pulling back below its "max buy" level with today's 3rd consecutive loss and its color code is changed to yellow. Prior resistance in the $70 area defines initial chart support above its 50 DMA line.
>>> The latest Featured Stock Update with an annotated graph appeared on 1/13/2012. Click here.
View all notes |
Alert me of new notes |
CANSLIM.net Company Profile |
SEC |
Zacks Reports |
StockTalk |
News |
Chart |
Request a new note
C
A N
S L
I M
|
CATM
-
NASDAQ
Cardtronics Inc
DIVERSIFIED SERVICES - Business/Management Services
|
$27.02
|
-0.27
-0.99% |
$27.89
|
262,369
73.06% of 50 DAV
50 DAV is 359,100
|
$28.74
-5.98%
|
12/23/2011
|
$28.64
|
PP = $28.56
|
|
MB = $29.99
|
Most Recent Note - 1/19/2012 11:46:41 AM
Y - Considerable gain today with above average volume following a new analyst buy rating. Rallying above its 50 DMA line, helping its technical stance improve with a 3rd consecutive gain. Color code was changed to yellow while approaching its previously cited pivot point and trading within close striking distance of its 52-week high.
>>> The latest Featured Stock Update with an annotated graph appeared on 12/23/2011. Click here.
View all notes |
Alert me of new notes |
CANSLIM.net Company Profile |
SEC |
Zacks Reports |
StockTalk |
News |
Chart |
Request a new note
C
A N
S L
I M
|
CELG
-
NASDAQ
Celgene Corp
DRUGS - Drug Manufacturers - Major
|
$73.84
|
+1.63
2.26% |
$74.75
|
4,991,111
145.05% of 50 DAV
50 DAV is 3,441,000
|
$75.11
-1.69%
|
12/20/2011
|
$66.68
|
PP = $68.35
|
|
MB = $71.77
|
Most Recent Note - 1/20/2012 12:04:47 PM
G - Today's gain has it challenging its 52-week high hit on Tuesday and trading within close striking distance of its all-time high ($77.39 in Aug '08). Prior highs in the $68 area define support to watch on pullbacks.
>>> The latest Featured Stock Update with an annotated graph appeared on 12/29/2011. Click here.
View all notes |
Alert me of new notes |
CANSLIM.net Company Profile |
SEC |
Zacks Reports |
StockTalk |
News |
Chart |
Request a new note
C
A N
S L
I M
|
FEIC
-
NASDAQ
F E I Co
ELECTRONICS - Diversified Electronics
|
$44.56
|
-0.32
-0.71% |
$44.99
|
228,165
81.66% of 50 DAV
50 DAV is 279,400
|
$44.99
-0.96%
|
12/7/2011
|
$41.41
|
PP = $42.35
|
|
MB = $44.47
|
Most Recent Note - 1/18/2012 6:38:02 PM
G - Gain today backed by +43% above average volume lifted it above its "max buy" level and its color code is changed to green while getting extended from its prior base. No overhead supply remains to hinder its upward progress. The 50 DMA line defines chart support above prior lows.
>>> The latest Featured Stock Update with an annotated graph appeared on 12/21/2011. Click here.
View all notes |
Alert me of new notes |
CANSLIM.net Company Profile |
SEC |
Zacks Reports |
StockTalk |
News |
Chart |
Request a new note
C
A N
S L
I M
|
Symbol/Exchange
Company Name
Industry Group |
PRICE |
CHANGE
(%Change) |
Day High |
Volume
(% DAV)
(% 50 day avg vol) |
52 Wk Hi
% From Hi |
Featured
Date |
Price
Featured |
Pivot Featured |
|
Max Buy |
GNC
-
NYSE
G N C Holdings Inc
RETAIL - Drug Stores
|
$28.79
|
-0.20
-0.69% |
$29.16
|
329,295
31.94% of 50 DAV
50 DAV is 1,030,900
|
$29.50
-2.41%
|
1/19/2012
|
$28.99
|
PP = $29.60
|
|
MB = $31.08
|
Most Recent Note - 1/19/2012 5:22:28 PM
Y - Color code is changed to yellow with new pivot point cited based on its 52-week high plus 10 cents. See the latest FSU analysis for more details and a new annotated graph.
>>> The latest Featured Stock Update with an annotated graph appeared on 1/19/2012. Click here.
View all notes |
Alert me of new notes |
CANSLIM.net Company Profile |
SEC |
Zacks Reports |
StockTalk |
News |
Chart |
Request a new note
C
A N
S L
I M
|
HMSY
-
NASDAQ
H M S Holdings Corp
COMPUTER SOFTWARE and SERVICES - Healthcare Information Service
|
$33.75
|
-0.35
-1.03% |
$34.39
|
472,596
48.20% of 50 DAV
50 DAV is 980,400
|
$34.73
-2.82%
|
10/27/2011
|
$26.44
|
PP = $28.37
|
|
MB = $29.79
|
Most Recent Note - 1/17/2012 4:29:18 PM
G - Hit a new all-time high with today's gain backed by higher but still below average volume. No resistance remains to hinder its progress, but it is extended from its prior base.
>>> The latest Featured Stock Update with an annotated graph appeared on 12/28/2011. Click here.
View all notes |
Alert me of new notes |
CANSLIM.net Company Profile |
SEC |
Zacks Reports |
StockTalk |
News |
Chart |
Request a new note
C
A N
S L
I M
|
ISRG
-
NASDAQ
Intuitive Surgical Inc
HEALTH SERVICES - Medical Appliances and Equipment
|
$445.68
|
-28.97
-6.10% |
$449.78
|
1,613,615
523.05% of 50 DAV
50 DAV is 308,500
|
$476.49
-6.47%
|
12/20/2011
|
$442.43
|
PP = $449.16
|
|
MB = $471.62
|
Most Recent Note - 1/20/2012 7:25:47 PM
Y - Gapped down today, yet showed resilience and closed in the upper part of its intra-day range after briefly undercutting below prior lows and its 50 DMA line. Reported earnings +24% on +28% sales revenues for the quarter ended December 31, 2011 versus the year ago period.
>>> The latest Featured Stock Update with an annotated graph appeared on 1/18/2012. Click here.
View all notes |
Alert me of new notes |
CANSLIM.net Company Profile |
SEC |
Zacks Reports |
StockTalk |
News |
Chart |
Request a new note
C
A N
S L
I M
|
LULU
-
NASDAQ
Lululemon Athletica
MANUFACTURING - Textile Manufacturing
|
$60.12
|
-0.02
-0.03% |
$60.35
|
2,580,889
65.76% of 50 DAV
50 DAV is 3,925,000
|
$64.49
-6.78%
|
1/10/2012
|
$60.97
|
PP = $59.46
|
|
MB = $62.43
|
Most Recent Note - 1/17/2012 4:33:25 PM
Y - Pulled back today on below average volume. A considerable gap up gain on 1/10/12 helped it break out from a "double bottom" base. Prior chart highs in the low $60s have been acting as a recent resistance level.
>>> The latest Featured Stock Update with an annotated graph appeared on 1/10/2012. Click here.
View all notes |
Alert me of new notes |
CANSLIM.net Company Profile |
SEC |
Zacks Reports |
StockTalk |
News |
Chart |
Request a new note
C
A N
S L
I M
|
MA
-
NYSE
Mastercard Inc Cl A
DIVERSIFIED SERVICES - Business/Management Services
|
$340.66
|
-12.24
-3.47% |
$350.00
|
1,896,090
189.50% of 50 DAV
50 DAV is 1,000,600
|
$384.99
-11.51%
|
1/3/2012
|
$367.87
|
PP = $385.09
|
|
MB = $404.34
|
Most Recent Note - 1/20/2012 2:31:02 PM
G - Gapped down today for a damaging loss with above average volume, slumping near its recent low. Its 200 DMA line is the nearest support level to watch. A rebound above its 50 DMA line is needed, otherwise its technical stance is not that of a sound looking buy candidate.
>>> The latest Featured Stock Update with an annotated graph appeared on 1/3/2012. Click here.
View all notes |
Alert me of new notes |
CANSLIM.net Company Profile |
SEC |
Zacks Reports |
StockTalk |
News |
Chart |
Request a new note
C
A N
S L
I M
|
Symbol/Exchange
Company Name
Industry Group |
PRICE |
CHANGE
(%Change) |
Day High |
Volume
(% DAV)
(% 50 day avg vol) |
52 Wk Hi
% From Hi |
Featured
Date |
Price
Featured |
Pivot Featured |
|
Max Buy |
MKTX
-
NASDAQ
Marketaxess Holdings Inc
FINANCIAL SERVICES - Investment Brokerage - Nationa
|
$31.73
|
+0.02
0.06% |
$31.77
|
83,024
46.83% of 50 DAV
50 DAV is 177,300
|
$32.23
-1.55%
|
10/28/2011
|
$29.79
|
PP = $31.05
|
|
MB = $32.60
|
Most Recent Note - 1/18/2012 6:35:17 PM
Y - Still hovering near its all-time high without truly great volume conviction behind recent gains. The 50 DMA line defines initial chart support to watch.
>>> The latest Featured Stock Update with an annotated graph appeared on 12/20/2011. Click here.
View all notes |
Alert me of new notes |
CANSLIM.net Company Profile |
SEC |
Zacks Reports |
StockTalk |
News |
Chart |
Request a new note
C
A N
S L
I M
|
OSIS
-
NASDAQ
O S I Systems Inc
ELECTRONICS - Semiconductor Equipment and Mate
|
$55.91
|
+0.86
1.56% |
$56.50
|
100,819
105.24% of 50 DAV
50 DAV is 95,800
|
$55.66
0.46%
|
11/1/2011
|
$42.07
|
PP = $45.57
|
|
MB = $47.85
|
Most Recent Note - 1/18/2012 1:13:43 PM
G - Gapped up today, rallying for a considerable gain and new all-time highs, getting more extended from its prior base. Reported news of a six-year agreement for $400 million to provide turnkey screening services to Mexico's tax collection authority. Due to report earnings before the open on Tuesday, January 24th. Its 50 DMA line defines important support to watch.
>>> The latest Featured Stock Update with an annotated graph appeared on 12/27/2011. Click here.
View all notes |
Alert me of new notes |
CANSLIM.net Company Profile |
SEC |
Zacks Reports |
StockTalk |
News |
Chart |
Request a new note
C
A N
S L
I M
|
PRGO
-
NASDAQ
Perrigo Co
DRUGS - Drug Related Products
|
$98.48
|
-0.95
-0.96% |
$100.03
|
635,062
49.46% of 50 DAV
50 DAV is 1,284,100
|
$104.70
-5.94%
|
12/9/2011
|
$99.54
|
PP = $101.56
|
|
MB = $106.64
|
Most Recent Note - 1/19/2012 5:26:54 PM
G - Quietly perched within striking distance of its 52-week high with little resistance remaining due to overhead supply. Found support at its 50 DMA line
>>> The latest Featured Stock Update with an annotated graph appeared on 1/9/2012. Click here.
View all notes |
Alert me of new notes |
CANSLIM.net Company Profile |
SEC |
Zacks Reports |
StockTalk |
News |
Chart |
Request a new note
C
A N
S L
I M
|
RAX
-
NYSE
Rackspace Hosting Inc
INTERNET - Internet Software and; Services
|
$42.48
|
-1.08
-2.48% |
$43.60
|
1,749,684
106.44% of 50 DAV
50 DAV is 1,643,800
|
$46.50
-8.64%
|
11/8/2011
|
$44.28
|
PP = $46.27
|
|
MB = $48.58
|
Most Recent Note - 1/20/2012 7:22:50 PM
G - Color code is changed to green after today's loss on slightly higher volume led to a close below its 50 DMA line. Its recent low ($41.37 on 1/09/12) defines important near-term support to watch above its 200 DMA line.
>>> The latest Featured Stock Update with an annotated graph appeared on 1/5/2012. Click here.
View all notes |
Alert me of new notes |
CANSLIM.net Company Profile |
SEC |
Zacks Reports |
StockTalk |
News |
Chart |
Request a new note
C
A N
S L
I M
|
SXCI
-
NASDAQ
S X C Health Solutions
COMPUTER SOFTWARE and SERVICES - Healthcare Information Service
|
$62.89
|
+0.04
0.06% |
$63.37
|
277,673
70.49% of 50 DAV
50 DAV is 393,900
|
$66.40
-5.29%
|
1/10/2012
|
$62.05
|
PP = $60.10
|
|
MB = $63.11
|
Most Recent Note - 1/20/2012 7:17:23 PM
Y - Color code is changed to yellow while consolidating just below the "max buy" level. See the latest FSU analysis for more details and a new annotated weekly graph.
>>> The latest Featured Stock Update with an annotated graph appeared on 1/20/2012. Click here.
View all notes |
Alert me of new notes |
CANSLIM.net Company Profile |
SEC |
Zacks Reports |
StockTalk |
News |
Chart |
Request a new note
C
A N
S L
I M
|
Symbol/Exchange
Company Name
Industry Group |
PRICE |
CHANGE
(%Change) |
Day High |
Volume
(% DAV)
(% 50 day avg vol) |
52 Wk Hi
% From Hi |
Featured
Date |
Price
Featured |
Pivot Featured |
|
Max Buy |
TDG
-
NYSE
Transdigm Group Inc
AEROSPACE/DEFENSE - Aerospace/Defense Products and; Services
|
$97.06
|
-0.35
-0.36% |
$97.54
|
215,604
63.17% of 50 DAV
50 DAV is 341,300
|
$102.73
-5.52%
|
1/10/2012
|
$98.83
|
PP = $102.83
|
|
MB = $107.97
|
Most Recent Note - 1/19/2012 5:37:14 PM
Y - Small gain today with average volume. No overhead supply remains to act as resistance and subsequent volume-driven gains for new highs may help it clear a base-on-base type pattern. Recent lows in the $92 area define the next important support level to watch if it slumps below its 50 DMA line.
>>> The latest Featured Stock Update with an annotated graph appeared on 1/4/2012. Click here.
View all notes |
Alert me of new notes |
CANSLIM.net Company Profile |
SEC |
Zacks Reports |
StockTalk |
News |
Chart |
Request a new note
C
A N
S L
I M
|
TSCO
-
NASDAQ
Tractor Supply Co
SPECIALTY RETAIL - Specialty Retail, Other
|
$79.99
|
-0.44
-0.55% |
$80.86
|
448,084
63.45% of 50 DAV
50 DAV is 706,200
|
$81.98
-2.43%
|
1/12/2012
|
$79.12
|
PP = $75.58
|
|
MB = $79.36
|
Most Recent Note - 1/19/2012 5:42:51 PM
G - After hitting a new all-time high today it reversed into the red for a loss on above average volume, raising concerns. Prior highs in the mid-$70s which were a resistance area now define initial support to watch on pullbacks.
>>> The latest Featured Stock Update with an annotated graph appeared on 1/12/2012. Click here.
View all notes |
Alert me of new notes |
CANSLIM.net Company Profile |
SEC |
Zacks Reports |
StockTalk |
News |
Chart |
Request a new note
C
A N
S L
I M
|
ULTA
-
NASDAQ
Ulta Salon Cosm & Frag
SPECIALTY RETAIL - Specialty Retail, Other
|
$76.26
|
-1.13
-1.46% |
$77.76
|
601,780
63.09% of 50 DAV
50 DAV is 953,900
|
$77.83
-2.02%
|
1/11/2012
|
$71.97
|
PP = $75.80
|
|
MB = $79.59
|
Most Recent Note - 1/19/2012 5:43:44 PM
Y - Posted an 8th consecutive gain on near or below average volume and hit another new all-time high today, wedging up from a riskier late-stage base without sufficient volume to trigger a proper technical buy signal. Prior lows near $64 define important chart support above its 200 DMA line.
>>> The latest Featured Stock Update with an annotated graph appeared on 1/11/2012. Click here.
View all notes |
Alert me of new notes |
CANSLIM.net Company Profile |
SEC |
Zacks Reports |
StockTalk |
News |
Chart |
Request a new note
C
A N
S L
I M
|
V
-
NYSE
Visa Inc Cl A
DIVERSIFIED SERVICES - Business/Management Services
|
$100.58
|
-1.79
-1.75% |
$102.52
|
5,008,283
132.85% of 50 DAV
50 DAV is 3,770,000
|
$104.20
-3.47%
|
10/24/2011
|
$94.21
|
PP = $94.85
|
|
MB = $99.59
|
Most Recent Note - 1/19/2012 5:46:35 PM
G - Reversed into the red for a loss today with slightly higher (near average) volume than the prior session after touching another new all-time high. No overhead supply remains to act as resistance. Its recent low ($98.33 on 1/11/12) and its 50 DMA line define chart support to watch on pullbacks.
>>> The latest Featured Stock Update with an annotated graph appeared on 12/15/2011. Click here.
View all notes |
Alert me of new notes |
CANSLIM.net Company Profile |
SEC |
Zacks Reports |
StockTalk |
News |
Chart |
Request a new note
C
A N
S L
I M
|
|
|
|
THESE ARE NOT BUY RECOMMENDATIONS!
Comments contained in the body of this report are technical
opinions only. The material herein has been obtained
from sources believed to be reliable and accurate, however,
its accuracy and completeness cannot be guaranteed.
This site is not an investment advisor, hence it does
not endorse or recommend any securities or other investments.
Any recommendation contained in this report may not
be suitable for all investors and it is not to be deemed
an offer or solicitation on our part with respect to
the purchase or sale of any securities. All trademarks,
service marks and trade names appearing in this report
are the property of their respective owners, and are
likewise used for identification purposes only.
This report is a service available
only to active Paid Premium Members.
You may opt-out of receiving report notifications
at any time. Questions or comments may be submitted
by writing to Premium Membership Services 665 S.E. 10 Street, Suite 201 Deerfield Beach, FL 33441-5634 or by calling 1-800-965-8307
or 954-785-1121.
|
|
|

