***Last / Change / Volume data in this table is the closing quote data***
Symbol/Exchange
Company Name
Industry Group |
PRICE |
CHANGE
(%Change) |
Day High |
Volume
(% DAV)
(% 50 day avg vol) |
52 Wk Hi
% From Hi |
Featured
Date |
Price
Featured |
Pivot Featured |
|
Max Buy |
ADS
-
NYSE
Alliance Data Sys Corp
COMPUTER SOFTWARE and SERVICES - Information and Delivery Service
|
$109.85
|
+0.38
0.35% |
$110.16
|
570,231
82.83% of 50 DAV
50 DAV is 688,400
|
$109.87
-0.02%
|
1/17/2012
|
$108.24
|
PP = $107.43
|
|
MB = $112.80
|
Most Recent Note - 1/17/2012 6:30:20 PM
Y - Hit a new all-time high today and rallied above the previously cited "max buy" level with a gain backed by +40% above average volume, near the bare minimum volume required to trigger a proper technical buy signal. Color code remains yellow and a new pivot point was cited based on its 12/05/11 high plus 10 cents after building an orderly new flat base. Its 50 DMA line and the 1/04/12 session low ($100.42) define near-term support where violations would raise greater concerns and trigger technical sell signals. See the latest FSU analysis for more details and a new annotated graph.
>>> The latest Featured Stock Update with an annotated graph appeared on 1/17/2012. Click here.
View all notes |
Alert me of new notes |
CANSLIM.net Company Profile |
SEC |
Zacks Reports |
StockTalk |
News |
Chart |
Request a new note
C
A N
S L
I M


|
ALXN
-
NASDAQ
Alexion Pharmaceuticals
DRUGS - Drug Manufacturers - Other
|
$75.69
|
-1.30
-1.69% |
$77.19
|
1,255,650
106.54% of 50 DAV
50 DAV is 1,178,600
|
$77.58
-2.44%
|
11/30/2011
|
$68.66
|
PP = $70.52
|
|
MB = $74.05
|
Most Recent Note - 1/17/2012 4:14:50 PM
G - Hit another new all-time high with today's gain, getting more extended from its prior base. Prior resistance in the $70 area defines initial chart support above its 50 DMA line. See the latest FSU analysis for more details and a new annotated graph.
>>> The latest Featured Stock Update with an annotated graph appeared on 1/13/2012. Click here.
View all notes |
Alert me of new notes |
CANSLIM.net Company Profile |
SEC |
Zacks Reports |
StockTalk |
News |
Chart |
Request a new note
C
A N
S L
I M
|
CATM
-
NASDAQ
Cardtronics Inc
DIVERSIFIED SERVICES - Business/Management Services
|
$27.29
|
+0.70
2.63% |
$28.30
|
1,117,036
327.67% of 50 DAV
50 DAV is 340,900
|
$28.74
-5.05%
|
12/23/2011
|
$28.64
|
PP = $28.56
|
|
MB = $29.99
|
 Most Recent Note - 1/19/2012 11:46:41 AM
Y - Considerable gain today with above average volume following a new analyst buy rating. Rallying above its 50 DMA line, helping its technical stance improve with a 3rd consecutive gain. Color code was changed to yellow while approaching its previously cited pivot point and trading within close striking distance of its 52-week high.
>>> The latest Featured Stock Update with an annotated graph appeared on 12/23/2011. Click here.
View all notes |
Alert me of new notes |
CANSLIM.net Company Profile |
SEC |
Zacks Reports |
StockTalk |
News |
Chart |
Request a new note
C
A N
S L
I M
|
CELG
-
NASDAQ
Celgene Corp
DRUGS - Drug Manufacturers - Major
|
$72.21
|
-0.53
-0.73% |
$72.92
|
3,182,660
92.89% of 50 DAV
50 DAV is 3,426,300
|
$75.11
-3.86%
|
12/20/2011
|
$66.68
|
PP = $68.35
|
|
MB = $71.77
|
Most Recent Note - 1/17/2012 4:41:43 PM
G - Holding its ground after rallying beyond its "max buy" level with last week's streak of volume-driven gains. Prior highs in the $68 area define support to watch on pullbacks.
>>> The latest Featured Stock Update with an annotated graph appeared on 12/29/2011. Click here.
View all notes |
Alert me of new notes |
CANSLIM.net Company Profile |
SEC |
Zacks Reports |
StockTalk |
News |
Chart |
Request a new note
C
A N
S L
I M
|
FEIC
-
NASDAQ
F E I Co
ELECTRONICS - Diversified Electronics
|
$44.88
|
+0.29
0.65% |
$44.99
|
219,489
77.92% of 50 DAV
50 DAV is 281,700
|
$44.76
0.27%
|
12/7/2011
|
$41.41
|
PP = $42.35
|
|
MB = $44.47
|
Most Recent Note - 1/18/2012 6:38:02 PM
G - Gain today backed by +43% above average volume lifted it above its "max buy" level and its color code is changed to green while getting extended from its prior base. No overhead supply remains to hinder its upward progress. The 50 DMA line defines chart support above prior lows.
>>> The latest Featured Stock Update with an annotated graph appeared on 12/21/2011. Click here.
View all notes |
Alert me of new notes |
CANSLIM.net Company Profile |
SEC |
Zacks Reports |
StockTalk |
News |
Chart |
Request a new note
C
A N
S L
I M
|
Symbol/Exchange
Company Name
Industry Group |
PRICE |
CHANGE
(%Change) |
Day High |
Volume
(% DAV)
(% 50 day avg vol) |
52 Wk Hi
% From Hi |
Featured
Date |
Price
Featured |
Pivot Featured |
|
Max Buy |
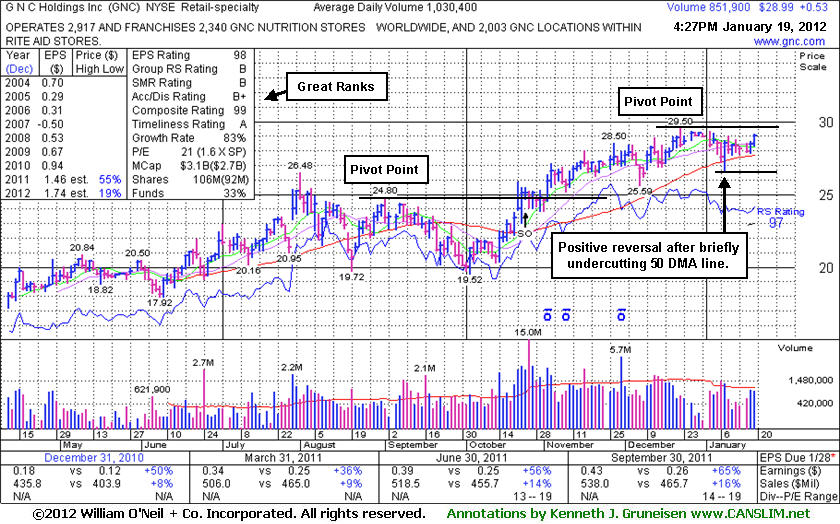
GNC
-
NYSE
G N C Holdings Inc
RETAIL - Drug Stores
|
$28.99
|
+0.53
1.86% |
$29.12
|
852,502
82.74% of 50 DAV
50 DAV is 1,030,400
|
$29.50
-1.73%
|
1/19/2012
|
$28.99
|
PP = $29.60
|
|
MB = $31.08
|
Most Recent Note - 1/19/2012 5:22:28 PM
Y - Color code is changed to yellow with new pivot point cited based on its 52-week high plus 10 cents. See the latest FSU analysis for more details and a new annotated graph.
>>> The latest Featured Stock Update with an annotated graph appeared on 1/19/2012. Click here.
View all notes |
Alert me of new notes |
CANSLIM.net Company Profile |
SEC |
Zacks Reports |
StockTalk |
News |
Chart |
Request a new note
C
A N
S L
I M
|
HMSY
-
NASDAQ
H M S Holdings Corp
COMPUTER SOFTWARE and SERVICES - Healthcare Information Service
|
$34.10
|
+0.07
0.21% |
$34.73
|
588,318
60.28% of 50 DAV
50 DAV is 976,000
|
$34.06
0.12%
|
10/27/2011
|
$26.44
|
PP = $28.37
|
|
MB = $29.79
|
Most Recent Note - 1/17/2012 4:29:18 PM
G - Hit a new all-time high with today's gain backed by higher but still below average volume. No resistance remains to hinder its progress, but it is extended from its prior base.
>>> The latest Featured Stock Update with an annotated graph appeared on 12/28/2011. Click here.
View all notes |
Alert me of new notes |
CANSLIM.net Company Profile |
SEC |
Zacks Reports |
StockTalk |
News |
Chart |
Request a new note
C
A N
S L
I M
|
ISRG
-
NASDAQ
Intuitive Surgical Inc
HEALTH SERVICES - Medical Appliances and Equipment
|
$474.65
|
+3.79
0.80% |
$476.49
|
586,661
194.77% of 50 DAV
50 DAV is 301,200
|
$474.50
0.03%
|
12/20/2011
|
$442.43
|
PP = $449.16
|
|
MB = $471.62
|
Most Recent Note - 1/18/2012 6:33:26 PM
Y - Posted a 5th consecutive small gain today on average volume. Due to report earnings after Thursday's close. See the latest FSU analysis for more details and a new annotated graph.
>>> The latest Featured Stock Update with an annotated graph appeared on 1/18/2012. Click here.
View all notes |
Alert me of new notes |
CANSLIM.net Company Profile |
SEC |
Zacks Reports |
StockTalk |
News |
Chart |
Request a new note
C
A N
S L
I M
|
LULU
-
NASDAQ
Lululemon Athletica
MANUFACTURING - Textile Manufacturing
|
$60.14
|
-0.37
-0.61% |
$61.00
|
2,490,385
63.53% of 50 DAV
50 DAV is 3,919,900
|
$64.49
-6.75%
|
1/10/2012
|
$60.97
|
PP = $59.46
|
|
MB = $62.43
|
Most Recent Note - 1/17/2012 4:33:25 PM
Y - Pulled back today on below average volume. A considerable gap up gain on 1/10/12 helped it break out from a "double bottom" base. Prior chart highs in the low $60s have been acting as a recent resistance level.
>>> The latest Featured Stock Update with an annotated graph appeared on 1/10/2012. Click here.
View all notes |
Alert me of new notes |
CANSLIM.net Company Profile |
SEC |
Zacks Reports |
StockTalk |
News |
Chart |
Request a new note
C
A N
S L
I M
|
MA
-
NYSE
Mastercard Inc Cl A
DIVERSIFIED SERVICES - Business/Management Services
|
$352.90
|
+0.52
0.15% |
$356.00
|
884,919
87.82% of 50 DAV
50 DAV is 1,007,700
|
$384.99
-8.34%
|
1/3/2012
|
$367.87
|
PP = $385.09
|
|
MB = $404.34
|
Most Recent Note - 1/17/2012 4:36:57 PM
G - Posted a gain today on near average volume. It remains -10% off its 52-week high and below its 50 DMA line. It recently has sputtered near its late-November lows, leaving its 200 DMA line as the nearest support level to watch now.
>>> The latest Featured Stock Update with an annotated graph appeared on 1/3/2012. Click here.
View all notes |
Alert me of new notes |
CANSLIM.net Company Profile |
SEC |
Zacks Reports |
StockTalk |
News |
Chart |
Request a new note
C
A N
S L
I M
|
Symbol/Exchange
Company Name
Industry Group |
PRICE |
CHANGE
(%Change) |
Day High |
Volume
(% DAV)
(% 50 day avg vol) |
52 Wk Hi
% From Hi |
Featured
Date |
Price
Featured |
Pivot Featured |
|
Max Buy |
MKTX
-
NASDAQ
Marketaxess Holdings Inc
FINANCIAL SERVICES - Investment Brokerage - Nationa
|
$31.71
|
+0.26
0.83% |
$31.85
|
57,451
31.14% of 50 DAV
50 DAV is 184,500
|
$32.23
-1.61%
|
10/28/2011
|
$29.79
|
PP = $31.05
|
|
MB = $32.60
|
Most Recent Note - 1/18/2012 6:35:17 PM
Y - Still hovering near its all-time high without truly great volume conviction behind recent gains. The 50 DMA line defines initial chart support to watch.
>>> The latest Featured Stock Update with an annotated graph appeared on 12/20/2011. Click here.
View all notes |
Alert me of new notes |
CANSLIM.net Company Profile |
SEC |
Zacks Reports |
StockTalk |
News |
Chart |
Request a new note
C
A N
S L
I M
|
OSIS
-
NASDAQ
O S I Systems Inc
ELECTRONICS - Semiconductor Equipment and Mate
|
$55.05
|
+0.88
1.62% |
$55.66
|
75,582
78.49% of 50 DAV
50 DAV is 96,300
|
$54.26
1.46%
|
11/1/2011
|
$42.07
|
PP = $45.57
|
|
MB = $47.85
|
Most Recent Note - 1/18/2012 1:13:43 PM
G - Gapped up today, rallying for a considerable gain and new all-time highs, getting more extended from its prior base. Reported news of a six-year agreement for $400 million to provide turnkey screening services to Mexico's tax collection authority. Due to report earnings before the open on Tuesday, January 24th. Its 50 DMA line defines important support to watch.
>>> The latest Featured Stock Update with an annotated graph appeared on 12/27/2011. Click here.
View all notes |
Alert me of new notes |
CANSLIM.net Company Profile |
SEC |
Zacks Reports |
StockTalk |
News |
Chart |
Request a new note
C
A N
S L
I M
|
PRGO
-
NASDAQ
Perrigo Co
DRUGS - Drug Related Products
|
$99.43
|
-0.42
-0.42% |
$100.61
|
672,004
52.21% of 50 DAV
50 DAV is 1,287,200
|
$104.70
-5.03%
|
12/9/2011
|
$99.54
|
PP = $101.56
|
|
MB = $106.64
|
Most Recent Note - 1/19/2012 5:26:54 PM
G - Quietly perched within striking distance of its 52-week high with little resistance remaining due to overhead supply. Found support at its 50 DMA line
>>> The latest Featured Stock Update with an annotated graph appeared on 1/9/2012. Click here.
View all notes |
Alert me of new notes |
CANSLIM.net Company Profile |
SEC |
Zacks Reports |
StockTalk |
News |
Chart |
Request a new note
C
A N
S L
I M
|
RAX
-
NYSE
Rackspace Hosting Inc
INTERNET - Internet Software and; Services
|
$43.56
|
+0.28
0.65% |
$44.44
|
1,564,505
94.77% of 50 DAV
50 DAV is 1,650,900
|
$46.50
-6.31%
|
11/8/2011
|
$44.28
|
PP = $46.27
|
|
MB = $48.58
|
Most Recent Note - 1/19/2012 5:30:08 PM
Y - Gapped up today but finished near the lower end of its intra-day range for only a small gain on lighter volume. Its recent low ($41.37 on 1/09/12) defines important near-term support to watch above its 200 DMA line.
>>> The latest Featured Stock Update with an annotated graph appeared on 1/5/2012. Click here.
View all notes |
Alert me of new notes |
CANSLIM.net Company Profile |
SEC |
Zacks Reports |
StockTalk |
News |
Chart |
Request a new note
C
A N
S L
I M
|
SXCI
-
NASDAQ
S X C Health Solutions
COMPUTER SOFTWARE and SERVICES - Healthcare Information Service
|
$62.85
|
-0.30
-0.48% |
$65.95
|
354,137
88.03% of 50 DAV
50 DAV is 402,300
|
$66.40
-5.35%
|
1/10/2012
|
$62.05
|
PP = $60.10
|
|
MB = $63.11
|
Most Recent Note - 1/19/2012 5:34:24 PM
G - Challenged its 52-week high after gapping up today, but closed near the session low after a negative reversal. Ownership by top-rated funds has been increasing, rising from 453 in Jun '10 to 603 in Dec '11, a reassuring sign concerning the I criteria. Strong prior quarters and good annual earnings history satisfy the C & A criteria.
There are no Featured Stock Updates™ available for this stock at this time. You may request one by clicking the Request a New Note link below
View all notes |
Alert me of new notes |
CANSLIM.net Company Profile |
SEC |
Zacks Reports |
StockTalk |
News |
Chart |
Request a new note
C
A N
S L
I M
|
Symbol/Exchange
Company Name
Industry Group |
PRICE |
CHANGE
(%Change) |
Day High |
Volume
(% DAV)
(% 50 day avg vol) |
52 Wk Hi
% From Hi |
Featured
Date |
Price
Featured |
Pivot Featured |
|
Max Buy |
TDG
-
NYSE
Transdigm Group Inc
AEROSPACE/DEFENSE - Aerospace/Defense Products and; Services
|
$97.41
|
+0.81
0.84% |
$98.32
|
321,109
95.34% of 50 DAV
50 DAV is 336,800
|
$102.73
-5.18%
|
1/10/2012
|
$98.83
|
PP = $102.83
|
|
MB = $107.97
|
Most Recent Note - 1/19/2012 5:37:14 PM
Y - Small gain today with average volume. No overhead supply remains to act as resistance and subsequent volume-driven gains for new highs may help it clear a base-on-base type pattern. Recent lows in the $92 area define the next important support level to watch if it slumps below its 50 DMA line.
>>> The latest Featured Stock Update with an annotated graph appeared on 1/4/2012. Click here.
View all notes |
Alert me of new notes |
CANSLIM.net Company Profile |
SEC |
Zacks Reports |
StockTalk |
News |
Chart |
Request a new note
C
A N
S L
I M
|
TSCO
-
NASDAQ
Tractor Supply Co
SPECIALTY RETAIL - Specialty Retail, Other
|
$80.43
|
-0.86
-1.06% |
$81.98
|
1,097,666
158.94% of 50 DAV
50 DAV is 690,600
|
$81.32
-1.09%
|
1/12/2012
|
$79.12
|
PP = $75.58
|
|
MB = $79.36
|
Most Recent Note - 1/19/2012 5:42:51 PM
G - After hitting a new all-time high today it reversed into the red for a loss on above average volume, raising concerns. Prior highs in the mid-$70s which were a resistance area now define initial support to watch on pullbacks.
>>> The latest Featured Stock Update with an annotated graph appeared on 1/12/2012. Click here.
View all notes |
Alert me of new notes |
CANSLIM.net Company Profile |
SEC |
Zacks Reports |
StockTalk |
News |
Chart |
Request a new note
C
A N
S L
I M
|
ULTA
-
NASDAQ
Ulta Salon Cosm & Frag
SPECIALTY RETAIL - Specialty Retail, Other
|
$77.39
|
+1.64
2.17% |
$77.83
|
890,978
92.13% of 50 DAV
50 DAV is 967,100
|
$75.83
2.06%
|
1/11/2012
|
$71.97
|
PP = $75.80
|
|
MB = $79.59
|
Most Recent Note - 1/19/2012 5:43:44 PM
Y - Posted an 8th consecutive gain on near or below average volume and hit another new all-time high today, wedging up from a riskier late-stage base without sufficient volume to trigger a proper technical buy signal. Prior lows near $64 define important chart support above its 200 DMA line.
>>> The latest Featured Stock Update with an annotated graph appeared on 1/11/2012. Click here.
View all notes |
Alert me of new notes |
CANSLIM.net Company Profile |
SEC |
Zacks Reports |
StockTalk |
News |
Chart |
Request a new note
C
A N
S L
I M
|
V
-
NYSE
Visa Inc Cl A
DIVERSIFIED SERVICES - Business/Management Services
|
$102.37
|
-1.41
-1.36% |
$104.20
|
3,641,464
96.71% of 50 DAV
50 DAV is 3,765,200
|
$103.88
-1.45%
|
10/24/2011
|
$94.21
|
PP = $94.85
|
|
MB = $99.59
|
Most Recent Note - 1/19/2012 5:46:35 PM
G - Reversed into the red for a loss today with slightly higher (near average) volume than the prior session after touching another new all-time high. No overhead supply remains to act as resistance. Its recent low ($98.33 on 1/11/12) and its 50 DMA line define chart support to watch on pullbacks.
>>> The latest Featured Stock Update with an annotated graph appeared on 12/15/2011. Click here.
View all notes |
Alert me of new notes |
CANSLIM.net Company Profile |
SEC |
Zacks Reports |
StockTalk |
News |
Chart |
Request a new note
C
A N
S L
I M
|