You are not logged in.
This means you
CAN ONLY VIEW reports that were published prior to Monday, April 14, 2025.
You
MUST UPGRADE YOUR MEMBERSHIP if you want to see any current reports.
AFTER MARKET UPDATE - FRIDAY, JANUARY 18TH, 2013
Previous After Market Report Next After Market Report >>>
|
|
|
|
DOW |
+53.68 |
13,649.70 |
+0.39% |
|
Volume |
1,068,372,590 |
+50% |
|
Volume |
1,835,207,200 |
+8% |
|
NASDAQ |
-1.29 |
3,134.71 |
-0.04% |
|
Advancers |
1,958 |
63% |
|
Advancers |
1,305 |
51% |
|
S&P 500 |
+5.04 |
1,485.98 |
+0.34% |
|
Decliners |
1,029 |
33% |
|
Decliners |
1,132 |
44% |
|
Russell 2000 |
+2.44 |
892.80 |
+0.27% |
|
52 Wk Highs |
315 |
|
|
52 Wk Highs |
138 |
|
|
S&P 600 |
+1.95 |
500.06 |
+0.39% |
|
52 Wk Lows |
5 |
|
|
52 Wk Lows |
8 |
|
|
 |
Major Averages Tallied Third Consecutive Weekly Gains
Kenneth J. Gruneisen - Passed the CAN SLIM® Master's Exam
The major averages posted their 3rd consecutive weekly gains as the Dow Jones Industrial Average rose +1.2% and the S&P 500 Index gained +1.0%, and the Nasdaq Composite Index rallied +0.3% on the week. The Nasdaq Composite Index lagged and ended Friday's session down a point while the other indices finished the session with gains. The volume totals were reported higher on the NYSE and on the Nasdaq exchange, inflated by options expirations. Breadth was positive as advancers led decliners by nearly 2-1 on the NYSE but advancers led decliners by a narrower 7-6 margin on the Nasdaq. The total number of stocks hitting new 52-week highs easily outnumbered new 52-week lows on the NYSE and on the Nasdaq exchange. New 52-week lows totals were in the single digits on both exchanges again. There were 83 high-ranked companies from the CANSLIM.net Leaders List making new 52-week highs and appearing on the CANSLIM.net BreakOuts Page, down from the prior session total of 117 stocks. There were gains for 7 of the 9 high-ranked companies currently included on the Featured Stocks Page. Patience and selectivity are required, however, as the latest rally has produced very few action worthy candidates meeting all of the fact-based investment system's criteria.
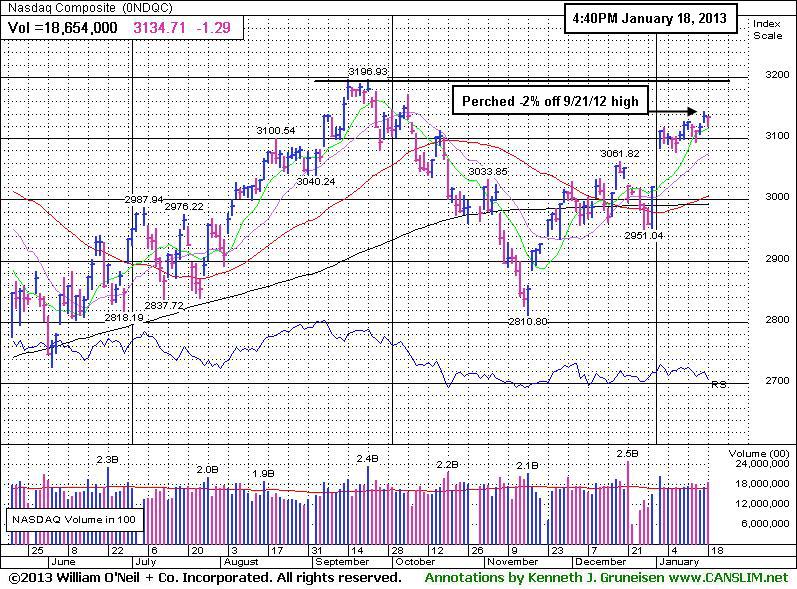
PICTURED 1: The Nasdaq Composite Index is perched -2% off its 9/21/12 high.
On the economic front, the University of Michigan consumer sentiment survey unexpectedly declined in January to 71.3. Investors digested mixed earnings releases and reports that Republican lawmakers are considering a short-term solution to increase the debt ceiling. Meanwhile in Asia, China exited a slowdown in economic expansion as GDP rose +7.9% in the fourth quarter of 2012, accelerating for the first time in two years.
Technology led the market lower after chipmaker Intel Corp (INTC -6.31%) said a drop in PC sales led to a -27% decline in profit. It forecast a drop in sales and said it plans to increase capital spending by $13 billion this year. AT&T Inc (T +0.72%) despite announcing it will take a fourth-quarter charge of approximately $10 billion. Industrials were higher with General Electric Corp (GE +3.47%) gaining after posting earnings ahead of analyst estimates. Morgan Stanley (MS +7.86%) advanced following its better-than-expected quarterly results. Shares of Capital One Financial Corp (COF -7.47%) dropped following its earnings falling short of expectations.
Treasuries advanced with the 10-year note up 11/32 to yield 1.84%.
Investors may consider new buying efforts in stocks meeting all key criteria, as the market's (M criteria) confirmed uptrend showed a great expansion in leadership (stocks hitting new 52-week highs). Widespread gains helped all of the major averages blast higher, and the benchmark S&P 500 Index is perched at its best level in more than five years.
Watch for an announcement via email concerning the next WEBCAST. The webcast will also be available via an updated link highlighted at the top of the Premium Member Homepage.
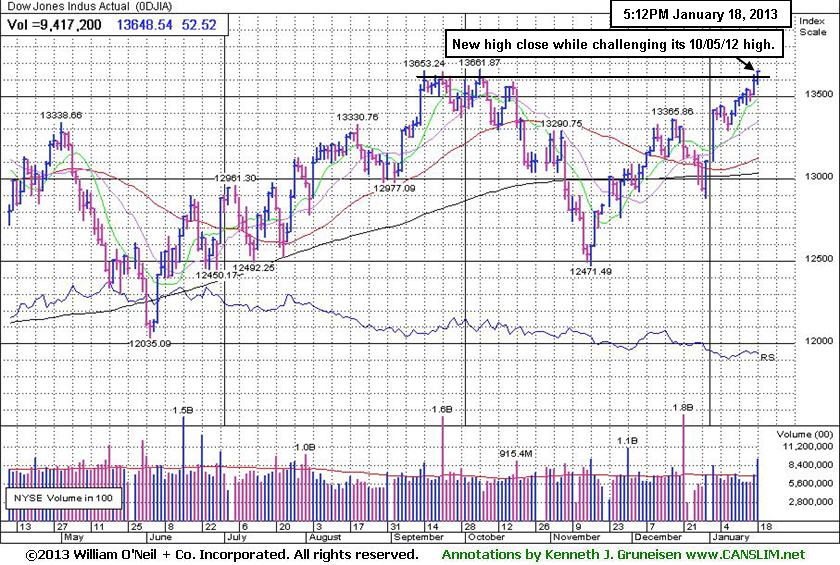
PICTURED 2: The Dow Jones Industrial Average managed a new high close while challenging its 10/05/12 high.
|
 Kenneth J. Gruneisen started out as a licensed stockbroker in August 1987, a couple of months prior to the historic stock market crash that took the Dow Jones Industrial Average down -22.6% in a single day. He has published daily fact-based fundamental and technical analysis on high-ranked stocks online for two decades. Through FACTBASEDINVESTING.COM, Kenneth provides educational articles, news, market commentary, and other information regarding proven investment systems that work in good times and bad.
Comments contained in the body of this report are technical opinions only and are not necessarily those of Gruneisen Growth Corp. The material herein has been obtained from sources believed to be reliable and accurate, however, its accuracy and completeness cannot be guaranteed. Our firm, employees, and customers may effect transactions, including transactions contrary to any recommendation herein, or have positions in the securities mentioned herein or options with respect thereto. Any recommendation contained in this report may not be suitable for all investors and it is not to be deemed an offer or solicitation on our part with respect to the purchase or sale of any securities. |
|
 |
Oil Services Index's Standout Gain Adds to Big January Surge
Kenneth J. Gruneisen - Passed the CAN SLIM® Master's Exam
The Oil Services Index ($OSX +1.97%) was a standout gainer while the Integrated Oil Index ($XOI +0.19%) ended with a smaller gain. The Retail Index ($RLX +0.37%) and Broker/Dealer Index ($XBD +1.46%) posted influential gains while the Bank Index ($BKX -0.26%) sputtered for a small loss. Weakness and mixed action in the tech sector weighed on the tech-heavy Nasdaq as the Semiconductor Index ($SOX -0.46%) and the Networking Index ($NWX -0.45%) edged lower while the Internet Index ($IIX +0.23%) and the Biotechnology Index ($BTK +0.51%) posted small gains. Defensive groups showed little decisiveness as the Gold & Silver Index ($XAU -0.11%) inched lower and the Healthcare Index ($HMO +0.15%) tallied a tiny gain.
Charts courtesy www.stockcharts.com
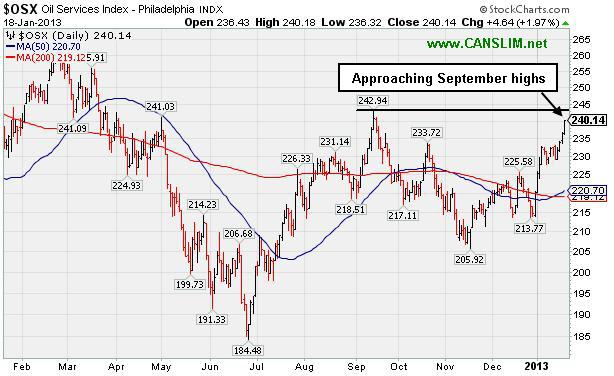
PICTURED: The Oil Services Index ($OSX +1.97%) has been rallying considerably in January and it is approaching its September highs.
| Oil Services |
$OSX |
240.14 |
+4.64 |
+1.97% |
+9.08% |
| Healthcare |
$HMO |
2,591.56 |
+3.76 |
+0.15% |
+3.08% |
| Integrated Oil |
$XOI |
1,304.07 |
+2.43 |
+0.19% |
+5.01% |
| Semiconductor |
$SOX |
410.64 |
-1.89 |
-0.46% |
+6.92% |
| Networking |
$NWX |
244.53 |
-1.10 |
-0.45% |
+7.93% |
| Internet |
$IIX |
343.00 |
+0.79 |
+0.23% |
+4.89% |
| Broker/Dealer |
$XBD |
100.35 |
+1.45 |
+1.46% |
+6.38% |
| Retail |
$RLX |
684.40 |
+2.49 |
+0.37% |
+4.80% |
| Gold & Silver |
$XAU |
161.34 |
-0.18 |
-0.11% |
-2.57% |
| Bank |
$BKX |
53.48 |
-0.14 |
-0.26% |
+4.29% |
| Biotech |
$BTK |
1,663.23 |
+8.43 |
+0.51% |
+7.51% |
|
|
|
 |
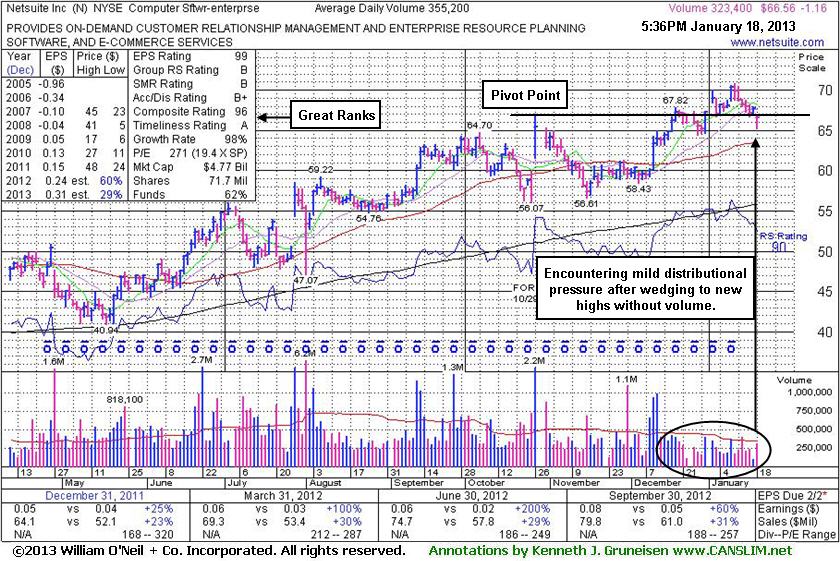
Encountering Mild Distributional Pressure
Kenneth J. Gruneisen - Passed the CAN SLIM® Master's Exam
Netsuite Inc (N -$1.16 or -1.71% to $66.56) gapped down today but finished near the session high. It has encountered mild distributional pressure and finished -6% off its 52-week high. Recent gains above its pivot point were marked by below average volume. It was last shown in this FSU section on 1/04/12 with an annotated graph under the headline, "Wedging Action is Not an Encouraging Surge to New Highs", as it traded above its pivot point, however its gains were marked by light volume as we observed - "That kind of action is technically termed 'wedging' and it does not have the look of hearty buying demand coming from the institutional crowd. Disciplined investors know that volume must be at least +40% above average behind gains above the pivot point to trigger a proper technical buy signal. Without heavy volume behind a stock's breakout investors have little reason to believe sufficient buying demand is lurking to allow for it to make a meaningful and sustained advance in price."
Netsuite Inc was highlighted in yellow in the 12/12/12 mid-day report with a pivot point cited based on its 10/26/12 high plus 10 cents (read here). The high-ranked Computer Software -Enterprise firm reported earnings +60% on +31% sales revenues for the quarter ended September 30, 2012 versus the year ago period. Earnings increased above the +25% minimum earnings guideline (C criteria) in the 5 latest quarterly comparisons. Its annual earnings (A criteria) history improved from losses prior to FY '09. The number of top-rated funds owning its shares rose from 201 in Jun '11 to 291 in Dec '12, a reassuring sign concerning the I criteria. The Computer Software -Enterprise group has a Group Relative Strength Rating of B, a reassuring sign concerning the L criteria.
Disciplined investors use a tactic that they teach in the Certification program called "pyramiding", a method of staggering multiple buy orders which allows the ongoing market action to dictate their weighting in new buy candidates. Always limit losses by selling if any stock falls more than -7% from the purchase price. If a stock strengthens after it is sold it can always be bought back, but following strict selling rules is what keeps an investor from letting a small loss become a more devastating loss.
|
|
|
Color Codes Explained :
Y - Better candidates highlighted by our
staff of experts.
G - Previously featured
in past reports as yellow but may no longer be buyable under the
guidelines.
***Last / Change / Volume data in this table is the closing quote data***
Symbol/Exchange
Company Name
Industry Group |
PRICE |
CHANGE
(%Change) |
Day High |
Volume
(% DAV)
(% 50 day avg vol) |
52 Wk Hi
% From Hi |
Featured
Date |
Price
Featured |
Pivot Featured |
|
Max Buy |
CELG
-
NASDAQ
Celgene Corp
DRUGS - Drug Manufacturers - Major
|
$100.03
|
+1.84
1.87% |
$100.12
|
3,779,688
105.52% of 50 DAV
50 DAV is 3,582,100
|
$99.75
0.28%
|
12/11/2012
|
$82.24
|
PP = $81.34
|
|
MB = $85.41
|
 Most Recent Note - 1/18/2013 4:28:11 PM
G - Hit a new all-time high and finished near the session high today. Very extended from its prior base, but having rallied more than +20% in the first 2-3 weeks after its breakout, the investment system rules suggest holding such winners for a minimum of 8 weeks. See the latest FSU analysis for more details and a new annotated graph.
>>> The latest Featured Stock Update with an annotated graph appeared on 1/17/2013. Click here.
View all notes |
Alert me of new notes |
CANSLIM.net Company Profile |
SEC |
Zacks Reports |
StockTalk |
News |
Chart |
Request a new note
C
A N
S L
I M


|
CFNL
-
NASDAQ
Cardinal Financial Corp
BANKING - Regional - Southeast Banks
|
$15.96
|
+0.05
0.31% |
$15.97
|
376,359
168.54% of 50 DAV
50 DAV is 223,300
|
$16.90
-5.56%
|
12/3/2012
|
$15.20
|
PP = $16.31
|
|
MB = $17.13
|
Most Recent Note - 1/18/2013 12:06:45 PM
Y - Trading near its 50 DMA line (now $15.79) today following a gap down and loss with above average volume on the prior session. That important short-term average acted as support throughout its ongoing ascent. A damaging violation may trigger a technical sell signal. Reported earnings +54% on +28% sales revenues for the quarter ended December 31, 2012 versus the year ago period, continuing its strong earnings track record satisfying the C criteria.
>>> The latest Featured Stock Update with an annotated graph appeared on 1/15/2013. Click here.
View all notes |
Alert me of new notes |
CANSLIM.net Company Profile |
SEC |
Zacks Reports |
StockTalk |
News |
Chart |
Request a new note
C
A N
S L
I M
|
CMCSA
-
NASDAQ
Comcast Corp Cl A
MEDIA - CATV Systems
|
$40.27
|
+0.32
0.79% |
$40.28
|
11,771,651
104.35% of 50 DAV
50 DAV is 11,281,100
|
$40.04
0.56%
|
12/3/2012
|
$37.08
|
PP = $38.06
|
|
MB = $39.96
|
Most Recent Note - 1/18/2013 12:08:06 PM
G - Color code was changed to green after rallying to its "max buy" level. Perched at its 52-week high with no resistance remaining due to overhead supply. Prior highs in the $38 area define initial support to watch on pullbacks.
>>> The latest Featured Stock Update with an annotated graph appeared on 1/11/2013. Click here.
View all notes |
Alert me of new notes |
CANSLIM.net Company Profile |
SEC |
Zacks Reports |
StockTalk |
News |
Chart |
Request a new note
C
A N
S L
I M
|
MIDD
-
NASDAQ
Middleby Corp
MANUFACTURING - Diversified Machinery
|
$132.01
|
+0.72
0.55% |
$132.19
|
65,827
78.37% of 50 DAV
50 DAV is 84,000
|
$134.51
-1.86%
|
10/8/2012
|
$118.46
|
PP = $122.67
|
|
MB = $128.80
|
Most Recent Note - 1/14/2013 5:50:33 PM
G - Holding its ground stubbornly near its 52-week and all-time highs with recent volume totals below average. Earnings +23% on +18% sales for the Sep '12 quarter, below the +25% minimum earnings guideline (C criteria), raised concerns. See latest FSU analysis for more details and a new annotated graph.
>>> The latest Featured Stock Update with an annotated graph appeared on 1/14/2013. Click here.
View all notes |
Alert me of new notes |
CANSLIM.net Company Profile |
SEC |
Zacks Reports |
StockTalk |
News |
Chart |
Request a new note
C
A N
S L
I M
|
N
-
NYSE
Netsuite Inc
DIVERSIFIED SERVICES - Business/Management Services
|
$66.56
|
-1.16
-1.71% |
$66.96
|
323,446
91.06% of 50 DAV
50 DAV is 355,200
|
$70.80
-5.99%
|
12/12/2012
|
$64.75
|
PP = $67.12
|
|
MB = $70.48
|
Most Recent Note - 1/18/2013 5:53:18 PM
Y - Gapped down today yet finished near the session high and -6% off its 52-week high. Recent gains above its pivot point were marked by below average volume. See the latest FSU analysis for more details and a new annotated graph,
>>> The latest Featured Stock Update with an annotated graph appeared on 1/18/2013. Click here.
View all notes |
Alert me of new notes |
CANSLIM.net Company Profile |
SEC |
Zacks Reports |
StockTalk |
News |
Chart |
Request a new note
C
A N
S L
I M
|
Symbol/Exchange
Company Name
Industry Group |
PRICE |
CHANGE
(%Change) |
Day High |
Volume
(% DAV)
(% 50 day avg vol) |
52 Wk Hi
% From Hi |
Featured
Date |
Price
Featured |
Pivot Featured |
|
Max Buy |
NSR
-
NYSE
Neustar Inc
TELECOMMUNICATIONS - Diversified Communication Serv
|
$43.96
|
+0.57
1.31% |
$45.44
|
387,908
91.53% of 50 DAV
50 DAV is 423,800
|
$45.49
-3.36%
|
12/11/2012
|
$41.85
|
PP = $41.41
|
|
MB = $43.48
|
Most Recent Note - 1/17/2013 4:24:25 PM
G - After hitting a new 52-week high today there was a worrisome "negative reversal" for a loss with above average volume. Prior highs and its 50 DMA line coincide near $41 defining chart support to watch on pullbacks. See the latest FSU analysis for more details and a new annotated graph.
>>> The latest Featured Stock Update with an annotated graph appeared on 1/16/2013. Click here.
View all notes |
Alert me of new notes |
CANSLIM.net Company Profile |
SEC |
Zacks Reports |
StockTalk |
News |
Chart |
Request a new note
C
A N
S L
I M
|
RAX
-
NYSE
Rackspace Hosting Inc
INTERNET - Internet Software and; Services
|
$77.78
|
+0.45
0.58% |
$77.98
|
625,288
47.33% of 50 DAV
50 DAV is 1,321,200
|
$78.62
-1.07%
|
12/18/2012
|
$71.88
|
PP = $70.10
|
|
MB = $73.61
|
Most Recent Note - 1/15/2013 2:50:13 PM
G - Volume totals have been cooling for the past week while holding its ground in a tight range near its all-time high. Extended from its prior base, meanwhile prior highs in the $70 area define initial support to watch.
>>> The latest Featured Stock Update with an annotated graph appeared on 1/8/2013. Click here.
View all notes |
Alert me of new notes |
CANSLIM.net Company Profile |
SEC |
Zacks Reports |
StockTalk |
News |
Chart |
Request a new note
C
A N
S L
I M
|
RNF
-
NYSE
Rentech Nitrogen Ptnr Lp
CHEMICALS - Agricultural Chemicals
|
$44.85
|
+0.37
0.83% |
$45.28
|
241,629
75.96% of 50 DAV
50 DAV is 318,100
|
$48.19
-6.93%
|
11/1/2012
|
$39.11
|
PP = $40.15
|
|
MB = $42.16
|
Most Recent Note - 1/16/2013 12:28:03 PM
G - Down considerably today for a 3rd loss with above average volume in a 4-day span after getting extended from prior highs in the $40 area which define support to watch on pullbacks. Disciplined investors avoid chasing stocks extended more than +5% above prior highs following a technical breakout from a sound base.
>>> The latest Featured Stock Update with an annotated graph appeared on 1/9/2013. Click here.
View all notes |
Alert me of new notes |
CANSLIM.net Company Profile |
SEC |
Zacks Reports |
StockTalk |
News |
Chart |
Request a new note
C
A N
S L
I M
|
VRX
-
NYSE
Valeant Pharmaceuticals
DRUGS - Drug Manufacturers - Other
|
$63.77
|
-0.01
-0.02% |
$63.90
|
1,042,933
66.55% of 50 DAV
50 DAV is 1,567,100
|
$64.69
-1.42%
|
12/20/2012
|
$60.24
|
PP = $61.21
|
|
MB = $64.27
|
Most Recent Note - 1/14/2013 5:59:36 PM
Y - Hovering quietly above its pivot point and near its 52-week high today. Volume behind recent gains was below the +40% above average volume guideline which is the bare minimum threshold needed to trigger a proper technical buy signal. Disciplined investors may use a tactic called "pyramiding" to allow market action to dictate their positioning.
>>> The latest Featured Stock Update with an annotated graph appeared on 1/10/2013. Click here.
View all notes |
Alert me of new notes |
CANSLIM.net Company Profile |
SEC |
Zacks Reports |
StockTalk |
News |
Chart |
Request a new note
C
A N
S L
I M
|
|
|
|
THESE ARE NOT BUY RECOMMENDATIONS!
Comments contained in the body of this report are technical
opinions only. The material herein has been obtained
from sources believed to be reliable and accurate, however,
its accuracy and completeness cannot be guaranteed.
This site is not an investment advisor, hence it does
not endorse or recommend any securities or other investments.
Any recommendation contained in this report may not
be suitable for all investors and it is not to be deemed
an offer or solicitation on our part with respect to
the purchase or sale of any securities. All trademarks,
service marks and trade names appearing in this report
are the property of their respective owners, and are
likewise used for identification purposes only.
This report is a service available
only to active Paid Premium Members.
You may opt-out of receiving report notifications
at any time. Questions or comments may be submitted
by writing to Premium Membership Services 665 S.E. 10 Street, Suite 201 Deerfield Beach, FL 33441-5634 or by calling 1-800-965-8307
or 954-785-1121.
|
|
|

