Symbol/Exchange
Company Name
Industry Group |
PRICE |
CHANGE
(%Change) |
Day High |
Volume
(% DAV)
(% 50 day avg vol) |
52 Wk Hi
% From Hi |
Featured
Date |
Price
Featured |
Pivot Featured |
|
Max Buy |
ABV
-
NYSE
Comp De Bebidas Adr
FOOD and BEVERAGE - Beverages - Brewers
|
$28.08
|
-1.15
-3.93% |
$29.10
|
6,240,702
245.47% of 50 DAV
50 DAV is 2,542,300
|
$32.00
-12.25%
|
12/10/2010
|
$27.97
|
PP = $29.09
|
|
MB = $30.54
|
 Most Recent Note - 1/14/2011 2:38:43 PM
G - Gapped down again today and violated prior highs in the $29 area and its 50 DMA line with a damaging loss on heavy volume triggering technical sell signals. (Do not be confused by the 5:1 split impacting its share price as of 12/28/10. Previous data concerning 12/10/10 Featured Price, Pivot Point has been adjusted).
>>> The latest Featured Stock Update with an annotated graph appeared on 12/3/2010. Click here.
View all notes |
Alert me of new notes |
CANSLIM.net Company Profile |
SEC |
Zacks Reports |
StockTalk |
News |
Chart |
Request a new note
C
A N
S L
I M


|
ARUN
-
NASDAQ
Aruba Networks Inc
COMPUTER HARDWARE - Networking andamp; Communication Dev
|
$25.68
|
+0.30
1.18% |
$25.86
|
2,490,013
100.47% of 50 DAV
50 DAV is 2,478,300
|
$25.96
-1.06%
|
1/3/2011
|
$22.55
|
PP = $24.38
|
|
MB = $25.60
|
Most Recent Note - 1/14/2011 5:04:35 PM
G - Color code is changed to green after rallying this week to new all-time highs and closing above its "max buy" level. Prior highs in the $23-24 area define initial support above its 50 DMA line.
>>> The latest Featured Stock Update with an annotated graph appeared on 12/14/2010. Click here.
View all notes |
Alert me of new notes |
CANSLIM.net Company Profile |
SEC |
Zacks Reports |
StockTalk |
News |
Chart |
Request a new note
C
A N
S L
I M
|
CACC
-
NASDAQ
Credit Acceptance Corp
FINANCIAL SERVICES - Credit Services
|
$58.37
|
-0.70
-1.19% |
$58.98
|
24,169
101.98% of 50 DAV
50 DAV is 23,700
|
$64.09
-8.92%
|
11/22/2010
|
$59.97
|
PP = $62.00
|
|
MB = $65.10
|
Most Recent Note - 1/12/2011 4:53:29 PM
G - Down today with slightly above average volume, a sign of mild distributional pressure while finishing at its lowest close since 11/19/10. Color code is changed to green after recent violation of prior lows and its 50 DMA line near $61 raised concerns.
>>> The latest Featured Stock Update with an annotated graph appeared on 12/20/2010. Click here.
View all notes |
Alert me of new notes |
CANSLIM.net Company Profile |
SEC |
Zacks Reports |
StockTalk |
News |
Chart |
Request a new note
C
A N
S L
I M
|
CIS
-
NYSE
Camelot Info Systems Ads
COMPUTER SOFTWARE andamp; SERVICES - Information Technology Service
|
$25.67
|
+0.10
0.39% |
$26.16
|
858,373
189.82% of 50 DAV
50 DAV is 452,200
|
$28.18
-8.91%
|
11/26/2010
|
$18.93
|
PP = $19.72
|
|
MB = $20.71
|
Most Recent Note - 1/14/2011 5:01:34 PM
G - Positive reversal today was an encouraging sign of support at prior highs near $25. Previously noted that initial support level following its recent rally from a choppy 5-week consolidation.
>>> The latest Featured Stock Update with an annotated graph appeared on 1/11/2011. Click here.
View all notes |
Alert me of new notes |
CANSLIM.net Company Profile |
SEC |
Zacks Reports |
StockTalk |
News |
Chart |
Request a new note
C
A N
S L
I M
|
DECK
-
NASDAQ
Deckers Outdoor Corp
CONSUMER NON-DURABLES - Textile - Apparel Footwear
|
$81.73
|
+1.29
1.60% |
$82.40
|
1,532,941
78.85% of 50 DAV
50 DAV is 1,944,100
|
$87.88
-7.00%
|
10/27/2010
|
$54.16
|
PP = $54.86
|
|
MB = $57.60
|
Most Recent Note - 1/14/2011 4:37:49 PM
G - Consolidating near its 10-week moving average line for the first time after its late-October technical breakout. It may be considered a valid secondary buy point from its current level on up to 5% above the prior high ($87.88 plus 5%), however there are concerns after the +24% earnings increase for the Sept quarter was a hair below the minimum guideline.
>>> The latest Featured Stock Update with an annotated graph appeared on 12/16/2010. Click here.
View all notes |
Alert me of new notes |
CANSLIM.net Company Profile |
SEC |
Zacks Reports |
StockTalk |
News |
Chart |
Request a new note
C
A N
S L
I M
|
Symbol/Exchange
Company Name
Industry Group |
PRICE |
CHANGE
(%Change) |
Day High |
Volume
(% DAV)
(% 50 day avg vol) |
52 Wk Hi
% From Hi |
Featured
Date |
Price
Featured |
Pivot Featured |
|
Max Buy |
EZCH
-
NASDAQ
Ezchip Semiconductor Ltd
ELECTRONICS - Semiconductor - Specialized
|
$32.10
|
+0.34
1.07% |
$32.24
|
338,097
125.87% of 50 DAV
50 DAV is 268,600
|
$32.25
-0.47%
|
12/2/2010
|
$27.53
|
PP = $26.00
|
|
MB = $27.30
|
Most Recent Note - 1/12/2011 4:47:20 PM
G - Inched higher for yet another new 52-week high with today's 3rd consecutive gain backed by near average volume. Prior chart highs in the $29 area define initial support to watch well above its 50 DMA line.
>>> The latest Featured Stock Update with an annotated graph appeared on 12/2/2010. Click here.
View all notes |
Alert me of new notes |
CANSLIM.net Company Profile |
SEC |
Zacks Reports |
StockTalk |
News |
Chart |
Request a new note
C
A N
S L
I M
|
EZPW
-
NASDAQ
Ezcorp Inc Cl A
SPECIALTY RETAIL - Specialty Retail, Other
|
$29.63
|
+1.07
3.75% |
$29.94
|
840,293
224.62% of 50 DAV
50 DAV is 374,100
|
$28.75
3.06%
|
11/5/2010
|
$24.02
|
PP = $23.85
|
|
MB = $25.04
|
Most Recent Note - 1/14/2011 12:58:31 PM
G - Rallying to a new all-time high today with volume running at an above average pace following a consolidation in a tight trading range for the past 4 weeks
>>> The latest Featured Stock Update with an annotated graph appeared on 12/29/2010. Click here.
View all notes |
Alert me of new notes |
CANSLIM.net Company Profile |
SEC |
Zacks Reports |
StockTalk |
News |
Chart |
Request a new note
C
A N
S L
I M
|
FFIV
-
NASDAQ
F 5 Networks Inc
INTERNET - Internet Software and Services
|
$144.17
|
+0.22
0.15% |
$145.00
|
1,771,733
72.93% of 50 DAV
50 DAV is 2,429,300
|
$145.76
-1.09%
|
1/13/2011
|
$145.71
|
PP = $143.85
|
|
MB = $151.04
|
Most Recent Note - 1/13/2011 1:49:32 PM
Y - Reaching a new 52-week and all-time high today without great volume conviction thus far on the session. Color code is changed to yellow with new pivot point cited based on its 12/13/10 high plus 10 cents after a short and orderly 5-week flat base. At least +40-50% above average volume is a requirement (preferably more) when a stock rises above its pivot point to trigger a proper technical buy signal.
>>> The latest Featured Stock Update with an annotated graph appeared on 12/28/2010. Click here.
View all notes |
Alert me of new notes |
CANSLIM.net Company Profile |
SEC |
Zacks Reports |
StockTalk |
News |
Chart |
Request a new note
C
A N
S L
I M
|
FOSL
-
NASDAQ
Fossil Inc
CONSUMER DURABLES - Recreational Goods, Other
|
$70.29
|
+1.01
1.46% |
$70.30
|
537,221
65.29% of 50 DAV
50 DAV is 822,800
|
$74.34
-5.45%
|
11/26/2010
|
$69.10
|
PP = $70.17
|
|
MB = $73.68
|
Most Recent Note - 1/12/2011 4:43:10 PM
G - Closed below its 50 DMA line in the middle of its intra-day range as a small loss on 2 times average volume raised more concerns. Color code was changed to green due to its recent deterioration and general lack of progress since its 12/02/10 breakout from a "3-weeks tight" pattern. Finished near an upward trendline connecting its July - October lows, and any further deterioration may trigger a more worrisome technical sell signal.
>>> The latest Featured Stock Update with an annotated graph appeared on 1/12/2011. Click here.
View all notes |
Alert me of new notes |
CANSLIM.net Company Profile |
SEC |
Zacks Reports |
StockTalk |
News |
Chart |
Request a new note
C
A N
S L
I M
|
HMSY
-
NASDAQ
H M S Holdings Corp
COMPUTER SOFTWARE and SERVICES - Healthcare Information Service
|
$66.66
|
+1.51
2.32% |
$66.66
|
250,062
159.58% of 50 DAV
50 DAV is 156,700
|
$67.10
-0.66%
|
11/19/2010
|
$61.89
|
PP = $63.01
|
|
MB = $66.16
|
Most Recent Note - 1/14/2011 4:57:47 PM
G - Rallied today with +59% above average volume for a new high close. It built a base-on-base type pattern and found support at its 50 DMA line, while its waning Relative Strength rank (now 68) has been noted as a concern.
>>> The latest Featured Stock Update with an annotated graph appeared on 1/3/2011. Click here.
View all notes |
Alert me of new notes |
CANSLIM.net Company Profile |
SEC |
Zacks Reports |
StockTalk |
News |
Chart |
Request a new note
C
A N
S L
I M
|
Symbol/Exchange
Company Name
Industry Group |
PRICE |
CHANGE
(%Change) |
Day High |
Volume
(% DAV)
(% 50 day avg vol) |
52 Wk Hi
% From Hi |
Featured
Date |
Price
Featured |
Pivot Featured |
|
Max Buy |
JOBS
-
NASDAQ
Fifty One Job Inc Ads
DIVERSIFIED SERVICES - Staffing and; Outsourcing Service
|
$57.93
|
+0.05
0.09% |
$58.54
|
105,303
61.26% of 50 DAV
50 DAV is 171,900
|
$60.00
-3.45%
|
10/13/2010
|
$42.07
|
PP = $40.60
|
|
MB = $42.63
|
Most Recent Note - 1/12/2011 4:32:45 PM
G - Paused today after 5 consecutive gains lifted it to new all-time highs. It had not formed a sound new base, only having recently consolidated for just 4 weeks after a considerable rally from below $20 in July.
>>> The latest Featured Stock Update with an annotated graph appeared on 12/30/2010. Click here.
View all notes |
Alert me of new notes |
CANSLIM.net Company Profile |
SEC |
Zacks Reports |
StockTalk |
News |
Chart |
Request a new note
C
A N
S L
I M
|
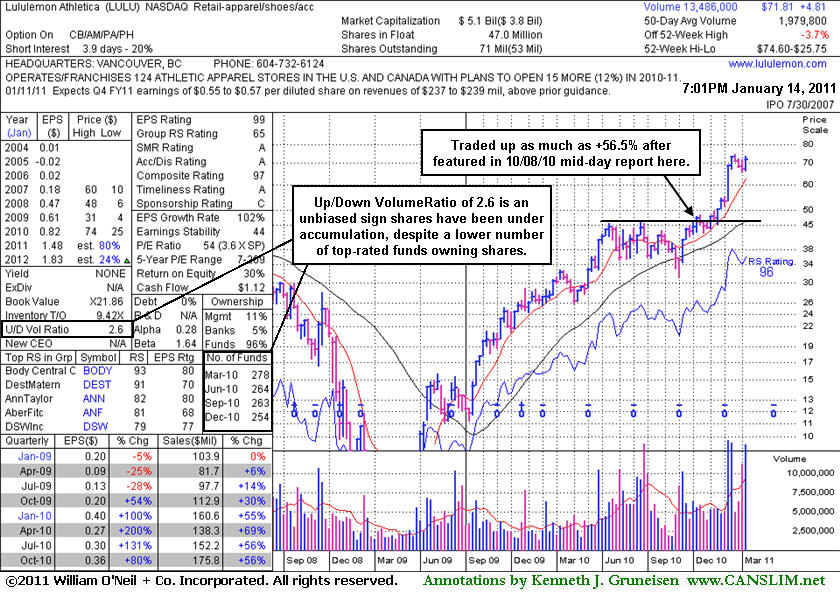
LULU
-
NASDAQ
Lululemon Athletica
MANUFACTURING - Textile Manufacturing
|
$71.81
|
+0.05
0.07% |
$72.58
|
1,289,573
66.28% of 50 DAV
50 DAV is 1,945,500
|
$74.60
-3.74%
|
10/8/2010
|
$47.66
|
PP = $46.67
|
|
MB = $49.00
|
Most Recent Note - 1/14/2011 5:18:30 PM
G - Perched -3.7% from its all-time high after a considerable gap up gain on 1/12/11 with more than 3 times average volume following encouraging guidance. It did not form a sound new base and it is extended from its 50 DMA line.
>>> The latest Featured Stock Update with an annotated graph appeared on 1/14/2011. Click here.
View all notes |
Alert me of new notes |
CANSLIM.net Company Profile |
SEC |
Zacks Reports |
StockTalk |
News |
Chart |
Request a new note
C
A N
S L
I M
|
MWIV
-
NASDAQ
M W I Veterinary Supply
HEALTH SERVICES - Medical Instruments and; Supplies
|
$65.93
|
+0.86
1.32% |
$66.42
|
61,765
120.40% of 50 DAV
50 DAV is 51,300
|
$67.13
-1.79%
|
11/4/2010
|
$61.79
|
PP = $59.60
|
|
MB = $62.58
|
Most Recent Note - 1/14/2011 5:12:15 PM
G - Perched near its all-time high after inching to new highs without great volume conviction. It has not formed a sound base pattern. Its 50 DMA line defines support to watch.
>>> The latest Featured Stock Update with an annotated graph appeared on 12/21/2010. Click here.
View all notes |
Alert me of new notes |
CANSLIM.net Company Profile |
SEC |
Zacks Reports |
StockTalk |
News |
Chart |
Request a new note
C
A N
S L
I M
|
NEOG
-
NASDAQ
Neogen Corp
DRUGS - Diagnostic Substances
|
$39.97
|
+0.71
1.81% |
$40.28
|
78,889
77.57% of 50 DAV
50 DAV is 101,700
|
$43.14
-7.35%
|
9/1/2010
|
$30.79
|
PP = $30.49
|
|
MB = $32.01
|
Most Recent Note - 1/12/2011 4:49:36 PM
G - Ended near the session low after better intra-day gains, closing with a 3rd consecutive small gain today with slightly above average volume. Its 50 DMA line has been a reliable support level during past consolidations.
>>> The latest Featured Stock Update with an annotated graph appeared on 12/6/2010. Click here.
View all notes |
Alert me of new notes |
CANSLIM.net Company Profile |
SEC |
Zacks Reports |
StockTalk |
News |
Chart |
Request a new note
C
A N
S L
I M
|
NFLX
-
NASDAQ
Netflix Inc
SPECIALTY RETAIL - Music and Video Stores
|
$191.48
|
-0.01
-0.01% |
$193.25
|
2,799,112
49.61% of 50 DAV
50 DAV is 5,642,100
|
$206.80
-7.41%
|
1/10/2011
|
$187.88
|
PP = $209.34
|
|
MB = $219.81
|
Most Recent Note - 1/13/2011 6:56:26 PM
Y - Second consecutive small gain today on light volume, rising from its 50 DMA line and recent lows defining near-term support. Color code was changed to yellow with new pivot point cited based on its 52-week high plus ten cents. See the latest FSU analysis for details and an annotated graph.
>>> The latest Featured Stock Update with an annotated graph appeared on 1/10/2011. Click here.
View all notes |
Alert me of new notes |
CANSLIM.net Company Profile |
SEC |
Zacks Reports |
StockTalk |
News |
Chart |
Request a new note
C
A N
S L
I M
|
Symbol/Exchange
Company Name
Industry Group |
PRICE |
CHANGE
(%Change) |
Day High |
Volume
(% DAV)
(% 50 day avg vol) |
52 Wk Hi
% From Hi |
Featured
Date |
Price
Featured |
Pivot Featured |
|
Max Buy |
NTAP
-
NASDAQ
Netapp Inc
COMPUTER HARDWARE - Data Storage Devices
|
$59.48
|
+0.86
1.47% |
$59.65
|
2,862,290
50.33% of 50 DAV
50 DAV is 5,686,500
|
$59.71
-0.39%
|
1/6/2011
|
$57.49
|
PP = $58.06
|
|
MB = $60.96
|
Most Recent Note - 1/14/2011 5:06:08 PM
Y - Posted small gains this week with below average volume, quietly inching above its pivot point for highs. Color code was changed to yellow with new pivot point cited based on its 11/10/10 high plus 10 cents. Gains with +50% above average volume, ideally even greater volume, are needed behind a gain above its pivot point to trigger a convincing technical buy signal.
>>> The latest Featured Stock Update with an annotated graph appeared on 12/27/2010. Click here.
View all notes |
Alert me of new notes |
CANSLIM.net Company Profile |
SEC |
Zacks Reports |
StockTalk |
News |
Chart |
Request a new note
C
A N
S L
I M
|
OPEN
-
NASDAQ
Opentable Inc
INTERNET - Internet Software and Services
|
$80.10
|
+0.36
0.45% |
$80.73
|
455,420
50.20% of 50 DAV
50 DAV is 907,300
|
$82.70
-3.14%
|
1/5/2011
|
$74.05
|
PP = $76.79
|
|
MB = $80.63
|
Most Recent Note - 1/14/2011 5:09:55 PM
Y - Hovering near its 52-week high, stubbornly holding its ground after a streak of volume-driven gains. Color code is changed to yellow after quietly consolidating just below its "max buy" level. Prior highs in the $76 area define initial support to watch above its 50 DMA line.
>>> The latest Featured Stock Update with an annotated graph appeared on 1/5/2011. Click here.
View all notes |
Alert me of new notes |
CANSLIM.net Company Profile |
SEC |
Zacks Reports |
StockTalk |
News |
Chart |
Request a new note
C
A N
S L
I M
|
ORCL
-
NASDAQ
Oracle Corp
COMPUTER SOFTWARE and SERVICES - Application Software
|
$31.25
|
+0.12
0.37% |
$31.34
|
37,934,042
135.33% of 50 DAV
50 DAV is 28,030,800
|
$32.27
-3.18%
|
12/7/2010
|
$29.05
|
PP = $29.92
|
|
MB = $31.42
|
Most Recent Note - 1/13/2011 12:59:58 PM
G - Still consolidating in a tight trading range near its 52-week high, stubbornly holding its ground for the past 4 weeks since its 12/17/10 gap up gain. Support to watch is at prior chart highs and its 50 DMA line just under the $30 level.
>>> The latest Featured Stock Update with an annotated graph appeared on 1/7/2011. Click here.
View all notes |
Alert me of new notes |
CANSLIM.net Company Profile |
SEC |
Zacks Reports |
StockTalk |
News |
Chart |
Request a new note
C
A N
S L
I M
|
PAY
-
NYSE
Verifone Systems Inc
COMPUTER HARDWARE - Transaction Automation Systems
|
$43.82
|
-0.44
-0.99% |
$44.67
|
1,490,240
98.68% of 50 DAV
50 DAV is 1,510,100
|
$44.87
-2.34%
|
11/29/2010
|
$33.96
|
PP = $36.04
|
|
MB = $37.84
|
Most Recent Note - 1/13/2011 6:50:54 PM
G - Up today with above average volume, hitting another new 52-week high. It is extended from any sound base. Recent lows in the $38 area along with its 50 DMA line define important near-term chart support to watch.
>>> The latest Featured Stock Update with an annotated graph appeared on 12/15/2010. Click here.
View all notes |
Alert me of new notes |
CANSLIM.net Company Profile |
SEC |
Zacks Reports |
StockTalk |
News |
Chart |
Request a new note
C
A N
S L
I M
|
PCLN
-
NASDAQ
Priceline.Com Inc
INTERNET - Internet Software and Services
|
$437.99
|
-1.52
-0.35% |
$439.48
|
789,943
75.02% of 50 DAV
50 DAV is 1,053,000
|
$443.19
-1.17%
|
11/1/2002
|
$399.55
|
PP = $428.20
|
|
MB = $449.61
|
Most Recent Note - 1/13/2011 6:51:58 PM
Y - Consolidating above prior highs in the $426-428 area that may now serve as initial support to watch following last week's technical breakout.
>>> The latest Featured Stock Update with an annotated graph appeared on 1/2/2011. Click here.
View all notes |
Alert me of new notes |
CANSLIM.net Company Profile |
SEC |
Zacks Reports |
StockTalk |
News |
Chart |
Request a new note
C
A N
S L
I M
|
Symbol/Exchange
Company Name
Industry Group |
PRICE |
CHANGE
(%Change) |
Day High |
Volume
(% DAV)
(% 50 day avg vol) |
52 Wk Hi
% From Hi |
Featured
Date |
Price
Featured |
Pivot Featured |
|
Max Buy |
RAX
-
NYSE
Rackspace Hosting Inc
INTERNET - Internet Software and; Services
|
$34.63
|
+0.84
2.49% |
$34.87
|
1,380,481
74.88% of 50 DAV
50 DAV is 1,843,500
|
$35.00
-1.06%
|
1/10/2011
|
$22.84
|
PP = $32.76
|
|
MB = $34.40
|
Most Recent Note - 1/14/2011 2:40:40 PM
Y - Gain today has it trading near its previously cited "max buy" level. It held its ground stubbornly after a gap up gain on 1/11/11 with above average volume triggered a new (or add-on) technical buy signal. No resistance remains due to overhead supply.
>>> The latest Featured Stock Update with an annotated graph appeared on 12/31/2010. Click here.
View all notes |
Alert me of new notes |
CANSLIM.net Company Profile |
SEC |
Zacks Reports |
StockTalk |
News |
Chart |
Request a new note
C
A N
S L
I M
|
ROVI
-
NASDAQ
Rovi Corp
COMPUTER SOFTWARE andamp; SERVICES - Security Software andamp; Services
|
$68.58
|
+1.44
2.14% |
$69.50
|
3,224,846
235.00% of 50 DAV
50 DAV is 1,372,300
|
$67.40
1.75%
|
10/29/2010
|
$49.99
|
PP = $53.10
|
|
MB = $55.76
|
Most Recent Note - 1/14/2011 1:36:00 PM
G - Considerable volume-driven gains this week for new highs followed a positive reversal on 1/10/11 after a big gap down which was noted as an impressive sign of support. It is extended from a sound base, yet unhindered by overhead supply, it may produce more climactic gains. The recent low near $58.50 and its 50 DMA line define chart support levels to watch.
>>> The latest Featured Stock Update with an annotated graph appeared on 12/13/2010. Click here.
View all notes |
Alert me of new notes |
CANSLIM.net Company Profile |
SEC |
Zacks Reports |
StockTalk |
News |
Chart |
Request a new note
C
A N
S L
I M
|
SHOO
-
NASDAQ
Steven Madden Limited
CONSUMER NON-DURABLES - Textile - Apparel Footwear
|
$42.08
|
+0.49
1.18% |
$42.15
|
332,644
85.03% of 50 DAV
50 DAV is 391,200
|
$47.69
-11.76%
|
11/23/2010
|
$44.61
|
PP = $44.95
|
|
MB = $47.20
|
Most Recent Note - 1/13/2011 6:49:24 PM
G - Slumped back toward support at prior highs near $40 with another loss today on above average volume. Its downward sloping 50 DMA line may now act as resistance.
>>> The latest Featured Stock Update with an annotated graph appeared on 1/4/2011. Click here.
View all notes |
Alert me of new notes |
CANSLIM.net Company Profile |
SEC |
Zacks Reports |
StockTalk |
News |
Chart |
Request a new note
C
A N
S L
I M
|
UA
-
NYSE
Under Armour Inc Cl A
CONSUMER NON-DURABLES - Textile - Apparel Clothing
|
$56.30
|
+0.83
1.50% |
$56.35
|
302,080
45.61% of 50 DAV
50 DAV is 662,300
|
$60.14
-6.39%
|
9/9/2010
|
$39.99
|
PP = $40.10
|
|
MB = $42.11
|
Most Recent Note - 1/14/2011 4:41:02 PM
G - Working on a possible new base after 6 weeks of consolidation, it rallied with below average volume this week while finding support near its 50 DMA line.
>>> The latest Featured Stock Update with an annotated graph appeared on 12/23/2010. Click here.
View all notes |
Alert me of new notes |
CANSLIM.net Company Profile |
SEC |
Zacks Reports |
StockTalk |
News |
Chart |
Request a new note
C
A N
S L
I M
|
ULTA
-
NASDAQ
Ulta Salon Cosm & Frag
SPECIALTY RETAIL - Specialty Retail, Other
|
$37.06
|
-0.06
-0.16% |
$37.49
|
577,427
103.11% of 50 DAV
50 DAV is 560,000
|
$38.25
-3.11%
|
1/6/2011
|
$36.12
|
PP = $37.34
|
|
MB = $39.21
|
Most Recent Note - 1/14/2011 5:07:51 PM
Y - Stubbornly holding its ground in a tight range since its 1/07/11 gain above the pivot point with 50% above average volume was just barely enough to trigger a new (or add-on) technical buy signal.
>>> The latest Featured Stock Update with an annotated graph appeared on 1/6/2011. Click here.
View all notes |
Alert me of new notes |
CANSLIM.net Company Profile |
SEC |
Zacks Reports |
StockTalk |
News |
Chart |
Request a new note
C
A N
S L
I M
|
Symbol/Exchange
Company Name
Industry Group |
PRICE |
CHANGE
(%Change) |
Day High |
Volume
(% DAV)
(% 50 day avg vol) |
52 Wk Hi
% From Hi |
Featured
Date |
Price
Featured |
Pivot Featured |
|
Max Buy |