You are not logged in.
This means you
CAN ONLY VIEW reports that were published prior to Monday, April 14, 2025.
You
MUST UPGRADE YOUR MEMBERSHIP if you want to see any current reports.
AFTER MARKET UPDATE - WEDNESDAY, JANUARY 13TH, 2010
Previous After Market Report Next After Market Report >>>
|
|
|
|
DOW |
+53.51 |
10,680.77 |
+0.50% |
|
Volume |
969,736,780 |
-12% |
|
Volume |
2,368,765,510 |
-3% |
|
NASDAQ |
+25.59 |
2,307.90 |
+1.12% |
|
Advancers |
2,236 |
71% |
|
Advancers |
1,836 |
65% |
|
S&P 500 |
+9.46 |
1,145.68 |
+0.83% |
|
Decliners |
800 |
25% |
|
Decliners |
876 |
31% |
|
Russell 2000 |
+8.06 |
643.56 |
+1.27% |
|
52 Wk Highs |
217 |
|
|
52 Wk Highs |
107 |
|
|
S&P 600 |
+3.87 |
340.99 |
+1.15% |
|
52 Wk Lows |
2 |
|
|
52 Wk Lows |
8 |
|
|
 |
Major Averages Halt Slide Amid Earnings Optimism
Adam Sarhan, Contributing Writer,
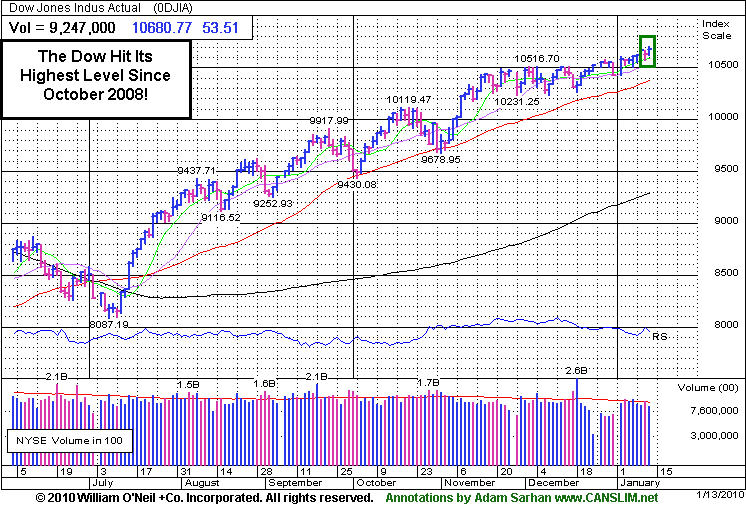
After a tough start to the week, stocks closed higher on Wednesday as earnings optimism and a slew of analyst upgrades helped offset the pessimism. Volume was reported slightly lower than the prior session's totals on the NYSE and on the Nasdaq exchange, which suggested large institutions were not aggressively buying stocks. Advancers led decliners by nearly a 3-to-1 ratio on the NYSE and by a 2-to-1 ratio on the Nasdaq exchange. There were 20 high-ranked companies from the CANSLIM.net Leaders List that made a new 52-week high and appeared on the CANSLIM.net BreakOuts Page, higher than the total of 12 issues that appeared on the prior session. New 52-week highs still solidly outnumbered new 52-week lows on the NYSE and on the Nasdaq exchange.
Stocks traded between positive and negative territory on Wednesday before the bulls showed up and sent stocks higher in the afternoon. Several of Wall Street's top bankers spent the morning testifying on Capital Hill about the 2007-2009 financial crisis. The bankers, whose companies collectively received more than $100 billion in government aid, spent hours explaining what happened during the crisis. The Financial Crisis Inquiry Commission was formed to examine and learn from what went wrong during that period.
In other news, Google Inc. (GOOG -0.57%) gapped down after the tech giant said it may exit China, the world’s largest Internet market, on censorship concerns. It rebounded to close at its 50-day moving average line after trading below that important short-term average for the first time since July 2009. Meanwhile, shares of Baidu Inc. (BIDU +13.71%) gapped up in response to the news, and it came within 5 cents of hitting a fresh all-time high while rising straight up from the bottom of a "double bottom" type base pattern.
At 2:00PM EST, the Federal Reserve released its Beige Book which showed the economy continues to recover in many regions in the country. The Fed said, "while economic activity remains at a low level, conditions have improved modestly further, and those improvements are broader geographically than in the last report." The Beige Book collects information from 12 District Fed Banks and will be used at the January 26-27 FOMC meeting.
Stocks slid on Monday and Tuesday, but the bulls showed up on Wednesday and quelled the bearish pressure. However, several leading stocks have sold off hard this week and negated their latest breakouts in many cases. The volatility reiterates the importance of remaining selective and disciplined as investors attempt to figure out how earnings season will unfold. It is important to note that the current 45-week rally remains intact as long as the major averages continue trading above their respective 50-day moving average (DMA) lines. Remember, that until those levels are breached, the bulls deserve the benefit of the doubt.
Professional Money Management Services - Free Portfolio Review- Inquire today!
A skilled team of portfolio managers that knows how to follow the rules of this fact-based investment system seeks to help improve your results in 2010, and we are pleased to assist you in taking the critical steps toward your brighter financial future. If you desire to have the expertise you have seen demonstrated by prior analysis here as the basis for your portfolio being actively managed now, click here to submit your inquiry. *Accounts over $250,000 please. ** Serious inquires only, please.
PICTURED: The Dow Jones Industrial Average posted a gain and hit its highest level since October 2008.
|
|
|
 |
Tech Sector Provides Leadership After Early Weakness
Kenneth J. Gruneisen - Passed the CAN SLIM® Master's Exam
After early weakness on Wednesday the tech sector helped provide leadership as the Semiconductor Index ($SOX +1.60%) erased an early loss and the Internet Index ($IIX +1.60%), Biotechnology Index ($BTK +1.41%), and Networking Index ($NWX +2.24%) each tallied gains. The Bank Index ($BKX +1.54%) outpaced the Broker/Dealer Index ($XBD +0.28%) as financial shares and the Retail Index ($RLX +0.68%) traded with a slightly positive bias. Defensive groups also finished in the black as the Healthcare Index ($HMO +0.93%), Gold & Silver Index ($XAU +1.14%), and Oil Services Index ($OSX +1.19%) posted gains.
Charts courtesy www.stockcharts.com
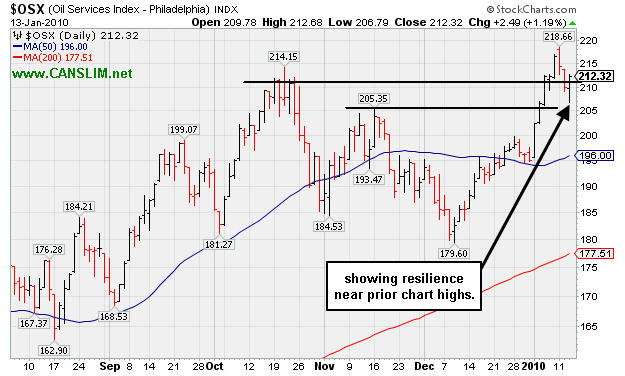
PICTURED: The Oil Services Index ($OSX +1.19%) recently attracted attention as it technically rallied above its October 2009 highs. Now its prior highs may be considered chart support levels to watch. Continued strength in the oil services index would obviously bode well for individual companies residing in the industry.
| Oil Services |
$OSX |
212.32 |
+2.49 |
+1.19% |
+8.93% |
| Healthcare |
$HMO |
1,530.91 |
+14.14 |
+0.93% |
+3.94% |
| Integrated Oil |
$XOI |
1,100.91 |
+1.75 |
+0.16% |
+3.06% |
| Semiconductor |
$SOX |
359.09 |
+5.64 |
+1.60% |
-0.23% |
| Networking |
$NWX |
240.15 |
+5.27 |
+2.24% |
+3.93% |
| Internet |
$IIX |
235.30 |
+3.71 |
+1.60% |
+0.62% |
| Broker/Dealer |
$XBD |
118.23 |
+0.33 |
+0.28% |
+2.76% |
| Retail |
$RLX |
411.38 |
+2.78 |
+0.68% |
+0.06% |
| Gold & Silver |
$XAU |
177.92 |
+2.00 |
+1.14% |
+5.75% |
| Bank |
$BKX |
46.94 |
+0.71 |
+1.54% |
+9.90% |
| Biotech |
$BTK |
986.81 |
+13.72 |
+1.41% |
+4.74% |
|
|
|
 |
Gains Leave Winner Extended From Latest Base
Kenneth J. Gruneisen - Passed the CAN SLIM® Master's Exam
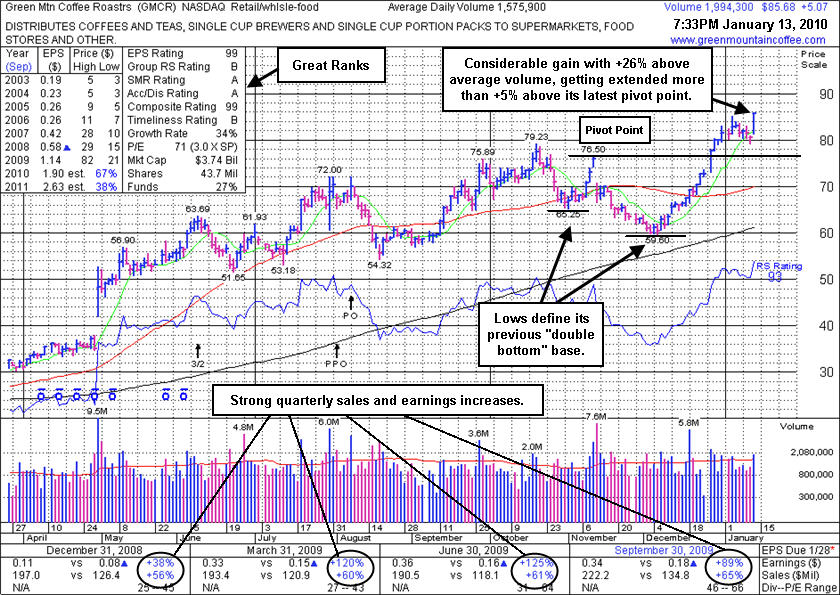
Green Mountain Coffee Roasters (GMCR +$5.07 or +6.29% to $85.68) gapped up today and tallied a considerable gain with just +26% above average volume as it rallied to a new all-time high well above its "max buy" level. It is clear of resistance due to overhead supply, a factor making it more likely to sprint higher, unhindered by resistance. Disciplined investors would avoid chasing it more than +5% above its latest pivot point. Meanwhile, losses should always be kept small by strictly selling any time any stock falls more than -7% from your buy price. Prior chart highs in the $76-77 area are important support levels to watch now.
GMCR has stayed well above prior chart highs while recently consolidating, and it has shown healthy action since its last appearance in this Featured Stock Update (FSU) section on 12/28/09 with an annotated graph under the headline "New High Close As Buying Demand Warms Up Again". That evening's report illustrated its gain above the pivot point of a 10-week "double bottom" type base with +62% above average volume confirming a new technical buy signal. GMCR had made a new appearance on 12/28/09 in yellow in the mid-day report (read here), returning the previously featured favorite to the Featured Stocks page at CANSLIM.net. Weak action had led it to be dropped from the Featured Stocks list on 12/01/09, but the repair of its prior 50-day moving average (DMA) line violation had improve its outlook. Do not be confused by the 3-for-2 split that occurred in the interim, as GMCR has traded up as much as +204% since appearing with an annotated graph under the headline "It May Soon Be Time To Go Green" when featured in the January 2009 CANSLIM.net News (read here).
|
|
|
Color Codes Explained :
Y - Better candidates highlighted by our
staff of experts.
G - Previously featured
in past reports as yellow but may no longer be buyable under the
guidelines.
***Last / Change / Volume quote data in this table corresponds with the timestamp on the note***
Symbol/Exchange
Company Name
Industry Group |
Last |
Chg. |
Vol
% DAV |
Date Featured |
Price Featured |
Latest Pivot Point
Featured |
Status |
| Latest Max Buy Price |
ARST
-
|
$25.83
|
-0.55
|
1,297,403
265% DAV
489,800
|
12/22/2009
(Date
Featured) |
$25.94
(Price
Featured) |
PP = $27.20 |
G |
| MB = $28.56 |
Most Recent Note - 1/13/2010 5:23:04 PM
G - Rebounded to a close above its 50 DMA line today, a sign it was attracting support near that important short-term average after a bout of worrisome distributional pressure. On 1/12/10 its considerable loss undercut its pivot point and fully negated is latest breakout while closing the session under its November 2009 high close. ARST was first featured in yellow at $19.91 in the 9/01/09 mid-day report with an annotated daily graph (read here).
>>> The latest Featured Stock Update with an annotated graph appeared on 1/4/2010. click here.
|
|
C
A
S
I |
News |
Chart |
SEC
View all notes Alert
me of new notes
Company
Profile
|
ASIA
-
|
$28.20
|
-0.54
|
1,018,539
81% DAV
1,252,400
|
12/24/2009
(Date
Featured) |
$31.05
(Price
Featured) |
PP = $32.40 |
G |
| MB = $34.02 |
Most Recent Note - 1/13/2010 5:39:17 PM
G - Today was its 3rd consecutive loss on light volume as it continues consolidating near its 50 DMA line (now $27.65) which is the next important support level to watch. A technical buy signal did not occur since its advanced "3 weeks tight" pattern was recently noted. Traded up as much as +68.13% since first featured in the August 2009 CANSLIM.net News (read here).
>>> The latest Featured Stock Update with an annotated graph appeared on 1/12/2010. click here.
|
|
C
A
S
I |
News |
Chart |
SEC
View all notes Alert
me of new notes
Company
Profile
|
CAAS
- NASDAQ
China Automotive Systems
AUTOMOTIVE - Auto Parts
|
$24.40
|
-0.29
|
1,961,977
198% DAV
993,400
|
11/30/2009
(Date
Featured) |
$18.84
(Price
Featured) |
PP = $17.62 |
G |
| MB = $18.50 |
Most Recent Note - 1/13/2010 5:50:12 PM
G - Closed in the upper half of its intra-day trading range today after a big early loss. Distributional pressure led to a test of prior chart highs in the $22 area - an important near-term technical support level to watch. CAAS was $18.84 when first featured in the 11/30/09 mid-day report (read here).
>>> The latest Featured Stock Update with an annotated graph appeared on 12/29/2009. click here.
|
|
C
A
S
I |
News |
Chart |
SEC
View all notes Alert
me of new notes
Company
Profile
|
CACC
- NASDAQ
Credit Acceptance Corp
FINANCIAL SERVICES - Credit Services
|
$46.88
|
-1.32
|
71,614
159% DAV
45,000
|
9/29/2009
(Date
Featured) |
$33.48
(Price
Featured) |
PP = $37.10 |
G |
| MB = $38.96 |
Most Recent Note - 1/13/2010 5:52:18 PM
G - Loss today on higher volume was a sign of distribution after considerable gains. Previous chart high and 50 DMA line coincide in the $37 area, defining an important support level to watch. It was featured on 9/29/09 in yellow in the mid-day report (read here).
>>> The latest Featured Stock Update with an annotated graph appeared on 1/8/2010. click here.
|
|
C
A
S
I |
News |
Chart |
SEC
View all notes Alert
me of new notes
Company
Profile
|
CRM
- NYSE
Salesforce.com Inc
INTERNET - Internet Software & Services
|
$68.50
|
+0.21
|
5,162,386
289% DAV
1,784,600
|
12/18/2009
(Date
Featured) |
$67.32
(Price
Featured) |
PP = $67.82 |
G |
| MB = $71.21 |
Most Recent Note - 1/13/2010 5:54:47 PM
G - Positive reversal today was a sign of support near prior chart highs and its 50 DMA line in the $67 area previously noted as "an important support level to watch on pullbacks." The old resistance level and its 50 DMA line define some classic support levels watched by technical analysts. Large gaps are indicative of institutional activity (I criteria) and, in this case, clearly distributional pressure.
>>> The latest Featured Stock Update with an annotated graph appeared on 1/6/2010. click here.
|
|
C
A
S
I |
News |
Chart |
SEC
View all notes Alert
me of new notes
Company
Profile
|
CTRP
- NASDAQ
Ctrip.com Intl Ltd Adr
LEISURE - Resorts & Casinos
|
$70.17
|
-0.63
|
1,429,556
134% DAV
1,067,000
|
12/1/2009
(Date
Featured) |
$75.38
(Price
Featured) |
PP = $73.91 |
G |
| MB = $77.61 |
Most Recent Note - 1/13/2010 6:08:25 PM
G - Loss today on higher volume led to a close below its 50 DMA line, raising more concerns as distributional pressure weighs on it and many China-based companies. Color code is changed to green and it would need to rally back above its recent chart high ($77) for its outlook to improve. Featured on 12/01/09 in yellow in the mid-day report (read here).
>>> The latest Featured Stock Update with an annotated graph appeared on 12/30/2009. click here.
|
|
C
A
S
I |
News |
Chart |
SEC
View all notes Alert
me of new notes
Company
Profile
|
GMCR
- NASDAQ
Green Mtn Coffee Roastrs
FOOD & BEVERAGE - Processed & Packaged Goods
|
$85.68
|
+5.07
|
1,998,305
127% DAV
1,575,900
|
12/28/2009
(Date
Featured) |
$77.49
(Price
Featured) |
PP = $76.50 |
G |
| MB = $80.33 |
Most Recent Note - 1/13/2010 6:12:48 PM
G - Gapped up today and tallied a considerable gain with +26% above average volume as it rallied to a new all-time high well above its "max buy" level. Prior chart highs in the $76-77 area are important support levels to watch now.
>>> The latest Featured Stock Update with an annotated graph appeared on 1/13/2010. click here.
|
|
C
A
S
I |
News |
Chart |
SEC
View all notes Alert
me of new notes
Company
Profile
|
HEAT
-
|
$16.63
|
-0.31
|
1,600,559
140% DAV
1,139,300
|
1/6/2010
(Date
Featured) |
$17.19
(Price
Featured) |
PP = $17.27 |
G |
| MB = $18.13 |
Most Recent Note - 1/13/2010 6:21:56 PM
G - Closed near the session high for a small loss today with above average volume. A close below its 12/15/09 close ($16.59) would be a more worrisome technical sign of damaging distributional pressure, while recent chart lows near $14 define the next important support level. HEAT traded as much as +55.0% higher in the 8-week period since it was first featured in yellow in the 11/17/09 mid-day report (read here) when technically rising from a "double bottom" base, reaching a new all-time high.
>>> The latest Featured Stock Update with an annotated graph appeared on 12/31/2009. click here.
|
|
C
A
S
I |
News |
Chart |
SEC
View all notes Alert
me of new notes
Company
Profile
|
LFT
-
|
$36.90
|
-3.55
|
494,653
122% DAV
405,200
|
11/17/2009
(Date
Featured) |
$31.77
(Price
Featured) |
PP = $33.04 |
G |
| MB = $34.69 |
Most Recent Note - 1/13/2010
G - Big early loss today with above average volume indicates more worrisome distributional pressure. Its 50 DMA line near $35 has been previously noted as an initial support level to watch on pullbacks. Its fundamentals remain strong.
>>> The latest Featured Stock Update with an annotated graph appeared on 1/5/2010. click here.
|
|
C
A
S
I |
News |
Chart |
SEC
View all notes Alert
me of new notes
Company
Profile
|
PEGA
- NASDAQ
Pegasystems Inc
COMPUTER SOFTWARE & SERVICES - Business Software & Services
|
$35.25
|
+0.75
|
195,659
86% DAV
226,500
|
1/4/2010
(Date
Featured) |
$34.00
(Price
Featured) |
PP = $36.19 |
Y |
| MB = $38.00 |
Most Recent Note - 1/13/2010 6:31:27 PM
Y - Gain today on near average volume for its second highest close ever. No resistance remains due to overhead supply. Featured in the January 2010 issue of CANSLIM.net News (read here).
>>> The latest Featured Stock Update with an annotated graph appeared on 1/3/2010. click here.
|
|
C
A
S
I |
News |
Chart |
SEC
View all notes Alert
me of new notes
Company
Profile
|
VIT
-
|
$20.14
|
-0.36
|
1,180,135
216% DAV
547,000
|
12/24/2009
(Date
Featured) |
$20.07
(Price
Featured) |
PP = $21.17 |
Y |
| MB = $22.23 |
Most Recent Note - 1/13/2010 6:39:03 PM
Y - Closed in the upper half of today's intra-day range, however distributional pressure in the past week has raised concerns. It abruptly reversed under its pivot point following its big 1/06/10 gain on heavy volume and 1/11/10 gain on +36% above average volume. Featured in yellow in the 12/24/09 mid-day report (read here).
>>> The latest Featured Stock Update with an annotated graph appeared on 1/11/2010. click here.
|
|
C
A
S
I |
News |
Chart |
SEC
View all notes Alert
me of new notes
Company
Profile
|
|
|
|
THESE ARE NOT BUY RECOMMENDATIONS!
Comments contained in the body of this report are technical
opinions only. The material herein has been obtained
from sources believed to be reliable and accurate, however,
its accuracy and completeness cannot be guaranteed.
This site is not an investment advisor, hence it does
not endorse or recommend any securities or other investments.
Any recommendation contained in this report may not
be suitable for all investors and it is not to be deemed
an offer or solicitation on our part with respect to
the purchase or sale of any securities. All trademarks,
service marks and trade names appearing in this report
are the property of their respective owners, and are
likewise used for identification purposes only.
This report is a service available
only to active Paid Premium Members.
You may opt-out of receiving report notifications
at any time. Questions or comments may be submitted
by writing to Premium Membership Services 665 S.E. 10 Street, Suite 201 Deerfield Beach, FL 33441-5634 or by calling 1-800-965-8307
or 954-785-1121.
|
|
|


