You are not logged in.
This means you
CAN ONLY VIEW reports that were published prior to Thursday, April 10, 2025.
You
MUST UPGRADE YOUR MEMBERSHIP if you want to see any current reports.
AFTER MARKET UPDATE - TUESDAY, JANUARY 12TH, 2010
Previous After Market Report Next After Market Report >>>
|
|
|
|
DOW |
-36.73 |
10,627.26 |
-0.34% |
|
Volume |
1,096,941,380 |
+13% |
|
Volume |
2,440,436,910 |
+15% |
|
NASDAQ |
-30.10 |
2,282.31 |
-1.30% |
|
Advancers |
856 |
27% |
|
Advancers |
769 |
27% |
|
S&P 500 |
-10.76 |
1,136.22 |
-0.94% |
|
Decliners |
2,185 |
70% |
|
Decliners |
1,944 |
68% |
|
Russell 2000 |
-8.49 |
635.50 |
-1.32% |
|
52 Wk Highs |
187 |
|
|
52 Wk Highs |
83 |
|
|
S&P 600 |
-3.87 |
337.12 |
-1.13% |
|
52 Wk Lows |
1 |
|
|
52 Wk Lows |
6 |
|
|
 |
Distributional Pressure Takes Toll As Earnings Season Begins
Adam Sarhan, Contributing Writer,
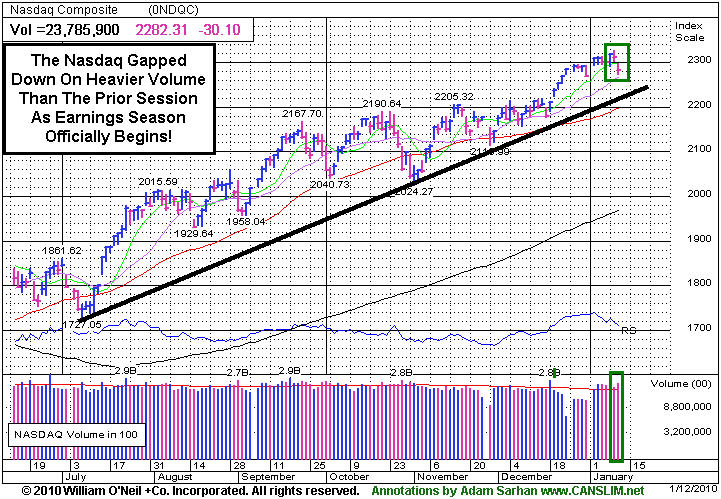
The major averages collectively fell for the first time this year after a disappointing start to earnings season. Volume, an important indicator of institutional sponsorship, was reported higher than Monday's totals on the NYSE and on the Nasdaq exchange, which marked a distribution day and suggested large institutions were more aggressively selling stocks. Decliners led advancers by nearly a 3-to-1 ratio on the NYSE and Nasdaq exchange. There were only 12 high-ranked companies from the CANSLIM.net Leaders List that made a new 52-week high and appeared on the CANSLIM.net BreakOuts Page, considerably lower than the total of 55 issues that appeared on the prior session. New 52-week highs still solidly outnumbered new 52-week lows on the NYSE and on the Nasdaq exchange, and new 52-week lows reported were in the single digits.
Stocks slid across the globe while concern spread that the economic recovery may slow down as governments begin to withdraw their massive stimulus plans. Overnight, China raised its reserve limits for banks, a move which is designed to curb their explosive economic growth. Since the March bottom China has played a pivotal role in leading the global economy out of the worst recession since WWII. China has emerged as a strong economic engine for growth. The threat of an economic slowdown in China spooks many investors.
Over the next few weeks, earnings news will likely set the tone for the near-term action in the major averages. Analysts believe that combined profit for the average company in the benchmark S&P 500 Index surged +62% during the fourth quarter. If that occurs that will snap the longest earnings losing streak in history, and it would be the first quarterly increase in corporate earnings since 2007. Remember, that it is extremely important to digest each individual company's results, and it is equally or more important to see how each company reacts to its earnings.
On Monday, we penned, "After three strong weeks of gains, the market appears to be showing signs that a near-term pullback might be in the cards. A slew of stocks negatively reversed (opened higher and closed lower) on Monday, which suggests a change in trend may unfold." Therefore, Tuesday's pullback was somewhat expected as the major averages (and leading stocks) pause to consolidate their recent gains. Is the rally over? No, but all we have to do is be cognizant of the fact that a near-term pullback may occur and then trade accordingly. The current 45-week rally remains intact as long as the major averages continue trading above their respective 50-day moving average (DMA) lines. Until those levels are breached, the bulls deserve the benefit of the doubt.
Professional Money Management Services - A Winning System - Inquire today!
A skilled team of portfolio managers that knows how to follow the rules of this fact-based investment system seeks to help improve your results in 2010, and we are pleased to assist you in taking the critical steps toward your brighter financial future. If you desire to have the expertise you have seen demonstrated by prior analysis here as the basis for your portfolio being actively managed now, click here to submit your inquiry. *Accounts over $250,000 please. ** Serious inquires only, please.
PICTURED: The Nasdaq Composite Index gapped down for a loss on heavier volume than the prior session as earnings season officially began.
|
|
|
 |
Defensive Groups Fell Hard Amid Unanimous Losses
Kenneth J. Gruneisen - Passed the CAN SLIM® Master's Exam
Defensive areas took some of the hardest hits on Tuesday as the Gold & Silver Index ($XAU -3.67%), Healthcare Index ($HMO -2.71%), Oil Services Index ($OSX -2.16%), and Integrated Oil Index ($XOI -2.04%) were among the session's biggest percentage decliners. In the technology sector, Semiconductor Index ($SOX -3.59%) suffered a considerable loss, followed by the Internet Index ($IIX -1.61%) and the Networking Index ($NWX -1.30%). Weak action in the Bank Index ($XBD -1.70%), Broker/Dealer Index ($XBD -1.25%) and the Retail Index ($RLX -1.22%) also dragged the major averages lower.
Charts courtesy www.stockcharts.com
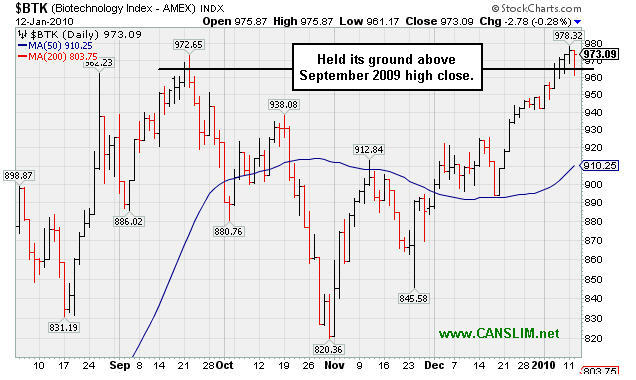
PICTURED: The Biotechnology Index ($BTK -0.28%) held its ground above its September 2009 high close. Considering the extent of most other groups' losses, the did an admirable job of holding its ground.
| Oil Services |
$OSX |
209.83 |
-4.63 |
-2.16% |
+7.65% |
| Healthcare |
$HMO |
1,516.77 |
-42.19 |
-2.71% |
+2.98% |
| Integrated Oil |
$XOI |
1,099.16 |
-22.87 |
-2.04% |
+2.90% |
| Semiconductor |
$SOX |
353.45 |
-13.17 |
-3.59% |
-1.79% |
| Networking |
$NWX |
234.88 |
-3.09 |
-1.30% |
+1.65% |
| Internet |
$IIX |
231.59 |
-3.80 |
-1.61% |
-0.97% |
| Broker/Dealer |
$XBD |
117.90 |
-1.49 |
-1.25% |
+2.48% |
| Retail |
$RLX |
408.60 |
-5.04 |
-1.22% |
-0.61% |
| Gold & Silver |
$XAU |
175.92 |
-6.70 |
-3.67% |
+4.56% |
| Bank |
$BKX |
46.23 |
-0.80 |
-1.70% |
+8.24% |
| Biotech |
$BTK |
973.09 |
-2.78 |
-0.28% |
+3.29% |
|
|
|
 |
Recent Distributional Action Prompts Caution
Kenneth J. Gruneisen - Passed the CAN SLIM® Master's Exam
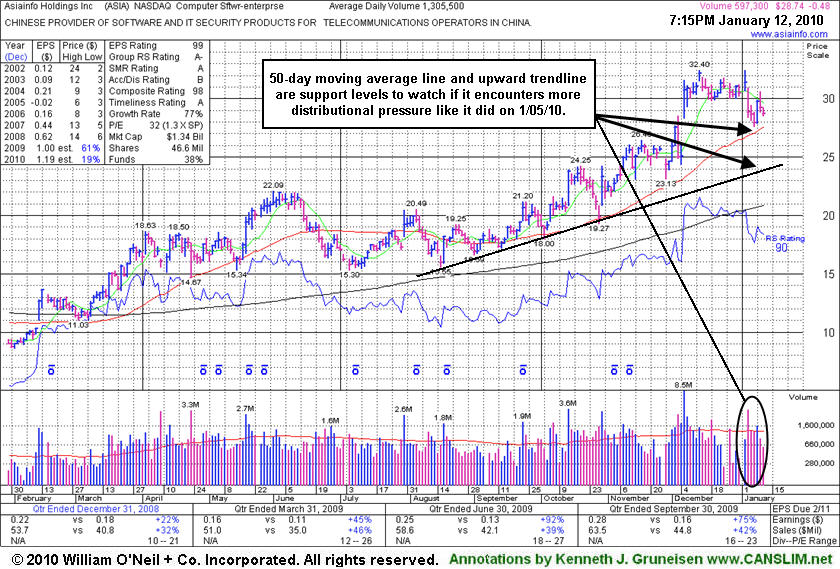
AsiaInfo Holdings, Inc. (ASIA -$0.48 or -1.64% to $28.74) closed with a small loss today on light volume, quietly consolidating above its 50-day moving average (DMA) line (now $27.52) which is the next important support level to watch. A technical buy signal did not occur since an advanced "3 weeks tight" pattern was recently noted. Time is still needed, and a subsequent breakout with heavy volume could confirm a new technical buy signal. But caution is important now, since its large loss on heavy volume on 1/05/10 was a worrisome sign of distributional pressure (previously noted). Meanwhile, its 50 DMA line and prior chart highs in the $26 area are an important support level to watch on pullbacks. An upward trendline defines another support level, but that is well below its current price or earlier support where violations might trigger technical sell signals.
ASIA was featured 10/14/09 in the mid-day report (read here) as it gapped up for a new 52-week high with 5 times average volume, triggering a technical buy signal by blasting above its pivot point. It has traded up as much as +68.13% since first featured in the August 2009 CANSLIM.net News (read here).
|
|
|
Color Codes Explained :
Y - Better candidates highlighted by our
staff of experts.
G - Previously featured
in past reports as yellow but may no longer be buyable under the
guidelines.
***Last / Change / Volume quote data in this table corresponds with the timestamp on the note***
Symbol/Exchange
Company Name
Industry Group |
Last |
Chg. |
Vol
% DAV |
Date Featured |
Price Featured |
Latest Pivot Point
Featured |
Status |
| Latest Max Buy Price |
ARST
-
|
$26.38
|
-2.19
|
912,301
189% DAV
482,500
|
9/1/2009
(Date
Featured) |
$19.91
(Price
Featured) |
PP = $27.20 |
G |
| MB = $28.56 |
Most Recent Note - 1/12/2010 6:26:26 PM
G - Considerable loss today on nearly 2 times average volume raised concerns as it undercut its pivot point and negated is latest breakout while closing the session under its November 2009 high close. The considerable gain on 1/04/10 had triggered a technical buy signal as it blasted above its pivot point with volume more than 3 times average. ARST was first featured in yellow at $19.91 in the 9/01/09 mid-day report with an annotated daily graph (read here).
>>> The latest Featured Stock Update with an annotated graph appeared on 1/4/2010. click here.
|
|
C
A
S
I |
News |
Chart |
SEC
View all notes Alert
me of new notes
Company
Profile
|
ASIA
-
|
$28.74
|
-0.48
|
600,293
46% DAV
1,305,500
|
12/24/2009
(Date
Featured) |
$31.05
(Price
Featured) |
PP = $32.40 |
G |
| MB = $34.02 |
Most Recent Note - 1/12/2010 6:29:08 PM
G - Small loss today came on light volume, quietly consolidating above its 50 DMA line (now $27.52) which is the next important support level to watch. A technical buy signal did not occur since its advanced "3 weeks tight" pattern was recently noted. Traded up as much as +68.13% since first featured in the August 2009 CANSLIM.net News (read here).
>>> The latest Featured Stock Update with an annotated graph appeared on 1/12/2010. click here.
|
|
C
A
S
I |
News |
Chart |
SEC
View all notes Alert
me of new notes
Company
Profile
|
BIDU
- NASDAQ
Baidu Inc Ads
INTERNET - Internet Information Providers
|
$386.49
|
-14.08
|
2,985,397
207% DAV
1,443,900
|
9/8/2009
(Date
Featured) |
$351.80
(Price
Featured) |
PP = $440.00 |
G |
| MB = $462.00 |
Most Recent Note - 1/12/2010 6:38:22 PM
G - Gapped down today and suffered a considerable loss on higher volume near twice its average daily total while violating its recent chart low ($394.56 on 12/22/09), raising more serious concerns and triggering a technical sell signal. Gains above its 12/29/09 high ($426.75) could complete a bullish "double bottom" pattern at some future time, however, based on current weakness it will be dropped from the Featured Stocks list tonight. BIDU traded up as much as +23% from its price when featured in yellow in the 9/08/09 Mid-Day BreakOuts Report (read here).
>>> The latest Featured Stock Update with an annotated graph appeared on 1/7/2010. click here.
|
|
C
A
S
I |
News |
Chart |
SEC
View all notes Alert
me of new notes
Company
Profile
|
CAAS
- NASDAQ
China Automotive Systems
AUTOMOTIVE - Auto Parts
|
$24.69
|
-1.66
|
1,704,856
177% DAV
963,200
|
11/30/2009
(Date
Featured) |
$18.84
(Price
Featured) |
PP = $17.62 |
G |
| MB = $18.50 |
Most Recent Note - 1/12/2010 6:42:41 PM
G - Gapped down today, erasing most of the prior session's gain. The recent action has the look of a "climax run" and CAAS has been noted numerous times already in 2010 - "Volume was more than 4 times average behind its considerable 1/05/10 gain for a new high. The choppy consolidation over the prior 5 weeks involved a -28% pullback, so this was not a sound "flat base" of the minimum length. However, no overhead supply remains and it could go on to produce a "climax run", especially considering its small float of only 4.86 million shares (S criteria). It found prompt support following a sharp pullback to its short-term average line." It was $18.84 when first featured in the 11/30/09 mid-day report (read here).
>>> The latest Featured Stock Update with an annotated graph appeared on 12/29/2009. click here.
|
|
C
A
S
I |
News |
Chart |
SEC
View all notes Alert
me of new notes
Company
Profile
|
CACC
- NASDAQ
Credit Acceptance Corp
FINANCIAL SERVICES - Credit Services
|
$48.20
|
+0.24
|
50,816
114% DAV
44,600
|
9/29/2009
(Date
Featured) |
$33.48
(Price
Featured) |
PP = $37.10 |
G |
| MB = $38.96 |
Most Recent Note - 1/12/2010 6:44:09 PM
G - Added a small gain today, bucking a widely negative market. On 1/11/10 it traded almost 3 times average volume while tallying a considerable gain and hitting a new all-time high. Previous chart high and 50 DMA line coincide in the $37 area, defining an important support level to watch. The Finance - Consumer/Commercial Loans firm has maintained a great track record of annual and quarterly sales revenues and earnings increases. It was featured on 9/29/09 in yellow in the mid-day report (read here).
>>> The latest Featured Stock Update with an annotated graph appeared on 1/8/2010. click here.
|
|
C
A
S
I |
News |
Chart |
SEC
View all notes Alert
me of new notes
Company
Profile
|
CRM
- NYSE
Salesforce.com Inc
INTERNET - Internet Software & Services
|
$68.29
|
-5.36
|
5,263,262
308% DAV
1,706,100
|
12/18/2009
(Date
Featured) |
$67.32
(Price
Featured) |
PP = $67.82 |
G |
| MB = $71.21 |
Most Recent Note - 1/12/2010 6:46:32 PM
G - Gapped down today and suffered a considerable loss on about 3 times average volume after an analyst downgrade, falling near prior chart highs in the $67 area which were previously noted as "an important support level to watch on pullbacks." The old resistance level and its 50 DMA line define some classic support levels watched by technical analysts. Large gaps are indicative of institutional activity (I criteria) and, in this case, clearly distributional pressure.
>>> The latest Featured Stock Update with an annotated graph appeared on 1/6/2010. click here.
|
|
C
A
S
I |
News |
Chart |
SEC
View all notes Alert
me of new notes
Company
Profile
|
CTRP
- NASDAQ
Ctrip.com Intl Ltd Adr
LEISURE - Resorts & Casinos
|
$70.80
|
-2.84
|
1,035,849
96% DAV
1,079,200
|
12/1/2009
(Date
Featured) |
$75.38
(Price
Featured) |
PP = $73.91 |
Y |
| MB = $77.61 |
Most Recent Note - 1/12/2010 6:53:44 PM
Y - Loss today on average volume led to a close under its 12/22/09 low close ($70.89) while staying just above its 50 DMA line. Consolidating in an orderly fashion for about 6 weeks. Featured on 12/01/09 in yellow in the mid-day report (read here).
>>> The latest Featured Stock Update with an annotated graph appeared on 12/30/2009. click here.
|
|
C
A
S
I |
News |
Chart |
SEC
View all notes Alert
me of new notes
Company
Profile
|
GMCR
- NASDAQ
Green Mtn Coffee Roastrs
FOOD & BEVERAGE - Processed & Packaged Goods
|
$80.61
|
-0.82
|
1,142,506
73% DAV
1,573,700
|
12/28/2009
(Date
Featured) |
$77.49
(Price
Featured) |
PP = $76.50 |
G |
| MB = $80.33 |
Most Recent Note - 1/12/2010 6:55:22 PM
G - Volume is drying up while consolidating near all-time highs just above its "max buy" level. Prior chart highs in the $76-77 area are important support levels to watch now.
>>> The latest Featured Stock Update with an annotated graph appeared on 12/28/2009. click here.
|
|
C
A
S
I |
News |
Chart |
SEC
View all notes Alert
me of new notes
Company
Profile
|
HEAT
-
|
$16.94
|
-1.09
|
1,339,701
120% DAV
1,118,200
|
1/6/2010
(Date
Featured) |
$17.19
(Price
Featured) |
PP = $17.27 |
Y |
| MB = $18.13 |
Most Recent Note - 1/12/2010 6:58:51 PM
Y - Today's loss led to a close back under its latest pivot point, raising some concerns immediately after its 1/11/10 gain from a short "ascending base" type pattern had triggered a new technical buy signal. Recent chart lows near $14 define an important support level now. HEAT traded as much as +55.0% higher in the 8-week period since it was first featured in yellow in the 11/17/09 mid-day report (read here) when technically rising from a "double bottom" base, reaching a new all-time high.
>>> The latest Featured Stock Update with an annotated graph appeared on 12/31/2009. click here.
|
|
C
A
S
I |
News |
Chart |
SEC
View all notes Alert
me of new notes
Company
Profile
|
LFT
-
|
$40.45
|
-0.49
|
257,239
63% DAV
407,400
|
11/17/2009
(Date
Featured) |
$31.77
(Price
Featured) |
PP = $33.04 |
G |
| MB = $34.69 |
Most Recent Note - 1/12/2010 7:04:24 PM
G - Gapped down today for a small loss with lighter volume, pulling back from the all-time high set on the prior session. Recent action was described by some as a "3 weeks tight" pattern, however it is considerably extended from the choppy 14-week base previously noted here. Its 50 DMA line is an initial support level to watch on pullbacks. A proposed offering of additional shares on 11/16/09 seems well received by the market. Its fundamentals remain strong.
>>> The latest Featured Stock Update with an annotated graph appeared on 1/5/2010. click here.
|
|
C
A
S
I |
News |
Chart |
SEC
View all notes Alert
me of new notes
Company
Profile
|
PEGA
- NASDAQ
Pegasystems Inc
COMPUTER SOFTWARE & SERVICES - Business Software & Services
|
$34.50
|
-0.04
|
192,429
83% DAV
232,300
|
1/4/2010
(Date
Featured) |
$34.00
(Price
Featured) |
PP = $36.19 |
Y |
| MB = $38.00 |
Most Recent Note - 1/12/2010 7:06:30 PM
Y - Held its ground well amid today's negative session. Its 1/11/10 gain was marked by higher volume than any up session since its 12/14/09 rally above its 50 DMA line. Color code was changed to yellow based on improvement, yet it may continue basing for a longer period. Gains above prior highs in the $36 area with heavier volume would be a bullish technical buy signal. Returned to the Featured Stocks page again with its fresh appearance in the January 2010 issue of CANSLIM.net News (read here).
>>> The latest Featured Stock Update with an annotated graph appeared on 1/3/2010. click here.
|
|
C
A
S
I |
News |
Chart |
SEC
View all notes Alert
me of new notes
Company
Profile
|
VIT
-
|
$20.50
|
-1.26
|
1,050,753
195% DAV
539,000
|
12/24/2009
(Date
Featured) |
$20.07
(Price
Featured) |
PP = $21.17 |
Y |
| MB = $22.23 |
Most Recent Note - 1/12/2010 7:09:49 PM
Y - Considerable loss today on higher volume promptly erased the prior session's gain leading to another close back below its pivot point, a sign of additional distributional pressure that raised concerns. Featured in yellow in the 12/24/09 mid-day report (read here). No overhead supply exists to act as resistance. Fundamentally, this high-ranked Computer - Tech Services firm's earnings and sales revenues increases have been above or at the +25% minimum guideline.
>>> The latest Featured Stock Update with an annotated graph appeared on 1/11/2010. click here.
|
|
C
A
S
I |
News |
Chart |
SEC
View all notes Alert
me of new notes
Company
Profile
|
|
|
|
THESE ARE NOT BUY RECOMMENDATIONS!
Comments contained in the body of this report are technical
opinions only. The material herein has been obtained
from sources believed to be reliable and accurate, however,
its accuracy and completeness cannot be guaranteed.
This site is not an investment advisor, hence it does
not endorse or recommend any securities or other investments.
Any recommendation contained in this report may not
be suitable for all investors and it is not to be deemed
an offer or solicitation on our part with respect to
the purchase or sale of any securities. All trademarks,
service marks and trade names appearing in this report
are the property of their respective owners, and are
likewise used for identification purposes only.
This report is a service available
only to active Paid Premium Members.
You may opt-out of receiving report notifications
at any time. Questions or comments may be submitted
by writing to Premium Membership Services 665 S.E. 10 Street, Suite 201 Deerfield Beach, FL 33441-5634 or by calling 1-800-965-8307
or 954-785-1121.
|
|
|


