You are not logged in.
This means you
CAN ONLY VIEW reports that were published prior to Tuesday, February 18, 2025.
You
MUST UPGRADE YOUR MEMBERSHIP if you want to see any current reports.
AFTER MARKET UPDATE - THURSDAY, JANUARY 12TH, 2012
Previous After Market Report Next After Market Report >>>
|
|
|
|
DOW |
+21.57 |
12,471.02 |
+0.17% |
|
Volume |
770,312,110 |
+1% |
|
Volume |
1,637,297,350 |
-3% |
|
NASDAQ |
+13.94 |
2,724.70 |
+0.51% |
|
Advancers |
1,799 |
58% |
|
Advancers |
1,531 |
58% |
|
S&P 500 |
+3.02 |
1,295.50 |
+0.23% |
|
Decliners |
1,184 |
38% |
|
Decliners |
972 |
37% |
|
Russell 2000 |
+3.25 |
770.49 |
+0.42% |
|
52 Wk Highs |
103 |
|
|
52 Wk Highs |
63 |
|
|
S&P 600 |
+2.31 |
431.01 |
+0.54% |
|
52 Wk Lows |
15 |
|
|
52 Wk Lows |
25 |
|
|
 |
Major Averages Overcame Early Weakness to Post Small Gains
Kenneth J. Gruneisen - Passed the CAN SLIM® Master's Exam
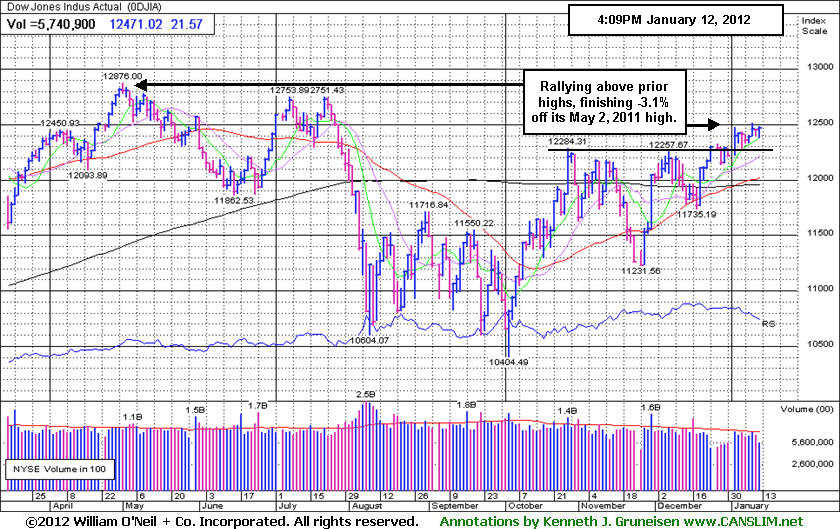
The major averages ended higher Thursday after slumping into the red in the morning. The volume totals were reported slightly higher than the prior session on the NYSE and slightly lower on the Nasdaq exchange. Breadth on the session was positive as advancers led decliners by 3-2 on the Nasdaq exchange and on the NYSE. New 52-week highs again outnumbered new 52-week lows on the NYSE and on the Nasdaq exchange. There were 49 high-ranked companies from the CANSLIM.net Leaders List that made new 52-week highs and appeared on the CANSLIM.net BreakOuts Page, up from the prior session total of 34 stocks. There were gains for 14 of the 19 high-ranked companies currently included on the Featured Stocks Page.
The major averages overcame early weakness after Italy and Spain debt offerings saw higher demand and lower yields. As expected, the European Central Bank left its benchmark rate at 1.0%. Reports on retail sales and jobless claims missed Wall Street expectations. Retail sales rose 0.1%, below the consensus estimate of a 0.3% increase. Weekly initial jobless claims came in at 399,000 versus consensus expectations of 375,000.
Citigroup Inc (C +1.06%) posted a modest gain while financials were among the best performing sectors. Disappointing earnings pre-announcements weighed on the shares of Chevron Corp (CVX -2.60%) and William-Sonoma, Inc (WSM -12.18%).
The 10-year note fell 5/32 to yield 1.92% while there was a fresh $13 billion auction of 30-year Treasury bonds.
The expansion in leadership this week has been noted as a reassuring sign concerning the current confirmed market uptrend and the M criteria, as a healthy crop of strong leaders is necessary for any sustained market advance. Technical improvement from financial shares (noted in the "Industry Group Watch" section last evening - read here) is another encouraging sign that helps the market outlook. The Q4 2011 CANSLIM.net Webcast is still available "ON DEMAND" to all upgraded members at no additional cost. Via the Premium Member Homepage links to all prior reports and webcasts are always available.
PICTURED: The Dow Jones Industrial Average is rallying further above prior highs and finished -3.1% off its May 2, 2011 high.
|
 Kenneth J. Gruneisen started out as a licensed stockbroker in August 1987, a couple of months prior to the historic stock market crash that took the Dow Jones Industrial Average down -22.6% in a single day. He has published daily fact-based fundamental and technical analysis on high-ranked stocks online for two decades. Through FACTBASEDINVESTING.COM, Kenneth provides educational articles, news, market commentary, and other information regarding proven investment systems that work in good times and bad.
Comments contained in the body of this report are technical opinions only and are not necessarily those of Gruneisen Growth Corp. The material herein has been obtained from sources believed to be reliable and accurate, however, its accuracy and completeness cannot be guaranteed. Our firm, employees, and customers may effect transactions, including transactions contrary to any recommendation herein, or have positions in the securities mentioned herein or options with respect thereto. Any recommendation contained in this report may not be suitable for all investors and it is not to be deemed an offer or solicitation on our part with respect to the purchase or sale of any securities. |
|
 |
Tech and Financial Shares Rise; Energy Groups Lag Again
Kenneth J. Gruneisen - Passed the CAN SLIM® Master's Exam
Financial shares maintained a slightly positive bias as the Broker/Dealer Index ($XBD +0.28%) and Bank Index ($BKX +0.53%) posted small gains. The Networking Index ($NWX +1.49%) and Semiconductor Index ($SOX +1.00%) led the tech sector higher, followed by the Internet Index ($IIX +0.61%) and Biotechnology Index ($BTK +0.62%). The Gold & Silver Index ($XAU +1.07%) posted a gain. The Retail Index ($RLX -0.09%) inched lower and the Healthcare Index ($HMO +0.07%) inched higher. Meanwhile, energy-related shares were laggards and slumped again as the Oil Services Index ($OSX -0.77%) and Integrated Oil Index ($XOI -0.73%) lost ground.
Charts courtesy www.stockcharts.com
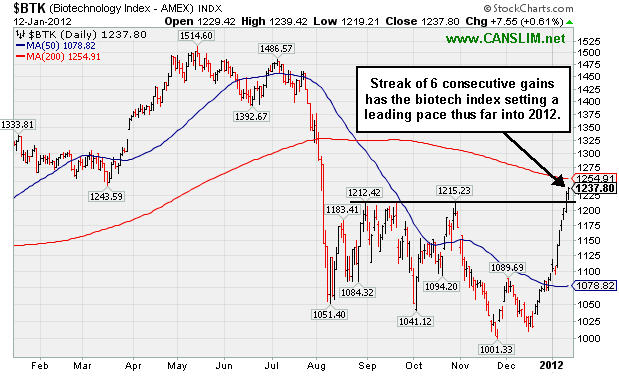
PICTURED: The Biotechnology Index ($BTK +0.62%) extended its winning streak to 6 consecutive sessions, helping it set a leading pace thus far into 2012.
| Oil Services |
$OSX |
225.33 |
-1.74 |
-0.77% |
+4.18% |
| Healthcare |
$HMO |
2,499.41 |
+1.66 |
+0.07% |
+9.55% |
| Integrated Oil |
$XOI |
1,239.58 |
-9.15 |
-0.73% |
+0.85% |
| Semiconductor |
$SOX |
391.75 |
+3.86 |
+1.00% |
+7.49% |
| Networking |
$NWX |
232.71 |
+3.42 |
+1.49% |
+8.15% |
| Internet |
$IIX |
291.37 |
+1.77 |
+0.61% |
+3.42% |
| Broker/Dealer |
$XBD |
90.28 |
+0.25 |
+0.28% |
+8.42% |
| Retail |
$RLX |
532.59 |
-0.50 |
-0.09% |
+1.79% |
| Gold & Silver |
$XAU |
195.12 |
+2.07 |
+1.07% |
+8.02% |
| Bank |
$BKX |
43.61 |
+0.23 |
+0.53% |
+10.74% |
| Biotech |
$BTK |
1,237.80 |
+7.55 |
+0.61% |
+13.41% |
|
|
|
 |
Following "Breakaway Gap" No Resistance Remains
Kenneth J. Gruneisen - Passed the CAN SLIM® Master's Exam
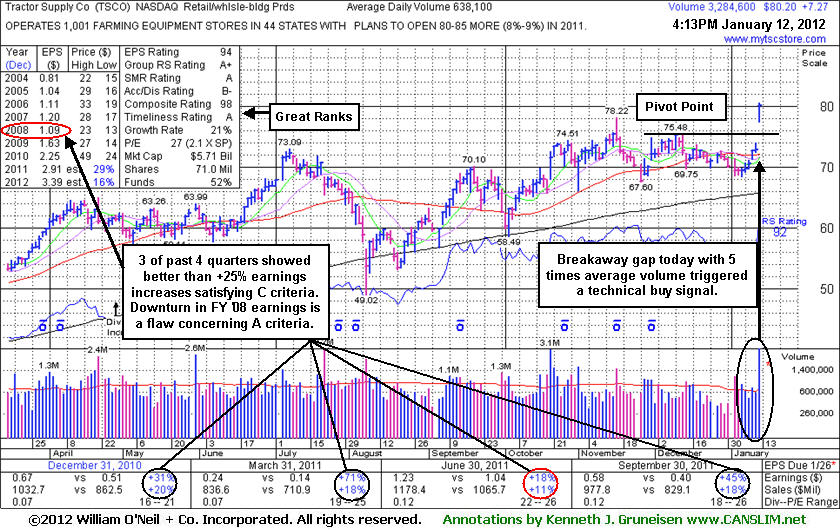
Tractor Supply Co (TSCO +$7.33 or +10.05% to $80.26) hit new 52-week and all-time highs (N criteria) after a considerable "breakaway gap" today, rallying for its 6th consecutive gain. It was highlighted in yellow in the mid-day report (read here) with pivot point cited based on its 12/09/11 high plus 10 cents. A breakaway gap is the one noted exception to the rule of buying stocks only trading within 5% of their prior chart highs, however risk increases the further one chases any stock that an ordinary pullback may prompt disciplined investors into limiting their loss at -7% per the investment system's strict sell rule.
In 3 of the past 4 quarterly comparisons it showed better than +25% earnings increases satisfying C criteria. A slight downturn in FY '08 earnings is a minor flaw concerning the A criteria, but that has been followed by very strong growth, and its 3-5 year "Growth Rate" of +21% is solid. The number of top-rated funds owning its shares has risen from 490 in Mar '11 to 598 in Dec '11, a reassuring trend concerning the I criteria.
TSCO had consolidated under its 50-day moving average (DMA) line from its prior high. That old high was hit when last noted in the 11/16/11 mid-day report. -"Reported earnings +45% on +18% sales revenues for the quarter ended September 30, 2011 versus the year ago period. Reported earnings +18% on +11% sales revenues for the quarter ended June 30, 2011 versus the year ago period, below the investment system's guidelines, however its quarterly and annual earnings history (C and A criteria) has otherwise been strong enough to be considered a worthy candidate under the fact-based investment system. TSCO was long ago featured in the June '03 CANSLIM.net News."
|
|
|
Color Codes Explained :
Y - Better candidates highlighted by our
staff of experts.
G - Previously featured
in past reports as yellow but may no longer be buyable under the
guidelines.
***Last / Change / Volume data in this table is the closing quote data***
Symbol/Exchange
Company Name
Industry Group |
PRICE |
CHANGE
(%Change) |
Day High |
Volume
(% DAV)
(% 50 day avg vol) |
52 Wk Hi
% From Hi |
Featured
Date |
Price
Featured |
Pivot Featured |
|
Max Buy |
ADS
-
NYSE
Alliance Data Sys Corp
COMPUTER SOFTWARE and SERVICES - Information and Delivery Service
|
$107.39
|
+0.69
0.65% |
$108.62
|
738,129
106.14% of 50 DAV
50 DAV is 695,400
|
$107.33
0.06%
|
10/21/2011
|
$97.94
|
PP = $101.15
|
|
MB = $106.21
|
Most Recent Note - 1/10/2012 5:44:09 PM
Y - Up for a 4th consecutive gain today after finding prompt support near its 50 DMA line, still perched within close striking distance of its all-time high. However, a subsequent violation of the 1/04/12 session low ($100.42) would raise greater concerns and trigger a technical sell signal.
>>> The latest Featured Stock Update with an annotated graph appeared on 12/14/2011. Click here.
View all notes |
Alert me of new notes |
CANSLIM.net Company Profile |
SEC |
Zacks Reports |
StockTalk |
News |
Chart |
Request a new note
C
A N
S L
I M


|
ALXN
-
NASDAQ
Alexion Pharmaceuticals
DRUGS - Drug Manufacturers - Other
|
$74.32
|
+0.68
0.92% |
$74.38
|
681,014
56.77% of 50 DAV
50 DAV is 1,199,700
|
$76.20
-2.47%
|
11/30/2011
|
$68.66
|
PP = $70.52
|
|
MB = $74.05
|
 Most Recent Note - 1/12/2012 3:39:49 PM
G - Stubbornly holding its ground after rallying with volume-driven gains and getting extended from its prior base. Prior resistance in the $70 area defines initial chart support above its 50 DMA line.
>>> The latest Featured Stock Update with an annotated graph appeared on 12/12/2011. Click here.
View all notes |
Alert me of new notes |
CANSLIM.net Company Profile |
SEC |
Zacks Reports |
StockTalk |
News |
Chart |
Request a new note
C
A N
S L
I M
|
CATM
-
NASDAQ
Cardtronics Inc
DIVERSIFIED SERVICES - Business/Management Services
|
$26.28
|
-0.42
-1.57% |
$26.80
|
227,346
66.79% of 50 DAV
50 DAV is 340,400
|
$28.74
-8.56%
|
12/23/2011
|
$28.64
|
PP = $28.56
|
|
MB = $29.99
|
Most Recent Note - 1/11/2012 4:55:54 PM
Y - Color code is changed to yellow while showing resilience and finding prompt support near its 50 DMA line. Previously noted, "The gain on 12/23/11 was backed by +77% above average volume and it touched a new 52-week high, but it did not close above the new pivot point cited based on its 11/08/11 high plus 10 cents."
>>> The latest Featured Stock Update with an annotated graph appeared on 12/23/2011. Click here.
View all notes |
Alert me of new notes |
CANSLIM.net Company Profile |
SEC |
Zacks Reports |
StockTalk |
News |
Chart |
Request a new note
C
A N
S L
I M
|
CELG
-
NASDAQ
Celgene Corp
DRUGS - Drug Manufacturers - Major
|
$73.20
|
+1.13
1.57% |
$73.49
|
5,421,344
159.95% of 50 DAV
50 DAV is 3,389,400
|
$72.31
1.23%
|
12/20/2011
|
$66.68
|
PP = $68.35
|
|
MB = $71.77
|
Most Recent Note - 1/11/2012 5:03:48 PM
G - Color code is changed to green after rallying beyond its "max buy" level for another new 52-week high today. Its 1/10/12 gain and strong close was backed by +59% above average volume as it rallied above its pivot point triggering a technical buy signal.
>>> The latest Featured Stock Update with an annotated graph appeared on 12/29/2011. Click here.
View all notes |
Alert me of new notes |
CANSLIM.net Company Profile |
SEC |
Zacks Reports |
StockTalk |
News |
Chart |
Request a new note
C
A N
S L
I M
|
FEIC
-
NASDAQ
F E I Co
ELECTRONICS - Diversified Electronics
|
$44.39
|
+0.48
1.09% |
$44.41
|
221,469
72.78% of 50 DAV
50 DAV is 304,300
|
$44.04
0.79%
|
12/7/2011
|
$41.41
|
PP = $42.35
|
|
MB = $44.47
|
Most Recent Note - 1/11/2012 5:05:41 PM
Y - Hit a new all-time high and triggered a technical buy signal with +68% above average volume behind its gain today while rising above its pivot point for a 3rd consecutive gain. No overhead supply remains to hinder its upward progress. The 50 DMA line defines chart support above prior lows.
>>> The latest Featured Stock Update with an annotated graph appeared on 12/21/2011. Click here.
View all notes |
Alert me of new notes |
CANSLIM.net Company Profile |
SEC |
Zacks Reports |
StockTalk |
News |
Chart |
Request a new note
C
A N
S L
I M
|
Symbol/Exchange
Company Name
Industry Group |
PRICE |
CHANGE
(%Change) |
Day High |
Volume
(% DAV)
(% 50 day avg vol) |
52 Wk Hi
% From Hi |
Featured
Date |
Price
Featured |
Pivot Featured |
|
Max Buy |
GNC
-
NYSE
G N C Holdings Inc
RETAIL - Drug Stores
|
$28.32
|
-0.04
-0.14% |
$28.75
|
461,267
40.37% of 50 DAV
50 DAV is 1,142,700
|
$29.50
-4.00%
|
10/26/2011
|
$24.60
|
PP = $24.80
|
|
MB = $26.04
|
Most Recent Note - 1/12/2012 3:42:19 PM
G - Holding its ground since finding prompt support near its 50 DMA line. Subsequent losses below its 50 DMA and recent chart low (1/09/12 low of $26.54) would raise more serious concerns and trigger more worrisome technical sell signals.
>>> The latest Featured Stock Update with an annotated graph appeared on 12/16/2011. Click here.
View all notes |
Alert me of new notes |
CANSLIM.net Company Profile |
SEC |
Zacks Reports |
StockTalk |
News |
Chart |
Request a new note
C
A N
S L
I M
|
HMSY
-
NASDAQ
H M S Holdings Corp
COMPUTER SOFTWARE and SERVICES - Healthcare Information Service
|
$32.30
|
+0.17
0.53% |
$32.66
|
335,013
33.55% of 50 DAV
50 DAV is 998,500
|
$32.83
-1.61%
|
10/27/2011
|
$26.44
|
PP = $28.37
|
|
MB = $29.79
|
Most Recent Note - 1/11/2012 4:58:14 PM
G - No resistance remains to hinder its progress, but it is slightly extended from its prior base. Holding its ground near its all-time high with volume totals cooling in recent weeks.
>>> The latest Featured Stock Update with an annotated graph appeared on 12/28/2011. Click here.
View all notes |
Alert me of new notes |
CANSLIM.net Company Profile |
SEC |
Zacks Reports |
StockTalk |
News |
Chart |
Request a new note
C
A N
S L
I M
|
ISRG
-
NASDAQ
Intuitive Surgical Inc
HEALTH SERVICES - Medical Appliances and Equipment
|
$458.13
|
+1.18
0.26% |
$460.85
|
215,254
70.60% of 50 DAV
50 DAV is 304,900
|
$474.50
-3.45%
|
12/20/2011
|
$442.43
|
PP = $449.16
|
|
MB = $471.62
|
Most Recent Note - 1/11/2012 4:59:33 PM
Y - Gain today on average volume halted a streak of 3 consecutive losses. Recently enduring mild distributional pressure while churning near its all-time high, and previously noted, "Recent gains above its pivot point have lacked the volume needed to trigger a proper new (or add-on) technical buy signal. Important support is defined by its 50 DMA line."
>>> The latest Featured Stock Update with an annotated graph appeared on 12/13/2011. Click here.
View all notes |
Alert me of new notes |
CANSLIM.net Company Profile |
SEC |
Zacks Reports |
StockTalk |
News |
Chart |
Request a new note
C
A N
S L
I M
|
LULU
-
NASDAQ
Lululemon Athletica
MANUFACTURING - Textile Manufacturing
|
$61.24
|
+0.67
1.11% |
$61.73
|
3,367,510
85.53% of 50 DAV
50 DAV is 3,937,400
|
$64.49
-5.04%
|
1/10/2012
|
$60.97
|
PP = $59.46
|
|
MB = $62.43
|
Most Recent Note - 1/11/2012 12:32:55 PM
Y - Holding its ground today following a considerable gap up gain on 1/10/12 when noted rising from a "double bottom" base. Prior chart highs in the low $60s may now act as a resistance level. See the latest FSU analysis for more details and a new annotated graph.
>>> The latest Featured Stock Update with an annotated graph appeared on 1/10/2012. Click here.
View all notes |
Alert me of new notes |
CANSLIM.net Company Profile |
SEC |
Zacks Reports |
StockTalk |
News |
Chart |
Request a new note
C
A N
S L
I M
|
MA
-
NYSE
Mastercard Inc Cl A
DIVERSIFIED SERVICES - Business/Management Services
|
$343.30
|
+1.83
0.54% |
$344.85
|
1,325,360
127.01% of 50 DAV
50 DAV is 1,043,500
|
$384.99
-10.83%
|
1/3/2012
|
$367.87
|
PP = $385.09
|
|
MB = $404.34
|
Most Recent Note - 1/11/2012 2:26:21 PM
G - Slumping further below its 50 DMA line and under late-November lows raising greater concerns. Its 200 DMA line defines the next nearest support level as technical damage mounts.
>>> The latest Featured Stock Update with an annotated graph appeared on 1/3/2012. Click here.
View all notes |
Alert me of new notes |
CANSLIM.net Company Profile |
SEC |
Zacks Reports |
StockTalk |
News |
Chart |
Request a new note
C
A N
S L
I M
|
Symbol/Exchange
Company Name
Industry Group |
PRICE |
CHANGE
(%Change) |
Day High |
Volume
(% DAV)
(% 50 day avg vol) |
52 Wk Hi
% From Hi |
Featured
Date |
Price
Featured |
Pivot Featured |
|
Max Buy |
MKTX
-
NASDAQ
Marketaxess Holdings Inc
FINANCIAL SERVICES - Investment Brokerage - Nationa
|
$30.87
|
+0.10
0.32% |
$31.08
|
90,226
44.75% of 50 DAV
50 DAV is 201,600
|
$32.23
-4.22%
|
10/28/2011
|
$29.79
|
PP = $31.05
|
|
MB = $32.60
|
Most Recent Note - 1/11/2012 2:44:38 PM
Y - Pulling back today following 2 prior gains into new all-time high territory without truly great volume conviction. The 50 DMA line defines initial chart support to watch.
>>> The latest Featured Stock Update with an annotated graph appeared on 12/20/2011. Click here.
View all notes |
Alert me of new notes |
CANSLIM.net Company Profile |
SEC |
Zacks Reports |
StockTalk |
News |
Chart |
Request a new note
C
A N
S L
I M
|
OSIS
-
NASDAQ
O S I Systems Inc
ELECTRONICS - Semiconductor Equipment and Mate
|
$50.26
|
-0.40
-0.79% |
$50.94
|
36,252
35.23% of 50 DAV
50 DAV is 102,900
|
$51.06
-1.57%
|
11/1/2011
|
$42.07
|
PP = $45.57
|
|
MB = $47.85
|
Most Recent Note - 1/12/2012 3:45:33 PM
G - Pulling back today on light volume after a streak of 7 consecutive small gains, getting extended from its prior base. Its 50 DMA line defines important near-term support to watch.
>>> The latest Featured Stock Update with an annotated graph appeared on 12/27/2011. Click here.
View all notes |
Alert me of new notes |
CANSLIM.net Company Profile |
SEC |
Zacks Reports |
StockTalk |
News |
Chart |
Request a new note
C
A N
S L
I M
|
PRGO
-
NASDAQ
Perrigo Co
DRUGS - Drug Related Products
|
$97.49
|
+0.07
0.07% |
$98.99
|
528,119
40.03% of 50 DAV
50 DAV is 1,319,300
|
$104.70
-6.89%
|
12/9/2011
|
$99.54
|
PP = $101.56
|
|
MB = $106.64
|
Most Recent Note - 1/10/2012 2:39:47 PM
G - Gapped up today for a solid gain backed by higher volume, rallying toward previously stubborn resistance in the low $100s.
>>> The latest Featured Stock Update with an annotated graph appeared on 1/9/2012. Click here.
View all notes |
Alert me of new notes |
CANSLIM.net Company Profile |
SEC |
Zacks Reports |
StockTalk |
News |
Chart |
Request a new note
C
A N
S L
I M
|
RAX
-
NYSE
Rackspace Hosting Inc
INTERNET - Internet Software and; Services
|
$43.19
|
+0.56
1.31% |
$43.50
|
1,233,872
75.00% of 50 DAV
50 DAV is 1,645,100
|
$46.50
-7.11%
|
11/8/2011
|
$44.28
|
PP = $46.27
|
|
MB = $48.58
|
Most Recent Note - 1/10/2012 5:45:58 PM
G - Encountering resistance when trying to rebound back above its 50 DMA line, enduring distributional pressure after not making headway above its pivot point. Its 200 DMA line defines the next near-term support level to watch.
>>> The latest Featured Stock Update with an annotated graph appeared on 1/5/2012. Click here.
View all notes |
Alert me of new notes |
CANSLIM.net Company Profile |
SEC |
Zacks Reports |
StockTalk |
News |
Chart |
Request a new note
C
A N
S L
I M
|
SXCI
-
NASDAQ
S X C Health Solutions
COMPUTER SOFTWARE and SERVICES - Healthcare Information Service
|
$62.90
|
-1.75
-2.71% |
$64.87
|
523,567
120.42% of 50 DAV
50 DAV is 434,800
|
$66.40
-5.27%
|
1/10/2012
|
$62.05
|
PP = $60.10
|
|
MB = $63.11
|
Most Recent Note - 1/11/2012 4:18:24 PM
G - Finished strong today for its second-best close ever with its 2nd consecutive volume-driven gain, quickly getting extended from its orderly base pattern, and its color code is changed to green. Featured in yellow in the 1/10/12 mid-day report (read here) with pivot point cited based on its 12/02/11 high plus 10 cents. Ownership by top-rated funds has been increasing, rising from 453 in Jun '10 to 600 in Dec '11, a reassuring sign concerning the I criteria. Reported earnings +57% on +163% sales revenues for the quarter ended September 31, 2011 versus the year ago period. Strong prior quarters and good annual earnings history satisfy the C & A criteria.

There are no Featured Stock Updates™ available for this stock at this time. You may request one by clicking the Request a New Note link below
View all notes |
Alert me of new notes |
CANSLIM.net Company Profile |
SEC |
Zacks Reports |
StockTalk |
News |
Chart |
Request a new note
C
A N
S L
I M
|
Symbol/Exchange
Company Name
Industry Group |
PRICE |
CHANGE
(%Change) |
Day High |
Volume
(% DAV)
(% 50 day avg vol) |
52 Wk Hi
% From Hi |
Featured
Date |
Price
Featured |
Pivot Featured |
|
Max Buy |
TDG
-
NYSE
Transdigm Group Inc
AEROSPACE/DEFENSE - Aerospace/Defense Products and; Services
|
$98.03
|
-0.34
-0.35% |
$98.86
|
208,163
60.06% of 50 DAV
50 DAV is 346,600
|
$102.73
-4.58%
|
1/10/2012
|
$98.83
|
PP = $102.83
|
|
MB = $107.97
|
Most Recent Note - 1/10/2012 5:49:48 PM
Y - Gain today on light volume for its best-ever close. No overhead supply remains to act as resistance. Color code was changed to yellow with new pivot point cited based on its 52-week high plus 10 cents. Volume driven gains for new highs may help it clear a base-on-base type pattern. Recent lows in the $90 area define the next nearby support level to watch above its 200 DMA line.
>>> The latest Featured Stock Update with an annotated graph appeared on 1/4/2012. Click here.
View all notes |
Alert me of new notes |
CANSLIM.net Company Profile |
SEC |
Zacks Reports |
StockTalk |
News |
Chart |
Request a new note
C
A N
S L
I M
|
TSCO
-
NASDAQ
Tractor Supply Co
SPECIALTY RETAIL - Specialty Retail, Other
|
$80.20
|
+7.27
9.97% |
$80.56
|
3,285,933
514.96% of 50 DAV
50 DAV is 638,100
|
$78.22
2.53%
|
1/12/2012
|
$79.12
|
PP = $75.58
|
|
MB = $79.36
|
Most Recent Note - 1/12/2012 12:38:27 PM
Y - Hit new 52-week and all-time highs after a considerable "breakaway gap" today, rallying for its 6th consecutive gain. Color code is changed to yellow with pivot point cited based on its 12/09/11 high plus 10 cents. Consolidated under its 50 DMA line from the prior high which it hit when last noted in the 11/16/11 mid-day report. -"Reported earnings +45% on +18% sales revenues for the quarter ended September 30, 2011 versus the year ago period. Reported earnings +18% on +11% sales revenues for the quarter ended June 30, 2011 versus the year ago period, below the investment system's guidelines, however its quarterly and annual earnings history (C and A criteria) has otherwise been strong enough to be considered a worthy candidate under the fact-based investment system. TSCO was long ago featured in the June '03 CANSLIM.net News."
>>> The latest Featured Stock Update with an annotated graph appeared on 1/12/2012. Click here.
View all notes |
Alert me of new notes |
CANSLIM.net Company Profile |
SEC |
Zacks Reports |
StockTalk |
News |
Chart |
Request a new note
C
A N
S L
I M
|
ULTA
-
NASDAQ
Ulta Salon Cosm & Frag
SPECIALTY RETAIL - Specialty Retail, Other
|
$71.93
|
+0.15
0.21% |
$72.00
|
846,468
85.43% of 50 DAV
50 DAV is 990,800
|
$75.70
-4.98%
|
1/11/2012
|
$71.97
|
PP = $75.80
|
|
MB = $79.59
|
Most Recent Note - 1/11/2012 5:41:49 PM
Y - Color code was changed to yellow with new pivot point cited based on its 52-week high plus 10 cents while building on a riskier late-stage base. Prior lows near $64 define important chart support above its 200 DMA line. A gap up and rebound above its 50 DMA line has helped its technical stance improve since it was dropped from the Featured Stocks list on 12/22/11. See the latest FSU analysis for more details and a new annotated graph.
>>> The latest Featured Stock Update with an annotated graph appeared on 1/11/2012. Click here.
View all notes |
Alert me of new notes |
CANSLIM.net Company Profile |
SEC |
Zacks Reports |
StockTalk |
News |
Chart |
Request a new note
C
A N
S L
I M
|
V
-
NYSE
Visa Inc Cl A
DIVERSIFIED SERVICES - Business/Management Services
|
$101.34
|
+2.23
2.25% |
$101.68
|
4,176,168
106.77% of 50 DAV
50 DAV is 3,911,400
|
$103.45
-2.04%
|
10/24/2011
|
$94.21
|
PP = $94.85
|
|
MB = $99.59
|
Most Recent Note - 1/12/2012 3:36:24 PM
G - Gain today halted a streak of 4consecutive losses. Its 50 DMA line defines chart support to watch on pullbacks.
>>> The latest Featured Stock Update with an annotated graph appeared on 12/15/2011. Click here.
View all notes |
Alert me of new notes |
CANSLIM.net Company Profile |
SEC |
Zacks Reports |
StockTalk |
News |
Chart |
Request a new note
C
A N
S L
I M
|
|
|
|
THESE ARE NOT BUY RECOMMENDATIONS!
Comments contained in the body of this report are technical
opinions only. The material herein has been obtained
from sources believed to be reliable and accurate, however,
its accuracy and completeness cannot be guaranteed.
This site is not an investment advisor, hence it does
not endorse or recommend any securities or other investments.
Any recommendation contained in this report may not
be suitable for all investors and it is not to be deemed
an offer or solicitation on our part with respect to
the purchase or sale of any securities. All trademarks,
service marks and trade names appearing in this report
are the property of their respective owners, and are
likewise used for identification purposes only.
This report is a service available
only to active Paid Premium Members.
You may opt-out of receiving report notifications
at any time. Questions or comments may be submitted
by writing to Premium Membership Services 665 S.E. 10 Street, Suite 201 Deerfield Beach, FL 33441-5634 or by calling 1-800-965-8307
or 954-785-1121.
|
|
|

