You are not logged in.
This means you
CAN ONLY VIEW reports that were published prior to Monday, April 14, 2025.
You
MUST UPGRADE YOUR MEMBERSHIP if you want to see any current reports.
AFTER MARKET UPDATE - MONDAY, JANUARY 11TH, 2010
Previous After Market Report Next After Market Report >>>
|
|
|
|
DOW |
+45.80 |
10,663.99 |
+0.43% |
|
Volume |
967,105,270 |
-3% |
|
Volume |
2,127,906,970 |
-3% |
|
NASDAQ |
-4.76 |
2,312.41 |
-0.21% |
|
Advancers |
1,809 |
58% |
|
Advancers |
1,333 |
47% |
|
S&P 500 |
+2.00 |
1,146.98 |
+0.17% |
|
Decliners |
1,218 |
39% |
|
Decliners |
1,384 |
49% |
|
Russell 2000 |
-0.57 |
643.99 |
-0.09% |
|
52 Wk Highs |
521 |
|
|
52 Wk Highs |
211 |
|
|
S&P 600 |
-0.48 |
340.99 |
-0.14% |
|
52 Wk Lows |
1 |
|
|
52 Wk Lows |
3 |
|
|
 |
Lighter Volume Totals Behind Mixed Market Action
Adam Sarhan, Contributing Writer,
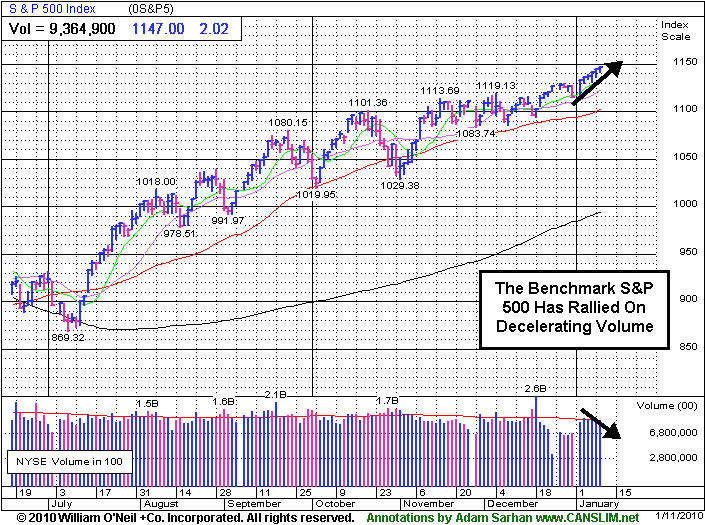
The major averages closed mixed on Monday after China reported record imports and the US dollar declined. Volume, an important indicator of institutional sponsorship, was reported slightly lower than Friday's totals on the NYSE and on the Nasdaq exchange which indicated large institutions were not aggressively buying or selling stocks. Advancers led decliners by a 3-to-2 ratio on the NYSE while the balance was just about even on the Nasdaq exchange. There were 55 high-ranked companies from the CANSLIM.net Leaders List that made a new 52-week high and appeared on the CANSLIM.net BreakOuts Page, higher than the total of 30 issues that appeared on the prior session. New 52-week highs solidly outnumbered new 52-week lows on the NYSE and on the Nasdaq exchange, and new lows were again in the single digits which is a healthy sign.
Before Monday's opening bell, China said both imports and exports rose compared to last year's levels. Exports rose +17.7% from the same period last year which was the first increase in 14 months, and imports surged +55.9% to a record high. The fact that exports rose signals that the global economy continues to recover. However, the real news is that Chinese imports surged to a fresh all-time high, which supports the notion that China's economy is strong. It is important to note that there are over 1.3 billion people in China, which means that if only 30% of their population gets "wealthier" over the next few years that roughly equals the entire population of the United States. As we can see, the growth in China (and Asia as a whole) can have a tremendous impact on the global economy.
After Monday's closing bell, Alcoa Inc. (AA +2.53%) officially kicked off earnings season as the company reported fourth-quarter profit of 1 cent a share excluding some items. This missed the Street's estimate of 6 cents per share, but it was encouraging that its sales topped estimates. Traditionally, Alcoa is the first company in the Dow Jones Industrial Average to report quarterly results which officially kicks off earnings season. Over the next few weeks, investors will be closely watching earnings for a better gauge of how companies fared last quarter.
After three strong weeks of gains, the market appears to be showing signs that a near-term pullback might be in the cards. A slew of stocks negatively reversed (opened higher and closed lower) on Monday, which suggests a change in trend may unfold. However, for the most part, the major averages and leading stocks are still acting strong. They deserve the bullish benefit of the doubt until support, in this case their respective 50-day moving average (DMA) lines, is violated. The current rally is beginning its 45th week (since the March 12, 2009 follow-through day) and still looks strong. In addition, most bull markets last for approximately 36 months, so the fact that we are in the rally's 10th month suggests there is still more room to go.
Professional Money Management Services - A Winning System - Inquire today!
Our skilled team of portfolio managers knows how to follow the rules of this fact-based investment system. We do not follow opinion or the "conviction list" of some large Wall Street institution which would have us fully invested even during horrific bear markets. Instead, we remain fluid and only buy the best stocks when they are triggering proper technical buy signals. If you are not completely satisfied with the way your portfolio is being managed, Click here to submit your inquiry. *Accounts over $250,000 please. ** Serious inquires only, please.
PICTURED: The benchmark S&P 500 Index has rallied higher for 6 consecutive sessions, but the most recent sessions had below average volume conviction.
|
|
|
 |
Retail Index Consolidating While +100% Up From November 2008 Low
Kenneth J. Gruneisen - Passed the CAN SLIM® Master's Exam
The Retail Index ($RLX -0.78%) ended modestly lower and financial shares were a little sluggish as the Broker/Dealer Index ($XBD -0.42%) suffered a small loss and the Bank Index ($BKX +0.06%) basically held its ground. Modest losses from the Healthcare Index ($HMO -0.35%) and Oil Services Index ($OSX -0.99%) were offset by small gains from the Integrated Oil Index ($XOI +0.52%) and Gold & Silver Index ($XAU +0.48%) as defensive areas showed mixed action. The tech sector showed no great conviction as the Semiconductor Index ($SOX -0.29%), Internet Index ($IIX -0.22%), Networking Index ($NWX -0.16%) ended Monday's session with small losses while the Biotechnology Index ($BTK +0.28%) posted a small gain.
Charts courtesy www.stockcharts.com
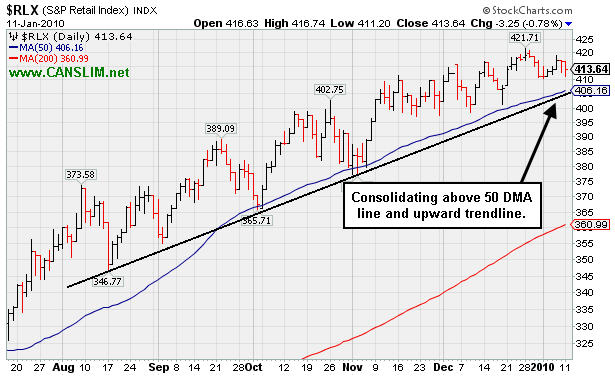
PICTURED: The Retail Index ($RLX -0.78%) is consolidating above its 50-day moving average (DMA) line and an upward trendline. It finished the session +100% from its most extreme November 2008 low (not shown).
| Oil Services |
$OSX |
214.46 |
-2.15 |
-0.99% |
+10.02% |
| Healthcare |
$HMO |
1,558.96 |
-5.44 |
-0.35% |
+5.84% |
| Integrated Oil |
$XOI |
1,122.03 |
+5.84 |
+0.52% |
+5.04% |
| Semiconductor |
$SOX |
366.62 |
-1.06 |
-0.29% |
+1.86% |
| Networking |
$NWX |
237.97 |
-0.39 |
-0.16% |
+2.99% |
| Internet |
$IIX |
235.39 |
-0.53 |
-0.22% |
+0.65% |
| Broker/Dealer |
$XBD |
119.39 |
-0.50 |
-0.42% |
+3.77% |
| Retail |
$RLX |
413.64 |
-3.25 |
-0.78% |
+0.61% |
| Gold & Silver |
$XAU |
182.62 |
+0.88 |
+0.48% |
+8.54% |
| Bank |
$BKX |
47.03 |
+0.03 |
+0.06% |
+10.11% |
| Biotech |
$BTK |
975.87 |
+2.77 |
+0.28% |
+3.58% |
|
|
|
 |
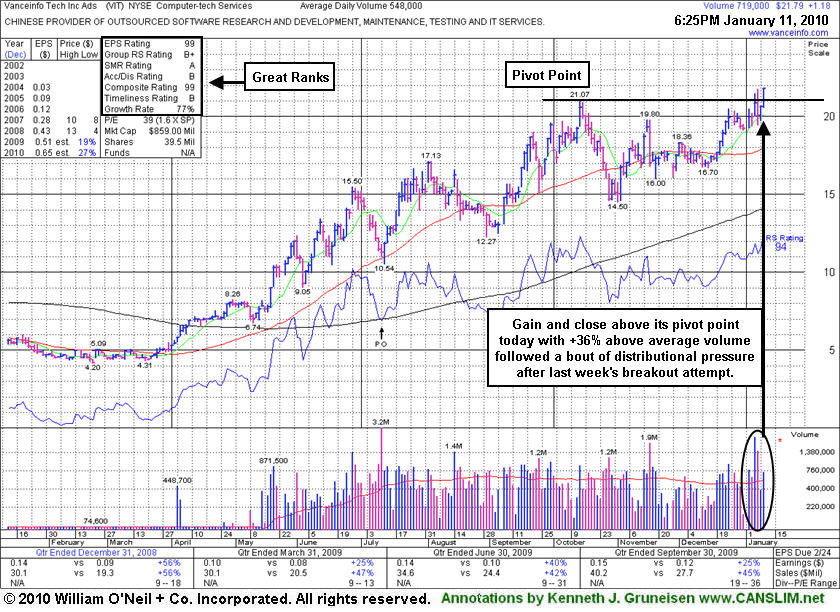
Rally And Close Above Pivot Point Today On +36% Above Average Volume
Kenneth J. Gruneisen - Passed the CAN SLIM® Master's Exam
Vanceinfo Tech Inc Ads (VIT +$1.15 or +5.58% to $21.76) posted a considerable gain today and closed near the session high with +36% above average volume as it rallied above its pivot point. On 1/06/10 it posted a solid gain with 4 times average volume for a new high close as it hit a new all-time high, but it pulled back on that session and closed under its pivot point. It traded higher on the next session, then negatively reversed and closed with a loss. That recent action was noted as a sign of distributional pressure as it tried to rally from a choppy 11-week base, however today's gain offered some additional proof of institutional (I criteria) buying demand driving the stock to new highs (the N criteria). Its current Up/Down Volume Ratio of 1.4 is an unbiased indication that the overall technical price/volume action of late has been bullish, and no overhead supply exists to act as resistance.
The high-ranked Computer - Tech Services firm was featured in yellow in the 12/24/09 mid-day report (read here) while approaching all-time highs. It had come a long way this year, yet it built a sufficient length base following its steep ascent from its March low ($4.31). Fundamentally, its earnings and sales revenues increases have been above or at the +25% minimum guideline. Its small supply of only 11.4 million shares (the S criteria) in the publicly traded float could be a factor leading to greater volatility, especially in the event of mutual funds accumulating or distributing (selling) shares. This heightens the need for caution when buying and the discipline to limit losses, as always, if any stock ever falls more than -7% from your buy price.
|
|
|
Color Codes Explained :
Y - Better candidates highlighted by our
staff of experts.
G - Previously featured
in past reports as yellow but may no longer be buyable under the
guidelines.
***Last / Change / Volume quote data in this table corresponds with the timestamp on the note***
Symbol/Exchange
Company Name
Industry Group |
Last |
Chg. |
Vol
% DAV |
Date Featured |
Price Featured |
Latest Pivot Point
Featured |
Status |
| Latest Max Buy Price |
ARST
-
|
$28.57
|
-0.34
|
288,407
58% DAV
497,300
|
9/1/2009
(Date
Featured) |
$19.91
(Price
Featured) |
PP = $27.20 |
G |
| MB = $28.56 |
Most Recent Note - 1/11/2010 5:54:54 PM
G - Holding its ground near its "max buy" level, its color code was changed to green. A considerable gain on 1/04/10 triggered a technical buy signal as it blasted above its pivot point with volume more than 3 times average. ARST was first featured in yellow at $19.91 in the 9/01/09 mid-day report with an annotated daily graph (read here).
>>> The latest Featured Stock Update with an annotated graph appeared on 1/4/2010. click here.
|
|
C
A
S
I |
News |
Chart |
SEC
View all notes Alert
me of new notes
Company
Profile
|
ASIA
-
|
$29.22
|
-0.56
|
879,198
67% DAV
1,319,100
|
12/24/2009
(Date
Featured) |
$31.05
(Price
Featured) |
PP = $32.40 |
G |
| MB = $34.02 |
Most Recent Note - 1/11/2010 5:58:01 PM
G - Gapped up today, then negatively reversed for a loss with light volume. Consolidating above its 50 DMA line (now $27.41) which is the next important support level to watch. A technical buy signal did not occur since its advanced "3 weeks tight" pattern was recently noted. Traded up as much as +68.13% since first featured in the August 2009 CANSLIM.net News (read here).
>>> The latest Featured Stock Update with an annotated graph appeared on 12/23/2009. click here.
|
|
C
A
S
I |
News |
Chart |
SEC
View all notes Alert
me of new notes
Company
Profile
|
BIDU
- NASDAQ
Baidu Inc Ads
INTERNET - Internet Information Providers
|
$400.57
|
-3.70
|
1,221,028
81% DAV
1,515,100
|
9/8/2009
(Date
Featured) |
$351.80
(Price
Featured) |
PP = $440.00 |
G |
| MB = $462.00 |
Most Recent Note - 1/11/2010 6:02:02 PM
G - Lost ground for 8 of the past 9 sessions, and it encountered resistance at its 50 DMA line last week. A violation of its recent chart low ($394.56 on 12/22/09) could raise more serious concerns. Technically, it has built a sloppy base over the past 11 weeks, but gains above its 50 DMA line are needed to help its outlook improve. BIDU traded up as much as +23% from its price when featured in yellow in the 9/08/09 Mid-Day BreakOuts Report (read here).
>>> The latest Featured Stock Update with an annotated graph appeared on 1/7/2010. click here.
|
|
C
A
S
I |
News |
Chart |
SEC
View all notes Alert
me of new notes
Company
Profile
|
CAAS
- NASDAQ
China Automotive Systems
AUTOMOTIVE - Auto Parts
|
$26.35
|
+1.87
|
2,556,155
279% DAV
916,800
|
11/30/2009
(Date
Featured) |
$18.84
(Price
Featured) |
PP = $17.62 |
G |
| MB = $18.50 |
Most Recent Note - 1/11/2010 6:03:26 PM
G - Gapped up today and hit another new all-time high with considerable gain on very heavy volume. As previously noted, "Volume was more than 4 times average behind its considerable 1/05/10 gain for a new high. The choppy consolidation over the prior 5 weeks involved a -28% pullback, so this was not a sound "flat base" of the minimum length. However, no overhead supply remains and it could go on to produce a "climax run", especially considering its small float of only 4.86 million shares (S criteria). It found prompt support following a sharp pullback to its short-term average line." It was $18.84 when first featured in the 11/30/09 mid-day report (read here).
>>> The latest Featured Stock Update with an annotated graph appeared on 12/29/2009. click here.
|
|
C
A
S
I |
News |
Chart |
SEC
View all notes Alert
me of new notes
Company
Profile
|
CACC
- NASDAQ
Credit Acceptance Corp
FINANCIAL SERVICES - Credit Services
|
$47.96
|
+3.98
|
120,790
282% DAV
42,900
|
9/29/2009
(Date
Featured) |
$33.48
(Price
Featured) |
PP = $37.10 |
G |
| MB = $38.96 |
Most Recent Note - 1/11/2010 6:04:48 PM
G - Gapped up today and traded almost 3 times average volume while tallying a considerable gain and hitting a new all-time high. Previous chart high and 50 DMA line coincide in the $37 area, defining an important support level to watch. The Finance - Consumer/Commercial Loans firm has maintained a great track record of annual and quarterly sales revenues and earnings increases. It was featured on 9/29/09 in yellow in the mid-day report (read here).
>>> The latest Featured Stock Update with an annotated graph appeared on 1/8/2010. click here.
|
|
C
A
S
I |
News |
Chart |
SEC
View all notes Alert
me of new notes
Company
Profile
|
CRM
- NYSE
Salesforce.com Inc
INTERNET - Internet Software & Services
|
$73.65
|
-0.50
|
1,577,691
92% DAV
1,706,400
|
12/18/2009
(Date
Featured) |
$67.32
(Price
Featured) |
PP = $67.82 |
G |
| MB = $71.21 |
Most Recent Note - 1/11/2010 6:06:00 PM
G - Hovering in a tight range for the past couple of weeks near its $75 all-time high, extended from its latest sound base. Prior chart highs in the $67 area are an important support level to watch on pullbacks.
>>> The latest Featured Stock Update with an annotated graph appeared on 1/6/2010. click here.
|
|
C
A
S
I |
News |
Chart |
SEC
View all notes Alert
me of new notes
Company
Profile
|
CTRP
- NASDAQ
Ctrip.com Intl Ltd Adr
LEISURE - Resorts & Casinos
|
$73.64
|
+0.86
|
956,196
88% DAV
1,089,400
|
12/1/2009
(Date
Featured) |
$75.38
(Price
Featured) |
PP = $73.91 |
Y |
| MB = $77.61 |
Most Recent Note - 1/11/2010 6:07:12 PM
Y - Small gap up gain today on near average volume while consolidating just above its 50 DMA line in an orderly fashion for about 5 weeks. Gains above the pivot with at least +50% above average volume are needed to trigger a fresh technical buy signal. Featured on 12/01/09 in yellow in the mid-day report (read here). Fundamentally, its sales revenues and earnings increases have shown acceleration in the 3 most recent quarterly comparisons and rose above the +25% guideline. Based on weak technical action it was dropped from the Featured Stocks list on 6/10/08, when it closed at $49.84, yet it has rebounded very impressively from subsequent lows in the $16 area.
>>> The latest Featured Stock Update with an annotated graph appeared on 12/30/2009. click here.
|
|
C
A
S
I |
News |
Chart |
SEC
View all notes Alert
me of new notes
Company
Profile
|
GMCR
- NASDAQ
Green Mtn Coffee Roastrs
FOOD & BEVERAGE - Processed & Packaged Goods
|
$81.43
|
-0.42
|
968,958
61% DAV
1,587,100
|
12/28/2009
(Date
Featured) |
$77.49
(Price
Featured) |
PP = $76.50 |
G |
| MB = $80.33 |
Most Recent Note - 1/11/2010 6:08:34 PM
G - Small loss today on light volume while consolidating near all-time highs just above its "max buy" level. Prior chart highs in the $76-77 area are important support levels to watch now.
>>> The latest Featured Stock Update with an annotated graph appeared on 12/28/2009. click here.
|
|
C
A
S
I |
News |
Chart |
SEC
View all notes Alert
me of new notes
Company
Profile
|
HEAT
-
|
$18.03
|
+0.88
|
2,033,003
188% DAV
1,083,500
|
1/6/2010
(Date
Featured) |
$17.19
(Price
Featured) |
PP = $17.27 |
Y |
| MB = $18.13 |
Most Recent Note - 1/11/2010 6:13:54 PM
Y - Gapped up today, rallying to a new all-time high with almost twice its average volume. The gain above the pivot point of its short "ascending base" type pattern triggered a new technical buy signal. Recent chart lows near $14 define an important support level now. HEAT traded as much as +55.0% higher in the 8-week period since it was first featured in yellow in the 11/17/09 mid-day report (read here) when technically rising from a "double bottom" base, reaching a new all-time high.
>>> The latest Featured Stock Update with an annotated graph appeared on 12/31/2009. click here.
|
|
C
A
S
I |
News |
Chart |
SEC
View all notes Alert
me of new notes
Company
Profile
|
LFT
-
|
$40.94
|
+0.77
|
335,925
82% DAV
408,100
|
11/17/2009
(Date
Featured) |
$31.77
(Price
Featured) |
PP = $33.04 |
G |
| MB = $34.69 |
Most Recent Note - 1/11/2010 6:15:31 PM
G - Gain today with lighter volume for a new all-time high. Extended from a sound buy point after recently rising from a choppy 14-week base. Its 50 DMA line is an initial support level to watch. A proposed offering of additional shares on 11/16/09 seems well received by the market. Its fundamentals remain strong.
>>> The latest Featured Stock Update with an annotated graph appeared on 1/5/2010. click here.
|
|
C
A
S
I |
News |
Chart |
SEC
View all notes Alert
me of new notes
Company
Profile
|
PEGA
- NASDAQ
Pegasystems Inc
COMPUTER SOFTWARE & SERVICES - Business Software & Services
|
$34.54
|
+1.33
|
268,461
112% DAV
239,500
|
1/4/2010
(Date
Featured) |
$34.00
(Price
Featured) |
PP = $36.19 |
Y |
| MB = $38.00 |
Most Recent Note - 1/11/2010 6:20:24 PM
Y - Posted a gain today on better volume than any up session since its 12/14/09 rally above its 50 DMA line. Color code is changed to yellow based on improvement, yet it may continue basing for a longer period. Gains above prior highs in the $36 area with heavier volume would be a bullish technical buy signal. Returned to the Featured Stocks page again with its fresh appearance in the January 2010 issue of CANSLIM.net News (read here).
>>> The latest Featured Stock Update with an annotated graph appeared on 1/3/2010. click here.
|
|
C
A
S
I |
News |
Chart |
SEC
View all notes Alert
me of new notes
Company
Profile
|
VIT
-
|
$21.76
|
+1.15
|
721,439
132% DAV
548,000
|
12/24/2009
(Date
Featured) |
$20.07
(Price
Featured) |
PP = $21.17 |
Y |
| MB = $22.23 |
Most Recent Note - 1/11/2010 6:23:45 PM
Y - Gain today with +36% above average volume helped it rally and close above its pivot point from a choppy 11-week base, however the volume total was under the minimum guideline for a proper technical buy signal. Featured in yellow in the 12/24/09 mid-day report (read here). No overhead supply exists to act as resistance. Fundamentally, this high-ranked Computer - Tech Services firm's earnings and sales revenues increases have been above or at the +25% minimum guideline.
>>> The latest Featured Stock Update with an annotated graph appeared on 1/11/2010. click here.
|
|
C
A
S
I |
News |
Chart |
SEC
View all notes Alert
me of new notes
Company
Profile
|
|
|
|
THESE ARE NOT BUY RECOMMENDATIONS!
Comments contained in the body of this report are technical
opinions only. The material herein has been obtained
from sources believed to be reliable and accurate, however,
its accuracy and completeness cannot be guaranteed.
This site is not an investment advisor, hence it does
not endorse or recommend any securities or other investments.
Any recommendation contained in this report may not
be suitable for all investors and it is not to be deemed
an offer or solicitation on our part with respect to
the purchase or sale of any securities. All trademarks,
service marks and trade names appearing in this report
are the property of their respective owners, and are
likewise used for identification purposes only.
This report is a service available
only to active Paid Premium Members.
You may opt-out of receiving report notifications
at any time. Questions or comments may be submitted
by writing to Premium Membership Services 665 S.E. 10 Street, Suite 201 Deerfield Beach, FL 33441-5634 or by calling 1-800-965-8307
or 954-785-1121.
|
|
|


