You are not logged in.
This means you
CAN ONLY VIEW reports that were published prior to Monday, March 10, 2025.
You
MUST UPGRADE YOUR MEMBERSHIP if you want to see any current reports.
AFTER MARKET UPDATE - MONDAY, JANUARY 9TH, 2012
Previous After Market Report Next After Market Report >>>
|
|
|
|
DOW |
+32.62 |
12,392.54 |
+0.26% |
|
Volume |
721,584,120 |
+2% |
|
Volume |
1,756,810,300 |
+6% |
|
NASDAQ |
+2.34 |
2,676.56 |
+0.09% |
|
Advancers |
1,906 |
61% |
|
Advancers |
1,435 |
55% |
|
S&P 500 |
+2.89 |
1,280.70 |
+0.23% |
|
Decliners |
1,092 |
35% |
|
Decliners |
1,075 |
41% |
|
Russell 2000 |
+3.80 |
753.51 |
+0.51% |
|
52 Wk Highs |
114 |
|
|
52 Wk Highs |
56 |
|
|
S&P 600 |
+1.45 |
421.63 |
+0.35% |
|
52 Wk Lows |
19 |
|
|
52 Wk Lows |
43 |
|
|
 |
Major Averages Rise Further Above Chart Resistance Areas
Kenneth J. Gruneisen - Passed the CAN SLIM® Master's Exam
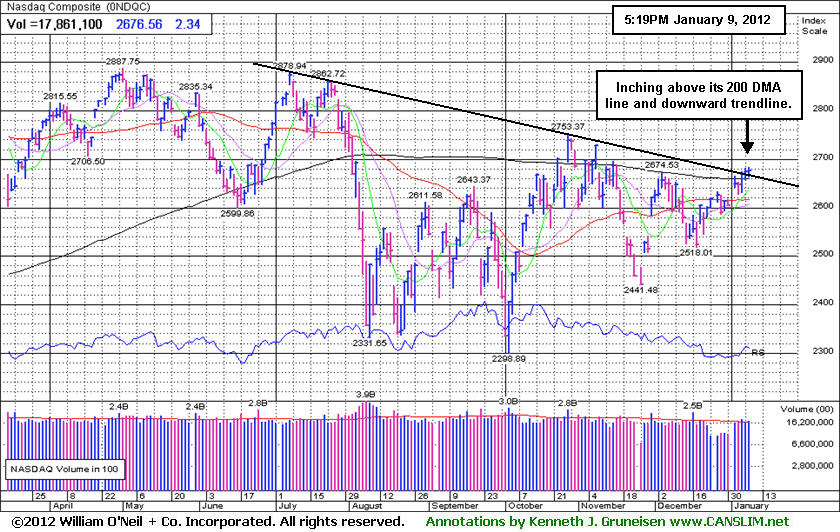
The three major averages collectively posted small gains on Monday, rising further above both their 50-day and 200-day moving average lines, respectively. Monday's volume totals were slightly higher than the prior session on the NYSE and on the Nasdaq exchange. Breadth on the session was positive as advancers led decliner by almost 2-1 on the NYSE and by 7-5 on the Nasdaq exchange. New 52-week highs outnumbered new 52-week lows on the NYSE and on the Nasdaq exchange again. There were 38 high-ranked companies from the CANSLIM.net Leaders List that made new 52-week highs and appeared on the CANSLIM.net BreakOuts Page, up a notch from the prior session total of 37 stocks. There were gains for 12 of the 16 high-ranked companies currently included on the Featured Stocks Page.
Stocks failed to gain ground after a meeting between German Chancellor Merkel and French President Sarkozy to discuss fiscal budget rules for the region. European markets closed lower with the London's FTSE and Germany's DAX both down -0.7% on the session.
The major averages have swung between gains and losses, generally holding steady ahead of Alcoa Inc's (AA +2.89%) earnings which kicked off the fourth quarter earnings season. Industrials were among the best performers on Monday's session with Caterpillar Inc (CAT +1.04%) among the influential gainers. Inhibitex Inc (INHX +140%) was a standout as its shares surged after Bristol-Myers Squibb Co (BMY -0.91%) agreed to acquire the bio-tech firm for $26 a share. Tech was weighed down by Google Inc's (GOOG -4.24%) retreat.
The action in leading stocks listed on the the Featured Stocks Page has brought more breakdowns than breakouts in recent weeks, raising questions about the health of the current market uptrend. Keep an eye on the number of high-ranked leaders hitting the BreakOuts Page in the days ahead to help yourself determine whether leadership is expanding again or contracting.
The market (M criteria) is currently in a confirmed uptrend, which means that disciplined investors' odds are considered favorable for accumulating shares of sound buy candidates in the days ahead. If that stance changes (M criteria) it will be noted in this daily commentary which all members should read regularly. We appreciate any feedback members may wish to send via the inquiry form here.
The Q4 2011 CANSLIM.net Webcast is still available "ON DEMAND" to all upgraded members at no additional cost. Via the Premium Member Homepage links to all prior reports and webcasts are always available.
PICTURED: The Nasdaq Composite Index is inching above its 200-day moving average (DMA) line and above a downward trendline connecting its July-October chart highs.
|
 Kenneth J. Gruneisen started out as a licensed stockbroker in August 1987, a couple of months prior to the historic stock market crash that took the Dow Jones Industrial Average down -22.6% in a single day. He has published daily fact-based fundamental and technical analysis on high-ranked stocks online for two decades. Through FACTBASEDINVESTING.COM, Kenneth provides educational articles, news, market commentary, and other information regarding proven investment systems that work in good times and bad.
Comments contained in the body of this report are technical opinions only and are not necessarily those of Gruneisen Growth Corp. The material herein has been obtained from sources believed to be reliable and accurate, however, its accuracy and completeness cannot be guaranteed. Our firm, employees, and customers may effect transactions, including transactions contrary to any recommendation herein, or have positions in the securities mentioned herein or options with respect thereto. Any recommendation contained in this report may not be suitable for all investors and it is not to be deemed an offer or solicitation on our part with respect to the purchase or sale of any securities. |
|
 |
Tech, Financial, Healthcare Groups Led Gainers
Kenneth J. Gruneisen - Passed the CAN SLIM® Master's Exam
The Retail Index ($RLX -0.31%) was a laggard as it ended lower on Monday, however gains from influential financial shares and other areas offset the weakness. The Bank Index ($BKX +1.18%) outpaced the Broker/Dealer Index ($XBD +0.29%). The Internet Index ($IIX -0.02%) finished flat but other tech groups rose including the Biotechnology Index ($BTK +1.02%), Networking Index ($NWX +1.88%), and Semiconductor Index ($SOX +1.96%). The Healthcare Index ($HMO +1.63%) posted a solid gain. Commodity-linked groups had a slightly positive bias as the Gold & Silver Index ($XAU +0.46%), Integrated Oil Index ($XOI +0.56%), and Oil Services Index ($OSX +0.56%) posted modest gains.
Charts courtesy www.stockcharts.com
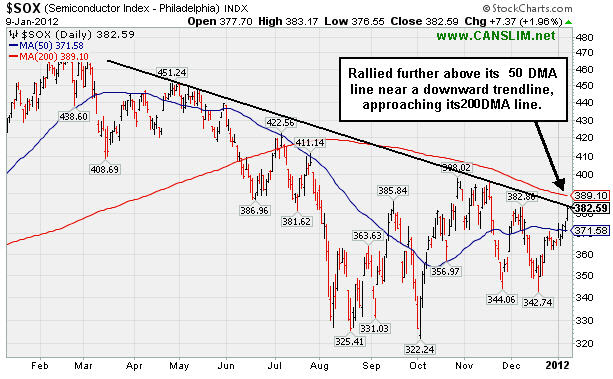
PICTURED: The Semiconductor Index ($SOX +1.96%) posted a 5th consecutive gain as it rallied further above its 50-day moving average (DMA) line toward a downward trendline and its 200 DMA line. Subsequent progress above those near-term technical hurdles would be a reassuring sign the rally is gaining momentum from this influential tech group.
| Oil Services |
$OSX |
224.54 |
+1.26 |
+0.56% |
+3.82% |
| Healthcare |
$HMO |
2,458.79 |
+39.55 |
+1.63% |
+7.77% |
| Integrated Oil |
$XOI |
1,254.29 |
+6.96 |
+0.56% |
+2.05% |
| Semiconductor |
$SOX |
382.59 |
+7.37 |
+1.96% |
+4.98% |
| Networking |
$NWX |
222.14 |
+4.11 |
+1.88% |
+3.24% |
| Internet |
$IIX |
288.42 |
-0.07 |
-0.02% |
+2.37% |
| Broker/Dealer |
$XBD |
86.88 |
+0.25 |
+0.29% |
+4.34% |
| Retail |
$RLX |
531.67 |
-1.67 |
-0.31% |
+1.62% |
| Gold & Silver |
$XAU |
188.03 |
+0.86 |
+0.46% |
+4.09% |
| Bank |
$BKX |
42.08 |
+0.49 |
+1.18% |
+6.86% |
| Biotech |
$BTK |
1,174.73 |
+11.82 |
+1.02% |
+7.63% |
|
|
|
 |
Testing Support at 50-Day Moving Average and Upward Trendline
Kenneth J. Gruneisen - Passed the CAN SLIM® Master's Exam
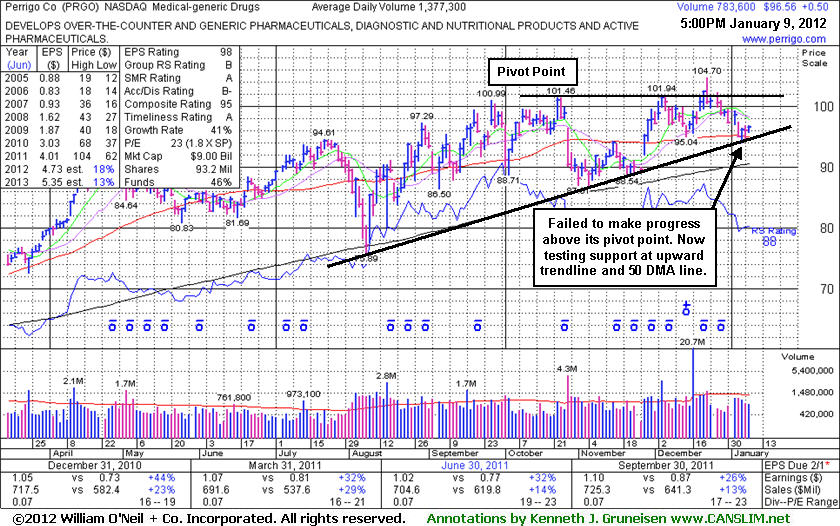
Perrigo Co (PRGO +$0.50 or +0.52% to $96.56) is consolidating just above support at its 50-day moving average (DMA) line and an upward trendline connecting its August-November lows. Subsequent weakness below that short-term average and a violation of the upward trendline would raise more serious concerns and trigger technical sell signals. Since last shown in this FSU section on 12/09/11 with an annotated graph under the headline, "No Resistance Remains While Forming Late-Stage Base", it
traded above its pivot point without great volume conviction, then there was a worrisome "negative reversal" on 12/22/11, a sign it was encountering distributional pressure when it was on the cusp of clinching a proper new technical buy signal. Since that negative reversal it has sputtered from all-time high territory back near important chart support again.
It reported earnings +26% on +13% sales revenues for the quarter ended September 30, 2011 versus the year ago period. Strong quarterly and annual earnings history satisfies the C & A criteria of the investment system. Ownership by top-rated funds rose from 647 in Dec '10 to 773 in Dec '11, which is a reassuring trend concerning the I criteria. It found prompt support at its 200 DMA line during the earlier consolidation. It is still considered a riskier late-stage setup. It faces resistance due to overhead supply up through the $102 area, and disciplined investors would watch for additional confirming gains with heavy volume before considering any new buying efforts.
|
|
|
Color Codes Explained :
Y - Better candidates highlighted by our
staff of experts.
G - Previously featured
in past reports as yellow but may no longer be buyable under the
guidelines.
***Last / Change / Volume data in this table is the closing quote data***
Symbol/Exchange
Company Name
Industry Group |
PRICE |
CHANGE
(%Change) |
Day High |
Volume
(% DAV)
(% 50 day avg vol) |
52 Wk Hi
% From Hi |
Featured
Date |
Price
Featured |
Pivot Featured |
|
Max Buy |
ADS
-
NYSE
Alliance Data Sys Corp
COMPUTER SOFTWARE and SERVICES - Information and Delivery Service
|
$104.19
|
+1.65
1.61% |
$104.35
|
631,812
86.30% of 50 DAV
50 DAV is 732,100
|
$107.33
-2.93%
|
10/21/2011
|
$97.94
|
PP = $101.15
|
|
MB = $106.21
|
Most Recent Note - 1/5/2012 2:25:56 PM
Y - Up today, finding prompt support near its 50 DMA line after enduring distributional pressure this week. It remains perched within close striking distance of its all-time high. However, a subsequent violation of the 1/04/12 session low ($100.42) would raise greater concerns and trigger a technical sell signal.
>>> The latest Featured Stock Update with an annotated graph appeared on 12/14/2011. Click here.
View all notes |
Alert me of new notes |
CANSLIM.net Company Profile |
SEC |
Zacks Reports |
StockTalk |
News |
Chart |
Request a new note
C
A N
S L
I M


|
ALXN
-
NASDAQ
Alexion Pharmaceuticals
DRUGS - Drug Manufacturers - Other
|
$74.27
|
-0.18
-0.24% |
$76.20
|
1,323,306
112.52% of 50 DAV
50 DAV is 1,176,100
|
$74.68
-0.55%
|
11/30/2011
|
$68.66
|
PP = $70.52
|
|
MB = $74.05
|
 Most Recent Note - 1/9/2012 12:25:45 PM
G - Color code is changed to green after rallying beyond its "max buy" level for new all-time highs today with volume running at an above average pace for a 3rd consecutive session. The prior gain above its pivot point had +53% above average volume, meeting the investment system guidelines for a technical buy signal. Its 50 DMA line defines near-term support above prior lows in the $62 area.
>>> The latest Featured Stock Update with an annotated graph appeared on 12/12/2011. Click here.
View all notes |
Alert me of new notes |
CANSLIM.net Company Profile |
SEC |
Zacks Reports |
StockTalk |
News |
Chart |
Request a new note
C
A N
S L
I M
|
CATM
-
NASDAQ
Cardtronics Inc
DIVERSIFIED SERVICES - Business/Management Services
|
$26.25
|
+0.16
0.61% |
$26.52
|
438,016
127.22% of 50 DAV
50 DAV is 344,300
|
$28.74
-8.66%
|
12/23/2011
|
$28.64
|
PP = $28.56
|
|
MB = $29.99
|
Most Recent Note - 1/6/2012 3:42:29 PM
G - Slumping under its 50 DMA line today with a loss raising concerns, and its color code is changed to green. Previously noted, "The gain on 12/23/11 was backed by +77% above average volume and it touched a new 52-week high, but it did not close above the new pivot point cited based on its 11/08/11 high plus 10 cents."
>>> The latest Featured Stock Update with an annotated graph appeared on 12/23/2011. Click here.
View all notes |
Alert me of new notes |
CANSLIM.net Company Profile |
SEC |
Zacks Reports |
StockTalk |
News |
Chart |
Request a new note
C
A N
S L
I M
|
CELG
-
NASDAQ
Celgene Corp
DRUGS - Drug Manufacturers - Major
|
$68.23
|
+1.01
1.50% |
$68.85
|
6,796,401
202.41% of 50 DAV
50 DAV is 3,357,700
|
$69.26
-1.49%
|
12/20/2011
|
$66.68
|
PP = $68.35
|
|
MB = $71.77
|
Most Recent Note - 1/9/2012 12:43:28 PM
Y - Powering higher with above average volume today, near its 52-week high and within striking distance of its best-ever close. Volume-driven gains above the pivot point cited may help to confirm a new (or add-on) technical buy signal.
>>> The latest Featured Stock Update with an annotated graph appeared on 12/29/2011. Click here.
View all notes |
Alert me of new notes |
CANSLIM.net Company Profile |
SEC |
Zacks Reports |
StockTalk |
News |
Chart |
Request a new note
C
A N
S L
I M
|
FEIC
-
NASDAQ
F E I Co
ELECTRONICS - Diversified Electronics
|
$41.94
|
+0.86
2.09% |
$42.00
|
272,360
80.01% of 50 DAV
50 DAV is 340,400
|
$43.00
-2.47%
|
12/7/2011
|
$41.41
|
PP = $42.35
|
|
MB = $44.47
|
Most Recent Note - 1/9/2012 2:12:19 PM
Y - Holding its ground following a "positive reversal" on 1/05/12, still hovering near its all-time high. The 50 DMA line (now $39.89) defines chart support above prior lows. Disciplined investors would still be watching for a volume-driven gain above the pivot point to trigger a proper technical buy signal.
>>> The latest Featured Stock Update with an annotated graph appeared on 12/21/2011. Click here.
View all notes |
Alert me of new notes |
CANSLIM.net Company Profile |
SEC |
Zacks Reports |
StockTalk |
News |
Chart |
Request a new note
C
A N
S L
I M
|
Symbol/Exchange
Company Name
Industry Group |
PRICE |
CHANGE
(%Change) |
Day High |
Volume
(% DAV)
(% 50 day avg vol) |
52 Wk Hi
% From Hi |
Featured
Date |
Price
Featured |
Pivot Featured |
|
Max Buy |
GNC
-
NYSE
G N C Holdings Inc
RETAIL - Drug Stores
|
$28.49
|
+0.95
3.45% |
$28.69
|
1,311,514
87.59% of 50 DAV
50 DAV is 1,497,300
|
$29.50
-3.42%
|
10/26/2011
|
$24.60
|
PP = $24.80
|
|
MB = $26.04
|
Most Recent Note - 1/9/2012 2:08:08 PM
G - Overcame early weakness and managed a positive reversal, finding prompt support after briefly undercutting its 50 DMA line. Subsequent losses below its intra-day low ($26.54) would raise more serious concerns and trigger technical sell signals.
>>> The latest Featured Stock Update with an annotated graph appeared on 12/16/2011. Click here.
View all notes |
Alert me of new notes |
CANSLIM.net Company Profile |
SEC |
Zacks Reports |
StockTalk |
News |
Chart |
Request a new note
C
A N
S L
I M
|
HMSY
-
NASDAQ
H M S Holdings Corp
COMPUTER SOFTWARE and SERVICES - Healthcare Information Service
|
$31.84
|
+0.63
2.02% |
$31.93
|
663,553
61.37% of 50 DAV
50 DAV is 1,081,200
|
$32.83
-3.02%
|
10/27/2011
|
$26.44
|
PP = $28.37
|
|
MB = $29.79
|
Most Recent Note - 1/6/2012 5:54:08 PM
G - Hovering in a tight range near its all-time high with volume totals cooling. No resistance remains, but it is slightly extended from its prior base.
>>> The latest Featured Stock Update with an annotated graph appeared on 12/28/2011. Click here.
View all notes |
Alert me of new notes |
CANSLIM.net Company Profile |
SEC |
Zacks Reports |
StockTalk |
News |
Chart |
Request a new note
C
A N
S L
I M
|
ISRG
-
NASDAQ
Intuitive Surgical Inc
HEALTH SERVICES - Medical Appliances and Equipment
|
$451.50
|
-8.96
-1.95% |
$459.76
|
466,135
152.63% of 50 DAV
50 DAV is 305,400
|
$474.50
-4.85%
|
12/20/2011
|
$442.43
|
PP = $449.16
|
|
MB = $471.62
|
Most Recent Note - 1/9/2012 1:10:28 PM
Y - Pulling back again today, enduring mild distributional pressure while churning near its all-time high. Previously noted, "Recent gains above its pivot point have lacked the volume needed to trigger a proper new (or add-on) technical buy signal. Important support is defined by its 50 DMA line."
>>> The latest Featured Stock Update with an annotated graph appeared on 12/13/2011. Click here.
View all notes |
Alert me of new notes |
CANSLIM.net Company Profile |
SEC |
Zacks Reports |
StockTalk |
News |
Chart |
Request a new note
C
A N
S L
I M
|
MA
-
NYSE
Mastercard Inc Cl A
DIVERSIFIED SERVICES - Business/Management Services
|
$345.82
|
+2.90
0.85% |
$347.82
|
1,147,157
109.62% of 50 DAV
50 DAV is 1,046,500
|
$384.99
-10.17%
|
1/3/2012
|
$367.87
|
PP = $385.09
|
|
MB = $404.34
|
Most Recent Note - 1/6/2012 3:39:29 PM
G - Down for a 4th consecutive session with above average volume. Failed to attract support since violating its 50 DMA line and triggering a technical sell signal on 1/04/12 when last noted - "Another damaging loss is raising concerns, and its color code is changed to green while now encountering distributional pressure after building a riskier late-stage base. Only a prompt rebound above its short-term average would help its outlook. The 1/03/12 mid-day report (read here) cited a new pivot point based on its 52-week high plus 10 cents. Quarterly and annual earnings history makes it a good match with the C and A criteria. See the latest FSU analysis for an annotated weekly graph."
>>> The latest Featured Stock Update with an annotated graph appeared on 1/3/2012. Click here.
View all notes |
Alert me of new notes |
CANSLIM.net Company Profile |
SEC |
Zacks Reports |
StockTalk |
News |
Chart |
Request a new note
C
A N
S L
I M
|
MG
-
NYSE
Mistras Group Inc
DIVERSIFIED SERVICES - Bulding and Faci;ity Management Services
|
$23.86
|
-0.13
-0.54% |
$24.77
|
396,493
296.55% of 50 DAV
50 DAV is 133,700
|
$26.24
-9.07%
|
10/28/2011
|
$22.49
|
PP = $23.61
|
|
MB = $24.79
|
Most Recent Note - 1/9/2012 2:16:40 PM
G - Reported earnings +38% on +29% sales revenues for the quarter ended November 30, 2011 versus the year ago period. Rebounded promptly after early weakness today undercut its 50 DMA line and the upward trendline previously noted as support levels to watch.
>>> The latest Featured Stock Update with an annotated graph appeared on 1/6/2012. Click here.
View all notes |
Alert me of new notes |
CANSLIM.net Company Profile |
SEC |
Zacks Reports |
StockTalk |
News |
Chart |
Request a new note
C
A N
S L
I M
|
Symbol/Exchange
Company Name
Industry Group |
PRICE |
CHANGE
(%Change) |
Day High |
Volume
(% DAV)
(% 50 day avg vol) |
52 Wk Hi
% From Hi |
Featured
Date |
Price
Featured |
Pivot Featured |
|
Max Buy |
MKTX
-
NASDAQ
Marketaxess Holdings Inc
FINANCIAL SERVICES - Investment Brokerage - Nationa
|
$31.71
|
+0.83
2.69% |
$31.85
|
261,091
123.68% of 50 DAV
50 DAV is 211,100
|
$31.59
0.38%
|
10/28/2011
|
$29.79
|
PP = $31.05
|
|
MB = $32.60
|
Most Recent Note - 1/9/2012 2:03:37 PM
Y - Today's gain has it inching into new all-time high territory without truly great volume conviction. The 50 DMA line defines initial chart support to watch.
>>> The latest Featured Stock Update with an annotated graph appeared on 12/20/2011. Click here.
View all notes |
Alert me of new notes |
CANSLIM.net Company Profile |
SEC |
Zacks Reports |
StockTalk |
News |
Chart |
Request a new note
C
A N
S L
I M
|
OSIS
-
NASDAQ
O S I Systems Inc
ELECTRONICS - Semiconductor Equipment and Mate
|
$50.41
|
+0.54
1.08% |
$51.06
|
149,154
139.27% of 50 DAV
50 DAV is 107,100
|
$50.56
-0.30%
|
11/1/2011
|
$42.07
|
PP = $45.57
|
|
MB = $47.85
|
Most Recent Note - 1/9/2012 1:17:41 PM
G - Wedging higher again with today's 5th consecutive small gain, getting extended from its prior base. Its 50 DMA line and recent chart lows near $45 define important near-term support to watch.
>>> The latest Featured Stock Update with an annotated graph appeared on 12/27/2011. Click here.
View all notes |
Alert me of new notes |
CANSLIM.net Company Profile |
SEC |
Zacks Reports |
StockTalk |
News |
Chart |
Request a new note
C
A N
S L
I M
|
PRGO
-
NASDAQ
Perrigo Co
DRUGS - Drug Related Products
|
$96.56
|
+0.50
0.52% |
$96.96
|
784,535
56.96% of 50 DAV
50 DAV is 1,377,300
|
$104.70
-7.77%
|
12/9/2011
|
$99.54
|
PP = $101.56
|
|
MB = $106.64
|
Most Recent Note - 1/9/2012 5:30:09 PM
G - Consolidating just above support at its 50 DMA line and an upward trendline. Subsequent violations would raise more serious concerns and trigger technical sell signals. See the latest FSU analysis for more details and a new annotated graph.
>>> The latest Featured Stock Update with an annotated graph appeared on 1/9/2012. Click here.
View all notes |
Alert me of new notes |
CANSLIM.net Company Profile |
SEC |
Zacks Reports |
StockTalk |
News |
Chart |
Request a new note
C
A N
S L
I M
|
RAX
-
NYSE
Rackspace Hosting Inc
INTERNET - Internet Software and; Services
|
$41.71
|
+0.05
0.12% |
$42.04
|
1,481,150
90.90% of 50 DAV
50 DAV is 1,629,500
|
$46.50
-10.29%
|
11/8/2011
|
$44.28
|
PP = $46.27
|
|
MB = $48.58
|
Most Recent Note - 1/5/2012 5:53:30 PM
G - Down today with higher volume while violating its 50 DMA line, triggering a technical sell signal and sinking to 5-week lows. Color code was changed to green based on weak action that is indicative of distributional pressure after not making headway above its pivot point. See the latest FSU analysis for more details and a new annotated graph.
>>> The latest Featured Stock Update with an annotated graph appeared on 1/5/2012. Click here.
View all notes |
Alert me of new notes |
CANSLIM.net Company Profile |
SEC |
Zacks Reports |
StockTalk |
News |
Chart |
Request a new note
C
A N
S L
I M
|
TDG
-
NYSE
Transdigm Group Inc
AEROSPACE/DEFENSE - Aerospace/Defense Products and; Services
|
$97.45
|
+0.71
0.73% |
$98.18
|
188,495
52.71% of 50 DAV
50 DAV is 357,600
|
$102.73
-5.14%
|
11/9/2011
|
$98.45
|
PP = $95.14
|
|
MB = $99.90
|
Most Recent Note - 1/5/2012 4:47:05 PM
G - Promptly rebounded above its 50 DMA line today with a solid gain on higher volume, and its finish near the session high was an encouraging sign of support. Its prior loss on more than 2 times average volume triggered a technical sell signal. Recent lows in the $90 area define the next nearby support level to watch. See latest FSU analysis for more details and a new annotated graph.
>>> The latest Featured Stock Update with an annotated graph appeared on 1/4/2012. Click here.
View all notes |
Alert me of new notes |
CANSLIM.net Company Profile |
SEC |
Zacks Reports |
StockTalk |
News |
Chart |
Request a new note
C
A N
S L
I M
|
Symbol/Exchange
Company Name
Industry Group |
PRICE |
CHANGE
(%Change) |
Day High |
Volume
(% DAV)
(% 50 day avg vol) |
52 Wk Hi
% From Hi |
Featured
Date |
Price
Featured |
Pivot Featured |
|
Max Buy |
V
-
NYSE
Visa Inc Cl A
DIVERSIFIED SERVICES - Business/Management Services
|
$99.90
|
-0.81
-0.80% |
$101.18
|
4,500,549
110.02% of 50 DAV
50 DAV is 4,090,800
|
$103.45
-3.43%
|
10/24/2011
|
$94.21
|
PP = $94.85
|
|
MB = $99.59
|
Most Recent Note - 1/5/2012 4:29:22 PM
G - Overcame early weakness and managed a positive reversal today for a small gain on below average volume. It is extended from its prior base and trading above its "max buy" level. Prior highs in the $95 area and its 50 DMA line define chart support to watch on pullbacks.
>>> The latest Featured Stock Update with an annotated graph appeared on 12/15/2011. Click here.
View all notes |
Alert me of new notes |
CANSLIM.net Company Profile |
SEC |
Zacks Reports |
StockTalk |
News |
Chart |
Request a new note
C
A N
S L
I M
|
|
|
|
THESE ARE NOT BUY RECOMMENDATIONS!
Comments contained in the body of this report are technical
opinions only. The material herein has been obtained
from sources believed to be reliable and accurate, however,
its accuracy and completeness cannot be guaranteed.
This site is not an investment advisor, hence it does
not endorse or recommend any securities or other investments.
Any recommendation contained in this report may not
be suitable for all investors and it is not to be deemed
an offer or solicitation on our part with respect to
the purchase or sale of any securities. All trademarks,
service marks and trade names appearing in this report
are the property of their respective owners, and are
likewise used for identification purposes only.
This report is a service available
only to active Paid Premium Members.
You may opt-out of receiving report notifications
at any time. Questions or comments may be submitted
by writing to Premium Membership Services 665 S.E. 10 Street, Suite 201 Deerfield Beach, FL 33441-5634 or by calling 1-800-965-8307
or 954-785-1121.
|
|
|

