You are not logged in.
This means you
CAN ONLY VIEW reports that were published prior to Monday, April 14, 2025.
You
MUST UPGRADE YOUR MEMBERSHIP if you want to see any current reports.
AFTER MARKET UPDATE - MONDAY, JANUARY 7TH, 2013
Previous After Market Report Next After Market Report >>>
|
|
|
|
DOW |
-50.92 |
13,384.29 |
-0.38% |
|
Volume |
625,694,230 |
-4% |
|
Volume |
1,655,321,190 |
-3% |
|
NASDAQ |
-2.85 |
3,098.81 |
-0.09% |
|
Advancers |
1,374 |
44% |
|
Advancers |
1,069 |
41% |
|
S&P 500 |
-4.58 |
1,461.89 |
-0.31% |
|
Decliners |
1,653 |
53% |
|
Decliners |
1,439 |
56% |
|
Russell 2000 |
-3.35 |
875.80 |
-0.38% |
|
52 Wk Highs |
182 |
|
|
52 Wk Highs |
104 |
|
|
S&P 600 |
-2.33 |
490.29 |
-0.47% |
|
52 Wk Lows |
6 |
|
|
52 Wk Lows |
9 |
|
|
 |
Major Averages Edged Lower Again With Lighter Volume Totals
Kenneth J. Gruneisen - Passed the CAN SLIM® Master's Exam
The major averages finished with small losses but off of their worst levels on Monday while the volume totals were reported lighter on the NYSE and on the Nasdaq exchange. Breadth was slightly negative as decliners led advancers by a 7-5 margin on the Nasdaq exchange and by an 8-7 margin on the NYSE. The total number of stocks hitting new 52-week highs still easily outnumbered new 52-week lows on the NYSE and on the Nasdaq exchange, and new lows remained in the single digits on both the NYSE and on the Nasdaq exchange. There were 61 high-ranked companies from the CANSLIM.net Leaders List making new 52-week highs and appearing on the CANSLIM.net BreakOuts Page, down from the prior session total of 87 stocks. Any sustainable rally requires a healthy crop of companies hitting new 52-week highs, so it was encouraging last week to see a great expansion in new leadership. There were gains for 5 of the 13 high-ranked companies currently included on the Featured Stocks Page.
Investors looked to take profits from last week's strong rally. Eight of the 10 sectors on the S&P finished lower, led by declines in utility stocks. Shares of Dominion Resources (D -1.64%) and Southern Company (SO -1.74%) gave up ground. Netflix Inc (NFLX +3.36%) rallied after the company announced a licensing agreement with Warner Brothers. In the healthcare space, Celgene Corp (CELG +4.43%) rallied after the firm raised their 5-year sales forecast.
Turning to fixed income markets, Treasuries were little changed along the curve. The benchmark 10-year note was down 1/32 to yield 1.90% and the 30-year bond was off 1/16 of a point to yield 3.10%.
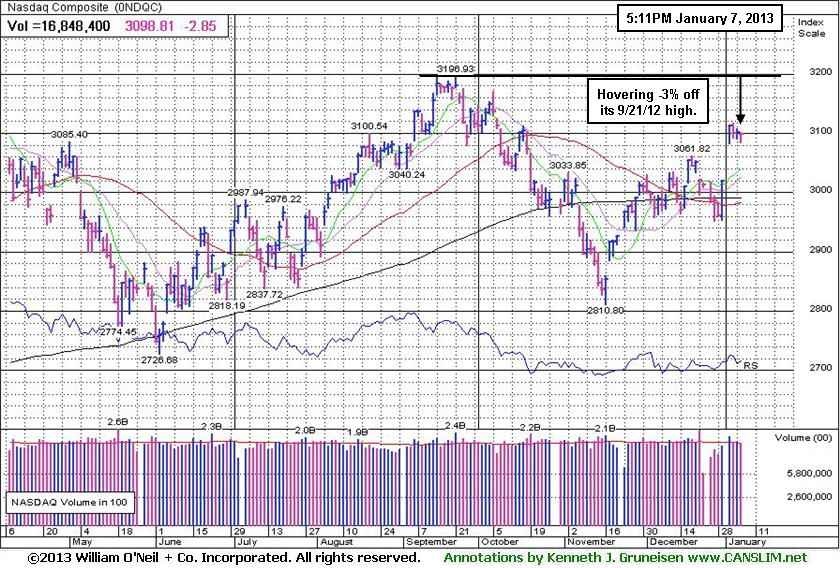
Investors may consider new buying efforts in stocks meeting all key criteria, as the market's (M criteria) confirmed uptrend showed a great expansion in leadership (stocks hitting new 52-week highs) after overcoming recent pressure. Solid gains helped the benchmark S&P 500 Index promptly rebound above its 50-day moving average (DMA) line, and Nasdaq Composite Index and Dow Jones Industrial Average both promptly rebounded above their respective 50 DMA and 200 DMA lines at the start of the week. All of the major averages then blasted above their December highs with additional volume-driven gains.
Watch for an announcement via email concerning the next WEBCAST. The webcast will also be available via an updated link highlighted at the top of the Premium Member Homepage.
PICTURED: The Nasdaq Composite Index finished -3% off its 9/21/12 high with a small loss on the session. The tech-heavy index rallied nearly +4.8% last week.
|
 Kenneth J. Gruneisen started out as a licensed stockbroker in August 1987, a couple of months prior to the historic stock market crash that took the Dow Jones Industrial Average down -22.6% in a single day. He has published daily fact-based fundamental and technical analysis on high-ranked stocks online for two decades. Through FACTBASEDINVESTING.COM, Kenneth provides educational articles, news, market commentary, and other information regarding proven investment systems that work in good times and bad.
Comments contained in the body of this report are technical opinions only and are not necessarily those of Gruneisen Growth Corp. The material herein has been obtained from sources believed to be reliable and accurate, however, its accuracy and completeness cannot be guaranteed. Our firm, employees, and customers may effect transactions, including transactions contrary to any recommendation herein, or have positions in the securities mentioned herein or options with respect thereto. Any recommendation contained in this report may not be suitable for all investors and it is not to be deemed an offer or solicitation on our part with respect to the purchase or sale of any securities. |
|
 |
Mixed Group Action on Indecisive Session
Kenneth J. Gruneisen - Passed the CAN SLIM® Master's Exam
The Retail Index ($RLX +0.27%) posted a small gain but modest weakness in the influential Broker/Dealer Index ($XBD -0.75%) and the Bank Index ($BKX -0.34%) limited the major averages' ability to rally back into the black. The Semiconductor Index ($SOX -0.48%) and Internet Index ($IIX -0.14%) edged slightly lower while the Biotechnology Index ($BTK +0.20%) and the Networking Index ($NWX +0.57%) inched higher. Defensive groups were mixed as the Gold & Silver Index ($XAU -1.43%) lost ground while the Healthcare Index ($HMO +0.97%) posted a gain. The Integrated Oil Index ($XOI -0.76%) and Oil Services Index ($OSX -0.37%) edged lower.
Charts courtesy www.stockcharts.com
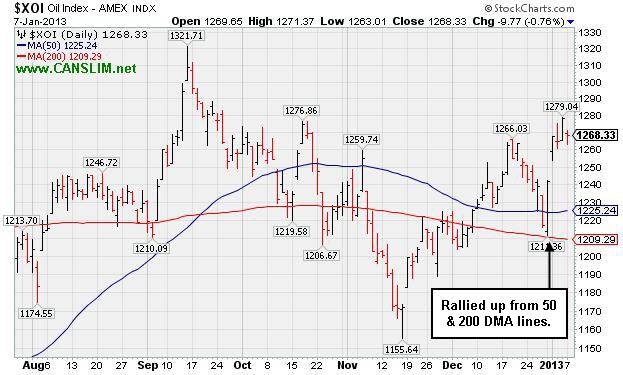
PICTURED: The Integrated Oil Index ($XOI -0.76%) has recently rallied up from its 50-day and 200-day moving average (DMA) lines.
| Oil Services |
$OSX |
231.69 |
-0.85 |
-0.37% |
+5.24% |
| Healthcare |
$HMO |
2,519.27 |
+24.17 |
+0.97% |
+0.20% |
| Integrated Oil |
$XOI |
1,268.33 |
-9.77 |
-0.76% |
+2.13% |
| Semiconductor |
$SOX |
395.78 |
-1.90 |
-0.48% |
+3.05% |
| Networking |
$NWX |
240.73 |
+1.36 |
+0.57% |
+6.26% |
| Internet |
$IIX |
336.23 |
-0.46 |
-0.14% |
+2.82% |
| Broker/Dealer |
$XBD |
98.06 |
-0.74 |
-0.75% |
+3.95% |
| Retail |
$RLX |
668.97 |
+1.78 |
+0.27% |
+2.44% |
| Gold & Silver |
$XAU |
160.20 |
-2.33 |
-1.43% |
-3.26% |
| Bank |
$BKX |
53.55 |
-0.18 |
-0.34% |
+4.43% |
| Biotech |
$BTK |
1,619.29 |
+3.29 |
+0.20% |
+4.67% |
|
|
|
 |
Fundamental and Technical Weakness Raised Concerns
Kenneth J. Gruneisen - Passed the CAN SLIM® Master's Exam
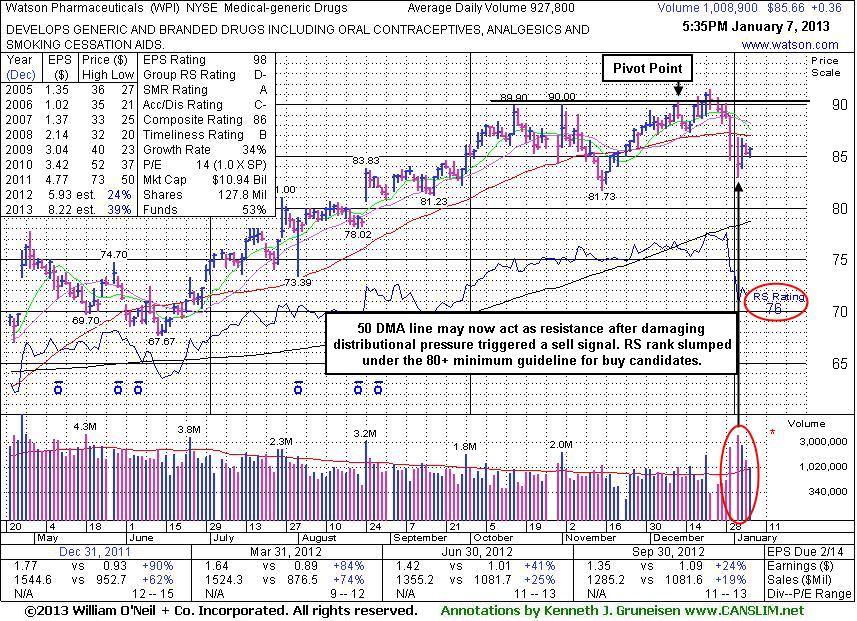
Watson Pharmaceuticals (WPI +$0.36 or +0.42% to $85.66) halted its slide after damaging distributional losses triggered a technical sell signal last week. Its 50-day moving average (DMA) line may now act as resistance. Its Relative Strength rating has slumped to a 76, below the 80+ minimum guideline for buy candidates. Based on recent deterioration in its fundamental and technical characteristics it will be dropped from the Featured Stocks list tonight. Disciplined investors might sooner choose a buy candidate without fundamental concerns, watching for a chance to accumulate shares whenever a high-ranked leader rallies above its pivot point with above average volume.
WPI was last shown in this FSU section on 12/17/12 with an annotated daily graph under the headline, "Perched Near High With No Overhead Supply". It stalled after a volume-driven gain above its pivot point on 12/21/12 triggered a new (or add-on) technical buy signal by clearing the pivot point cited based on its 12/12/12 high plus 10 cents. Disciplined investors always limit losses by selling if ever any stock falls moire than -7% from the purchase price.
As previously noted, quarterly comparisons for sales revenues and earnings increases have shown sequential deceleration in its growth rate raising some fundamental concerns. It recently reported earnings +24% on +19% sales revenues for the Sep '12 quarter, one notch below the +25% minimum guideline (C criteria), raising some concerns. The number of top-rated funds owning its shares rose from 1,011 in Mar '12 to 1,120 in Dec '12, a reassuring sign concerning the I criteria. It has maintained a strong annual earnings (A criteria) history.
|
|
|
Color Codes Explained :
Y - Better candidates highlighted by our
staff of experts.
G - Previously featured
in past reports as yellow but may no longer be buyable under the
guidelines.
***Last / Change / Volume data in this table is the closing quote data***
Symbol/Exchange
Company Name
Industry Group |
PRICE |
CHANGE
(%Change) |
Day High |
Volume
(% DAV)
(% 50 day avg vol) |
52 Wk Hi
% From Hi |
Featured
Date |
Price
Featured |
Pivot Featured |
|
Max Buy |
CELG
-
NASDAQ
Celgene Corp
DRUGS - Drug Manufacturers - Major
|
$85.73
|
+3.64
4.43% |
$85.94
|
8,780,059
307.43% of 50 DAV
50 DAV is 2,856,000
|
$83.17
3.08%
|
12/11/2012
|
$82.24
|
PP = $81.34
|
|
MB = $85.41
|
 Most Recent Note - 1/7/2013 5:32:52 PM
G - Raised its guidance and hit a new 52-week high while rallying well above its "max buy" level with heavy volume behind today's 5th consecutive gain, and its color code is changed to green after getting extended from its prior base.
>>> The latest Featured Stock Update with an annotated graph appeared on 1/3/2013. Click here.
View all notes |
Alert me of new notes |
CANSLIM.net Company Profile |
SEC |
Zacks Reports |
StockTalk |
News |
Chart |
Request a new note
C
A N
S L
I M


|
CFNL
-
NASDAQ
Cardinal Financial Corp
BANKING - Regional - Southeast Banks
|
$16.52
|
-0.08
-0.48% |
$16.54
|
81,102
37.20% of 50 DAV
50 DAV is 218,000
|
$16.90
-2.25%
|
12/3/2012
|
$15.20
|
PP = $16.31
|
|
MB = $17.13
|
Most Recent Note - 1/2/2013 4:07:21 PM
Y - Today's gain for a new 52-week high cleared its pivot point with sufficient volume to trigger a proper new (or add-on) technical buy signal.
>>> The latest Featured Stock Update with an annotated graph appeared on 12/31/2012. Click here.
View all notes |
Alert me of new notes |
CANSLIM.net Company Profile |
SEC |
Zacks Reports |
StockTalk |
News |
Chart |
Request a new note
C
A N
S L
I M
|
CMCSA
-
NASDAQ
Comcast Corp Cl A
MEDIA - CATV Systems
|
$37.90
|
-0.17
-0.45% |
$38.04
|
9,516,956
79.71% of 50 DAV
50 DAV is 11,940,000
|
$38.58
-1.76%
|
12/3/2012
|
$37.08
|
PP = $38.06
|
|
MB = $39.96
|
Most Recent Note - 1/2/2013 4:08:50 PM
Y - Today's gain above its pivot point had sufficient volume to trigger a technical buy signal. No resistance remains due to overhead supply.
>>> The latest Featured Stock Update with an annotated graph appeared on 12/27/2012. Click here.
View all notes |
Alert me of new notes |
CANSLIM.net Company Profile |
SEC |
Zacks Reports |
StockTalk |
News |
Chart |
Request a new note
C
A N
S L
I M
|
LULU
-
NASDAQ
Lululemon Athletica
MANUFACTURING - Textile Manufacturing
|
$71.10
|
-0.85
-1.18% |
$72.02
|
2,564,309
129.13% of 50 DAV
50 DAV is 1,985,800
|
$81.09
-12.32%
|
12/26/2012
|
$73.81
|
PP = $77.95
|
|
MB = $81.85
|
Most Recent Note - 1/4/2013 10:37:37 AM
G - Gapped down today and violated its 50 DMA line raising more serious concerns and its color code is changed to green. The "negative reversal" on 1/02/13 raised concerns when last noted - "Subsequent volume-driven gains above its pivot point are still needed to trigger a new technical buy signal."
>>> The latest Featured Stock Update with an annotated graph appeared on 12/28/2012. Click here.
View all notes |
Alert me of new notes |
CANSLIM.net Company Profile |
SEC |
Zacks Reports |
StockTalk |
News |
Chart |
Request a new note
C
A N
S L
I M
|
MIDD
-
NASDAQ
Middleby Corp
MANUFACTURING - Diversified Machinery
|
$131.66
|
+1.21
0.93% |
$132.80
|
57,477
65.24% of 50 DAV
50 DAV is 88,100
|
$134.51
-2.12%
|
10/8/2012
|
$118.46
|
PP = $122.67
|
|
MB = $128.80
|
Most Recent Note - 1/2/2013 4:11:05 PM
G - Gapped up today and challenged its 52-week and all-time high with a volume-driven gain. Earnings +23% on +18% sales for the Sep '12 quarter, below the +25% minimum earnings guideline (C criteria), raised concerns.
>>> The latest Featured Stock Update with an annotated graph appeared on 12/26/2012. Click here.
View all notes |
Alert me of new notes |
CANSLIM.net Company Profile |
SEC |
Zacks Reports |
StockTalk |
News |
Chart |
Request a new note
C
A N
S L
I M
|
Symbol/Exchange
Company Name
Industry Group |
PRICE |
CHANGE
(%Change) |
Day High |
Volume
(% DAV)
(% 50 day avg vol) |
52 Wk Hi
% From Hi |
Featured
Date |
Price
Featured |
Pivot Featured |
|
Max Buy |
N
-
NYSE
Netsuite Inc
DIVERSIFIED SERVICES - Business/Management Services
|
$67.78
|
-0.36
-0.53% |
$68.44
|
184,347
41.74% of 50 DAV
50 DAV is 441,700
|
$70.06
-3.25%
|
12/12/2012
|
$64.75
|
PP = $67.12
|
|
MB = $70.48
|
Most Recent Note - 1/4/2013 5:25:16 PM
Y - Tallied another gain above its pivot point marked by light volume. Disciplined investors know that volume must be at least +40% above average behind gains above the pivot point to trigger a proper technical buy signal. See the latest FSU analysis for more details and a new annotated graph.
>>> The latest Featured Stock Update with an annotated graph appeared on 1/4/2013. Click here.
View all notes |
Alert me of new notes |
CANSLIM.net Company Profile |
SEC |
Zacks Reports |
StockTalk |
News |
Chart |
Request a new note
C
A N
S L
I M
|
NSR
-
NYSE
Neustar Inc
TELECOMMUNICATIONS - Diversified Communication Serv
|
$42.95
|
-0.13
-0.30% |
$43.44
|
408,019
101.95% of 50 DAV
50 DAV is 400,200
|
$43.90
-2.16%
|
12/11/2012
|
$41.85
|
PP = $41.41
|
|
MB = $43.48
|
Most Recent Note - 1/2/2013 4:14:55 PM
G - Gapped up and rallied above its "max buy" level with a volume-driven gain and its color code is changed to green. Subsequent deterioration below its old high close ($41.05 on 10/05/12) could negate its recent breakout, a worrisome sign.
>>> The latest Featured Stock Update with an annotated graph appeared on 1/2/2013. Click here.
View all notes |
Alert me of new notes |
CANSLIM.net Company Profile |
SEC |
Zacks Reports |
StockTalk |
News |
Chart |
Request a new note
C
A N
S L
I M
|
RAX
-
NYSE
Rackspace Hosting Inc
INTERNET - Internet Software and; Services
|
$75.76
|
-0.55
-0.72% |
$76.08
|
896,678
62.56% of 50 DAV
50 DAV is 1,433,400
|
$77.13
-1.78%
|
12/18/2012
|
$71.88
|
PP = $70.10
|
|
MB = $73.61
|
Most Recent Note - 1/2/2013 4:17:04 PM
G - Wedged to a new all-time high above its "max buy" level with today's gain lacking great volume conviction and its color code is changed to green. Prior highs in the $70 area define initial support to watch following its recent breakout.
>>> The latest Featured Stock Update with an annotated graph appeared on 12/18/2012. Click here.
View all notes |
Alert me of new notes |
CANSLIM.net Company Profile |
SEC |
Zacks Reports |
StockTalk |
News |
Chart |
Request a new note
C
A N
S L
I M
|
RNF
-
NYSE
Rentech Nitrogen Ptnr Lp
CHEMICALS - Agricultural Chemicals
|
$42.57
|
+2.27
5.63% |
$43.24
|
716,479
244.28% of 50 DAV
50 DAV is 293,300
|
$41.15
3.45%
|
11/1/2012
|
$39.11
|
PP = $40.15
|
|
MB = $42.16
|
Most Recent Note - 1/7/2013 6:00:19 PM
G - Clinched a technical buy signal and rallied above resistance in the $40 area with today's 6th consecutive gain backed by above average volume. Trading above its "max buy" level, its color code was changed to green.
>>> The latest Featured Stock Update with an annotated graph appeared on 12/19/2012. Click here.
View all notes |
Alert me of new notes |
CANSLIM.net Company Profile |
SEC |
Zacks Reports |
StockTalk |
News |
Chart |
Request a new note
C
A N
S L
I M
|
ULTA
-
NASDAQ
Ulta Salon Cosm & Frag
SPECIALTY RETAIL - Specialty Retail, Other
|
$96.32
|
-1.53
-1.56% |
$98.15
|
875,790
113.31% of 50 DAV
50 DAV is 772,900
|
$103.52
-6.96%
|
12/4/2012
|
$100.29
|
PP = $103.62
|
|
MB = $108.80
|
Most Recent Note - 1/7/2013 6:03:17 PM
Slumped further today after a damaging gap down on the prior session, retreating with above average volume after challenging its 52-week high and previously stubborn resistance. Its Relative Strength rank has slumped to a sub par 65 rating, and as previously noted the RS line did not confirm a move into new high territory. Based on weak action it will be dropped from the Featured Stocks list tonight.
>>> The latest Featured Stock Update with an annotated graph appeared on 12/21/2012. Click here.
View all notes |
Alert me of new notes |
CANSLIM.net Company Profile |
SEC |
Zacks Reports |
StockTalk |
News |
Chart |
Request a new note
C
A N
S L
I M
|
Symbol/Exchange
Company Name
Industry Group |
PRICE |
CHANGE
(%Change) |
Day High |
Volume
(% DAV)
(% 50 day avg vol) |
52 Wk Hi
% From Hi |
Featured
Date |
Price
Featured |
Pivot Featured |
|
Max Buy |
VRX
-
NYSE
Valeant Pharmaceuticals
DRUGS - Drug Manufacturers - Other
|
$61.31
|
+0.60
0.99% |
$61.38
|
1,209,421
79.71% of 50 DAV
50 DAV is 1,517,300
|
$61.61
-0.49%
|
12/20/2012
|
$60.24
|
PP = $61.21
|
|
MB = $64.27
|
Most Recent Note - 1/4/2013 12:59:32 PM
Y - Up from earlier lows, finding prompt support after a weak start to today's session. This week's streak of 3 consecutive gains with above average volume still left it below its pivot point. Disciplined investors may use a tactic called "pyramiding" to allow market action to dictate their positioning.
>>> The latest Featured Stock Update with an annotated graph appeared on 12/20/2012. Click here.
View all notes |
Alert me of new notes |
CANSLIM.net Company Profile |
SEC |
Zacks Reports |
StockTalk |
News |
Chart |
Request a new note
C
A N
S L
I M
|
VSI
-
NYSE
Vitamin Shoppe Inc
SPECIALTY RETAIL - Specialty Retail, Other
|
$55.88
|
-0.52
-0.92% |
$56.34
|
253,901
94.21% of 50 DAV
50 DAV is 269,500
|
$61.89
-9.71%
|
12/3/2012
|
$59.06
|
PP = $61.99
|
|
MB = $65.09
|
Most Recent Note - 1/7/2013 5:58:49 PM
Sputtering below its 50 DMA line and its Relative Strength rating has slumped to a 72, well below the 80+ minimum guideline for buy candidates. Based on weak action it will be dropped from the Featured Stocks list tonight. Prior lows and its 200 DMA line define important near-term support to watch in the $53 area. However, it faces resistance due to overhead supply up through the $61 level which has been a stubborn resistance level in recent months.
>>> The latest Featured Stock Update with an annotated graph appeared on 12/24/2012. Click here.
View all notes |
Alert me of new notes |
CANSLIM.net Company Profile |
SEC |
Zacks Reports |
StockTalk |
News |
Chart |
Request a new note
C
A N
S L
I M
|
WPI
-
NYSE
Watson Pharmaceuticals
DRUGS - Drugs - Generic
|
$85.66
|
+0.36
0.42% |
$85.86
|
1,009,702
108.83% of 50 DAV
50 DAV is 927,800
|
$91.47
-6.35%
|
12/17/2012
|
$87.99
|
PP = $90.49
|
|
MB = $95.01
|
Most Recent Note - 1/7/2013 5:56:02 PM
Halted its slide after damaging volume-driven losses last week triggered a technical sell signal. Based on weaker fundamentals and deteriorating technical stance it will be dropped from the Featured Stocks list tonight. See the latest FSU analysis for more details and a new annotated graph.
>>> The latest Featured Stock Update with an annotated graph appeared on 1/7/2013. Click here.
View all notes |
Alert me of new notes |
CANSLIM.net Company Profile |
SEC |
Zacks Reports |
StockTalk |
News |
Chart |
Request a new note
C
A N
S L
I M
|
|
|
|
THESE ARE NOT BUY RECOMMENDATIONS!
Comments contained in the body of this report are technical
opinions only. The material herein has been obtained
from sources believed to be reliable and accurate, however,
its accuracy and completeness cannot be guaranteed.
This site is not an investment advisor, hence it does
not endorse or recommend any securities or other investments.
Any recommendation contained in this report may not
be suitable for all investors and it is not to be deemed
an offer or solicitation on our part with respect to
the purchase or sale of any securities. All trademarks,
service marks and trade names appearing in this report
are the property of their respective owners, and are
likewise used for identification purposes only.
This report is a service available
only to active Paid Premium Members.
You may opt-out of receiving report notifications
at any time. Questions or comments may be submitted
by writing to Premium Membership Services 665 S.E. 10 Street, Suite 201 Deerfield Beach, FL 33441-5634 or by calling 1-800-965-8307
or 954-785-1121.
|
|
|

