You are not logged in.
This means you
CAN ONLY VIEW reports that were published prior to Tuesday, April 15, 2025.
You
MUST UPGRADE YOUR MEMBERSHIP if you want to see any current reports.
AFTER MARKET UPDATE - FRIDAY, JANUARY 4TH, 2013
Previous After Market Report Next After Market Report >>>
|
|
|
|
DOW |
+43.85 |
13,435.21 |
+0.33% |
|
Volume |
651,279,910 |
-8% |
|
Volume |
1,715,327,280 |
+2% |
|
NASDAQ |
+1.09 |
3,101.66 |
+0.04% |
|
Advancers |
2,314 |
74% |
|
Advancers |
1,600 |
62% |
|
S&P 500 |
+7.10 |
1,466.47 |
+0.49% |
|
Decliners |
703 |
22% |
|
Decliners |
868 |
34% |
|
Russell 2000 |
+6.59 |
879.15 |
+0.76% |
|
52 Wk Highs |
267 |
|
|
52 Wk Highs |
133 |
|
|
S&P 600 |
+3.44 |
492.61 |
+0.70% |
|
52 Wk Lows |
2 |
|
|
52 Wk Lows |
6 |
|
|
 |
S&P 500 Index Posted Best Weekly Gain in 13 Months
Kenneth J. Gruneisen - Passed the CAN SLIM® Master's Exam
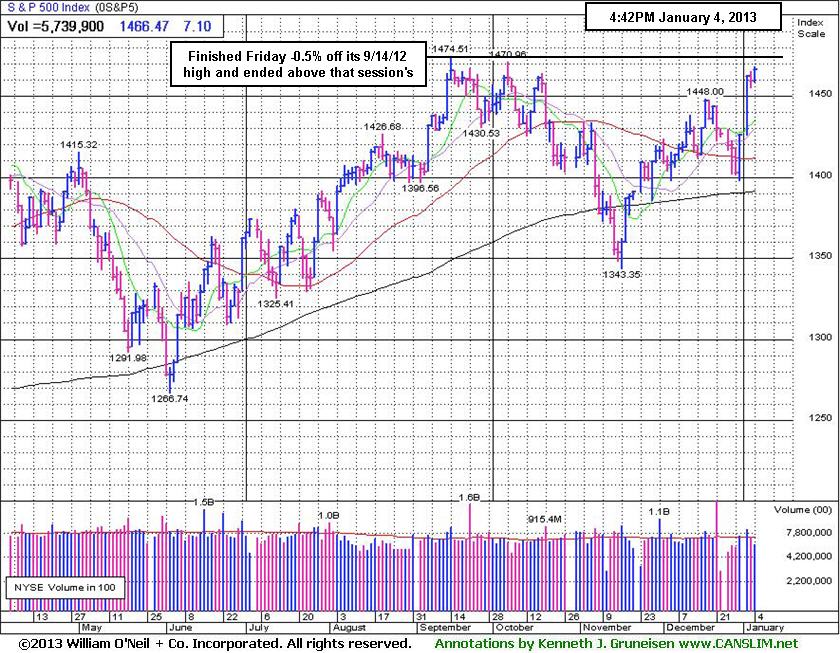
The major averages posted encouraging weekly gains as the Dow Jones Industrial Average rose nearly +3.8%, the S&P 500 Index enjoyed its biggest weekly rally in 13 months with an increase of +4.6%, and the Nasdaq Composite Index rallied nearly +4.8%. The major averages finished Friday with gains while the volume totals were reported mixed, lighter on the NYSE and slightly higher on the Nasdaq exchange. Advancers led decliners by more than a 3-1 margin on the NYSE and by almost a 2-1 margin on the Nasdaq exchange. The total number of stocks hitting new 52-week highs easily outnumbered new 52-week lows on the NYSE and on the Nasdaq exchange, and new lows were in the single digits on both the NYSE and on the Nasdaq exchange. There were 87 high-ranked companies from the CANSLIM.net Leaders List making new 52-week highs and appearing on the CANSLIM.net BreakOuts Page, down from the prior session total of 107 stocks. Any sustainable rally requires a healthy crop of companies hitting new 52-week highs, so it was encouraging this week to see a great expansion in new leadership. There were gains for only 6 of the 13 high-ranked companies currently included on the Featured Stocks Page, a disconcertingly weak showing versus the broader market's clearly bullish breadth.
Nonfarm payrolls rose by 155,000 in December following an upwardly revised 161,000 advance in November. Meanwhile, the unemployment rate held at 7.8%, matching the lowest since December 2008. Other data was mixed. Services industries expanded at the fastest pace in 10 months as the ISM non-manufacturing index unexpectedly climbed to 56.1 in December from 54.7. However, factory orders were unchanged in November, hurt by a drop in non-durable goods.
Nine of ten sectors were higher on Friday, and material, energy, and financial stocks were the best performing groups. The Mosaic Company (MOS +3.26%) and Schlumberger Ltd (SLB +1.54%) traded higher, and JP Morgan Chase & Co (JPM +1.77%) rallied. Technology was the sole laggard, weighed down by losses in Apple Inc (AAPL -2.78%).
In fixed-income, Treasuries snapped three straight days of losses as the 10-year note gained 2/32 to yield 1.91%.
Investors may consider new buying efforts in stocks meeting all key criteria, as the market's (M criteria) confirmed uptrend showed a great expansion in leadership (stocks hitting new 52-week highs) after overcoming recent pressure. Solid gains helped the benchmark S&P 500 Index promptly rebound above its 50-day moving average (DMA) line, and Nasdaq Composite Index and Dow Jones Industrial Average both promptly rebounded above their respective 50 DMA and 200 DMA lines at the start of the week. All of the major averages then blasted above their December highs with additional volume-driven gains.
Watch for an announcement via email concerning the next WEBCAST. The webcast will also be available via an updated link highlighted at the top of the Premium Member Homepage.
PICTURED: The benchmark S&P 500 Index finished -0.5% off its 9/14/12 high and ended above that session's close. It enjoyed its biggest weekly rally in 13 months with an increase of +4.6%.
|
 Kenneth J. Gruneisen started out as a licensed stockbroker in August 1987, a couple of months prior to the historic stock market crash that took the Dow Jones Industrial Average down -22.6% in a single day. He has published daily fact-based fundamental and technical analysis on high-ranked stocks online for two decades. Through FACTBASEDINVESTING.COM, Kenneth provides educational articles, news, market commentary, and other information regarding proven investment systems that work in good times and bad.
Comments contained in the body of this report are technical opinions only and are not necessarily those of Gruneisen Growth Corp. The material herein has been obtained from sources believed to be reliable and accurate, however, its accuracy and completeness cannot be guaranteed. Our firm, employees, and customers may effect transactions, including transactions contrary to any recommendation herein, or have positions in the securities mentioned herein or options with respect thereto. Any recommendation contained in this report may not be suitable for all investors and it is not to be deemed an offer or solicitation on our part with respect to the purchase or sale of any securities. |
|
 |
Strength in Important Group Known as a "Leading Indicator"
Kenneth J. Gruneisen - Passed the CAN SLIM® Master's Exam
Energy-related shares were among Friday's best gainers as the Integrated Oil Index ($XOI +1.04%) and the Oil Services Index ($OSX +2.30%) advanced. Financial shares also were a positive influence on the major averages as the Broker/Dealer Index ($XBD +1.55%) and the Bank Index ($BKX +1.68%) tallied solid gains. The Networking Index ($NWX +2.78%) led the tech sector higher while the Biotechnology Index ($BTK +0.31%) and the Internet Index ($IIX +0.46%) posted smaller gains and the Semiconductor Index ($SOX +0.04%) ended unchanged. The Retail Index ($RLX +0.30%) edged higher, and gains for defensive groups including the Gold & Silver Index ($XAU +0.23%) and the Healthcare Index ($HMO +0.96%) rounded out the mostly positive session.
Charts courtesy www.stockcharts.com
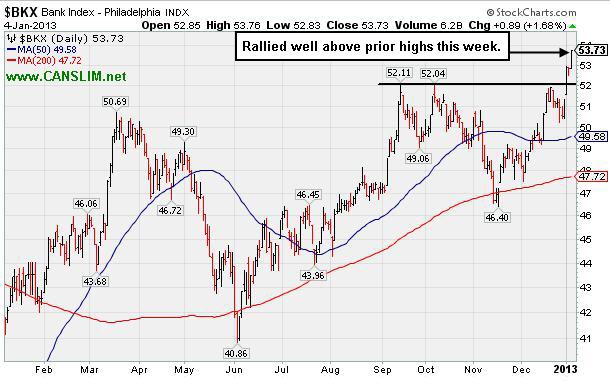
PICTURED: The Bank Index ($BKX +1.68%) rallied well above prior highs this week. Longtime readers of this commentary know that financial shares are recognized important "leading indicators", so the strengh bodes well for the broader market outlook.
| Oil Services |
$OSX |
232.54 |
+5.22 |
+2.30% |
+5.62% |
| Healthcare |
$HMO |
2,495.10 |
+23.70 |
+0.96% |
-0.76% |
| Integrated Oil |
$XOI |
1,278.10 |
+13.20 |
+1.04% |
+2.92% |
| Semiconductor |
$SOX |
397.68 |
+0.14 |
+0.04% |
+3.55% |
| Networking |
$NWX |
239.37 |
+6.47 |
+2.78% |
+5.66% |
| Internet |
$IIX |
336.68 |
+1.53 |
+0.46% |
+2.96% |
| Broker/Dealer |
$XBD |
98.80 |
+1.51 |
+1.55% |
+4.74% |
| Retail |
$RLX |
667.19 |
+2.01 |
+0.30% |
+2.16% |
| Gold & Silver |
$XAU |
162.53 |
+0.37 |
+0.23% |
-1.85% |
| Bank |
$BKX |
53.73 |
+0.89 |
+1.68% |
+4.78% |
| Biotech |
$BTK |
1,616.00 |
+4.94 |
+0.31% |
+4.46% |
|
|
|
 |
Wedging Action is Not an Encouraging Surge to New Highs
Kenneth J. Gruneisen - Passed the CAN SLIM® Master's Exam
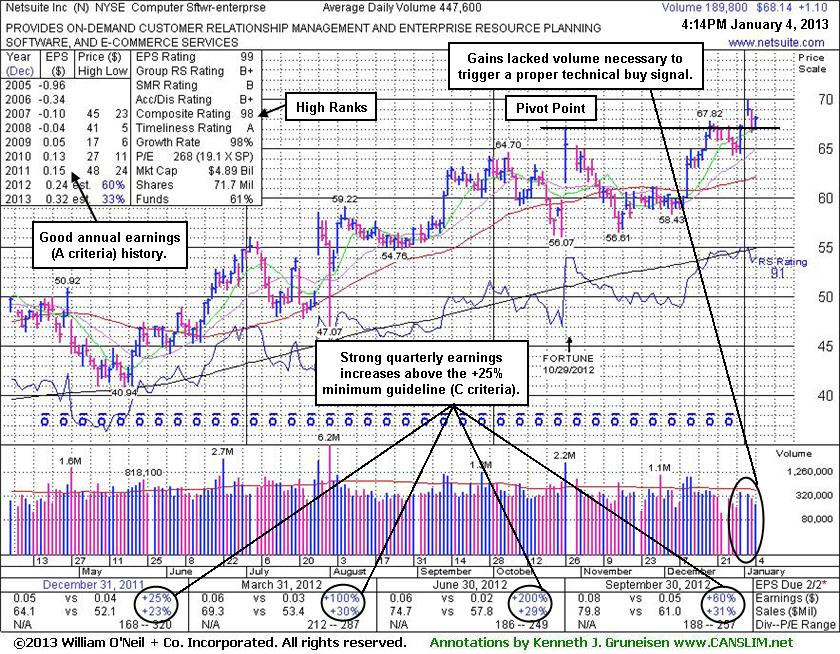
Netsuite Inc (N +$1.26 or +1.88% to $68.30) traded above its pivot point this week, however its gains were marked by light volume. That kind of action is technically termed "wedging" and it does not have the look of hearty buying demand coming from the institutional crowd. Disciplined investors know that volume must be at least +40% above average behind gains above the pivot point to trigger a proper technical buy signal. Without heavy volume behind a stock's breakout investors have little reason to believe sufficient buying demand is lurking to allow for it to make a meaningful and sustained advance in price.
It was last shown in this FSU section on 12/13/12 with an annotated graph under the headline, "Still Forming New Base Awaiting Fresh Technical Breakout", after highlighted in yellow in the 12/12/12 mid-day report with a new pivot point cited based on its 10/26/12 high plus 10 cents (read here). It rallied above its 50-day moving average (DMA) line with 3 consecutive volume-driven gains while working up toward prior highs, but subsequent gains into new high territory lacked great volume conviction.
The high-ranked Computer Software -Enterprise firm reported earnings +60% on +31% sales revenues for the quarter ended September 30, 2012 versus the year ago period. Earnings increased above the +25% minimum earnings guideline (C criteria) in the 5 latest quarterly comparisons. Its annual earnings (A criteria) history improved from losses prior to FY '09. The number of top-rated funds owning its shares rose from 201 in Jun '11 to 291 in Dec '12, a reassuring sign concerning the I criteria. The Computer Software -Enterprise group has a Group Relative Strength Rating of B+, a reassuring sign concerning the L criteria.
Disciplined investors use a tactic that they teach in the Certification program called "pyramiding", a method of staggering multiple buy orders which allows the ongoing market action to dictate their weighting in new buy candidates. Always limit losses by selling if any stock falls more than -7% from the purchase price. If a stock strengthens after it is sold it can always be bought back, but following strict selling rules is what keeps an investor from letting small losses become large losses. In a bullish market environment, leading stocks often flash numerous buy signals from multiple-bases.
|
|
|
Color Codes Explained :
Y - Better candidates highlighted by our
staff of experts.
G - Previously featured
in past reports as yellow but may no longer be buyable under the
guidelines.
***Last / Change / Volume data in this table is the closing quote data***
Symbol/Exchange
Company Name
Industry Group |
PRICE |
CHANGE
(%Change) |
Day High |
Volume
(% DAV)
(% 50 day avg vol) |
52 Wk Hi
% From Hi |
Featured
Date |
Price
Featured |
Pivot Featured |
|
Max Buy |
CELG
-
NASDAQ
Celgene Corp
DRUGS - Drug Manufacturers - Major
|
$82.09
|
+0.42
0.51% |
$83.17
|
2,987,860
104.14% of 50 DAV
50 DAV is 2,869,200
|
$82.78
-0.83%
|
12/11/2012
|
$82.24
|
PP = $81.34
|
|
MB = $85.41
|
Most Recent Note - 1/3/2013 5:54:30 PM
Y - Its 50 DMA acted as support during the recent consolidation, but waning RS Rating is cause for concern. See latest FSU analysis for more details and a new annotated graph.
>>> The latest Featured Stock Update with an annotated graph appeared on 1/3/2013. Click here.
View all notes |
Alert me of new notes |
CANSLIM.net Company Profile |
SEC |
Zacks Reports |
StockTalk |
News |
Chart |
Request a new note
C
A N
S L
I M


|
CFNL
-
NASDAQ
Cardinal Financial Corp
BANKING - Regional - Southeast Banks
|
$16.60
|
+0.14
0.85% |
$16.62
|
197,185
91.16% of 50 DAV
50 DAV is 216,300
|
$16.90
-1.78%
|
12/3/2012
|
$15.20
|
PP = $16.31
|
|
MB = $17.13
|
Most Recent Note - 1/2/2013 4:07:21 PM
Y - Today's gain for a new 52-week high cleared its pivot point with sufficient volume to trigger a proper new (or add-on) technical buy signal.
>>> The latest Featured Stock Update with an annotated graph appeared on 12/31/2012. Click here.
View all notes |
Alert me of new notes |
CANSLIM.net Company Profile |
SEC |
Zacks Reports |
StockTalk |
News |
Chart |
Request a new note
C
A N
S L
I M
|
CMCSA
-
NASDAQ
Comcast Corp Cl A
MEDIA - CATV Systems
|
$38.07
|
-0.02
-0.05% |
$38.29
|
9,517,487
79.01% of 50 DAV
50 DAV is 12,045,200
|
$38.58
-1.32%
|
12/3/2012
|
$37.08
|
PP = $38.06
|
|
MB = $39.96
|
Most Recent Note - 1/2/2013 4:08:50 PM
Y - Today's gain above its pivot point had sufficient volume to trigger a technical buy signal. No resistance remains due to overhead supply.
>>> The latest Featured Stock Update with an annotated graph appeared on 12/27/2012. Click here.
View all notes |
Alert me of new notes |
CANSLIM.net Company Profile |
SEC |
Zacks Reports |
StockTalk |
News |
Chart |
Request a new note
C
A N
S L
I M
|
LULU
-
NASDAQ
Lululemon Athletica
MANUFACTURING - Textile Manufacturing
|
$71.95
|
-3.14
-4.18% |
$72.55
|
6,141,235
310.87% of 50 DAV
50 DAV is 1,975,500
|
$81.09
-11.27%
|
12/26/2012
|
$73.81
|
PP = $77.95
|
|
MB = $81.85
|
 Most Recent Note - 1/4/2013 10:37:37 AM
G - Gapped down today and violated its 50 DMA line raising more serious concerns and its color code is changed to green. The "negative reversal" on 1/02/13 raised concerns when last noted - "Subsequent volume-driven gains above its pivot point are still needed to trigger a new technical buy signal."
>>> The latest Featured Stock Update with an annotated graph appeared on 12/28/2012. Click here.
View all notes |
Alert me of new notes |
CANSLIM.net Company Profile |
SEC |
Zacks Reports |
StockTalk |
News |
Chart |
Request a new note
C
A N
S L
I M
|
MIDD
-
NASDAQ
Middleby Corp
MANUFACTURING - Diversified Machinery
|
$130.45
|
+0.30
0.23% |
$131.57
|
59,877
67.58% of 50 DAV
50 DAV is 88,600
|
$134.51
-3.02%
|
10/8/2012
|
$118.46
|
PP = $122.67
|
|
MB = $128.80
|
Most Recent Note - 1/2/2013 4:11:05 PM
G - Gapped up today and challenged its 52-week and all-time high with a volume-driven gain. Earnings +23% on +18% sales for the Sep '12 quarter, below the +25% minimum earnings guideline (C criteria), raised concerns.
>>> The latest Featured Stock Update with an annotated graph appeared on 12/26/2012. Click here.
View all notes |
Alert me of new notes |
CANSLIM.net Company Profile |
SEC |
Zacks Reports |
StockTalk |
News |
Chart |
Request a new note
C
A N
S L
I M
|
Symbol/Exchange
Company Name
Industry Group |
PRICE |
CHANGE
(%Change) |
Day High |
Volume
(% DAV)
(% 50 day avg vol) |
52 Wk Hi
% From Hi |
Featured
Date |
Price
Featured |
Pivot Featured |
|
Max Buy |
N
-
NYSE
Netsuite Inc
DIVERSIFIED SERVICES - Business/Management Services
|
$68.14
|
+1.10
1.64% |
$68.34
|
201,442
45.00% of 50 DAV
50 DAV is 447,600
|
$70.06
-2.74%
|
12/12/2012
|
$64.75
|
PP = $67.12
|
|
MB = $70.48
|
Most Recent Note - 1/4/2013 5:25:16 PM
Y - Tallied another gain above its pivot point marked by light volume. Disciplined investors know that volume must be at least +40% above average behind gains above the pivot point to trigger a proper technical buy signal. See the latest FSU analysis for more details and a new annotated graph.
>>> The latest Featured Stock Update with an annotated graph appeared on 1/4/2013. Click here.
View all notes |
Alert me of new notes |
CANSLIM.net Company Profile |
SEC |
Zacks Reports |
StockTalk |
News |
Chart |
Request a new note
C
A N
S L
I M
|
NSR
-
NYSE
Neustar Inc
TELECOMMUNICATIONS - Diversified Communication Serv
|
$43.08
|
-0.10
-0.23% |
$43.31
|
363,297
91.19% of 50 DAV
50 DAV is 398,400
|
$43.90
-1.87%
|
12/11/2012
|
$41.85
|
PP = $41.41
|
|
MB = $43.48
|
Most Recent Note - 1/2/2013 4:14:55 PM
G - Gapped up and rallied above its "max buy" level with a volume-driven gain and its color code is changed to green. Subsequent deterioration below its old high close ($41.05 on 10/05/12) could negate its recent breakout, a worrisome sign.
>>> The latest Featured Stock Update with an annotated graph appeared on 1/2/2013. Click here.
View all notes |
Alert me of new notes |
CANSLIM.net Company Profile |
SEC |
Zacks Reports |
StockTalk |
News |
Chart |
Request a new note
C
A N
S L
I M
|
RAX
-
NYSE
Rackspace Hosting Inc
INTERNET - Internet Software and; Services
|
$76.31
|
+0.93
1.23% |
$76.49
|
510,480
35.20% of 50 DAV
50 DAV is 1,450,300
|
$77.13
-1.06%
|
12/18/2012
|
$71.88
|
PP = $70.10
|
|
MB = $73.61
|
Most Recent Note - 1/2/2013 4:17:04 PM
G - Wedged to a new all-time high above its "max buy" level with today's gain lacking great volume conviction and its color code is changed to green. Prior highs in the $70 area define initial support to watch following its recent breakout.
>>> The latest Featured Stock Update with an annotated graph appeared on 12/18/2012. Click here.
View all notes |
Alert me of new notes |
CANSLIM.net Company Profile |
SEC |
Zacks Reports |
StockTalk |
News |
Chart |
Request a new note
C
A N
S L
I M
|
RNF
-
NYSE
Rentech Nitrogen Ptnr Lp
CHEMICALS - Agricultural Chemicals
|
$40.30
|
+0.65
1.64% |
$40.56
|
293,951
100.50% of 50 DAV
50 DAV is 292,500
|
$41.15
-2.07%
|
11/1/2012
|
$39.11
|
PP = $40.15
|
|
MB = $42.16
|
Most Recent Note - 1/2/2013 12:09:40 PM
Y - Off earlier highs following a gap up today that had it trading near its pivot point and challenging previously stubborn resistance in the $40 area. While patient investors may still be watching for a technical buy signal, a violation of its recent low ($36.06 on 12/18/12) would raise more serious concerns and could trigger a technical sell signal.
>>> The latest Featured Stock Update with an annotated graph appeared on 12/19/2012. Click here.
View all notes |
Alert me of new notes |
CANSLIM.net Company Profile |
SEC |
Zacks Reports |
StockTalk |
News |
Chart |
Request a new note
C
A N
S L
I M
|
ULTA
-
NASDAQ
Ulta Salon Cosm & Frag
SPECIALTY RETAIL - Specialty Retail, Other
|
$97.85
|
-4.14
-4.06% |
$99.41
|
1,906,534
254.20% of 50 DAV
50 DAV is 750,000
|
$103.52
-5.48%
|
12/4/2012
|
$100.29
|
PP = $103.62
|
|
MB = $108.80
|
Most Recent Note - 1/4/2013 12:55:26 PM
Y - Gapped down today, retreating with above average volume after challenging its 52-week high and previously stubborn resistance. Its 50 DMA line recently acted as support. Its Relative Strength line did not recently lead the way and confirm a move into new high territory.
>>> The latest Featured Stock Update with an annotated graph appeared on 12/21/2012. Click here.
View all notes |
Alert me of new notes |
CANSLIM.net Company Profile |
SEC |
Zacks Reports |
StockTalk |
News |
Chart |
Request a new note
C
A N
S L
I M
|
Symbol/Exchange
Company Name
Industry Group |
PRICE |
CHANGE
(%Change) |
Day High |
Volume
(% DAV)
(% 50 day avg vol) |
52 Wk Hi
% From Hi |
Featured
Date |
Price
Featured |
Pivot Featured |
|
Max Buy |
VRX
-
NYSE
Valeant Pharmaceuticals
DRUGS - Drug Manufacturers - Other
|
$60.71
|
-0.36
-0.59% |
$61.13
|
3,049,313
204.73% of 50 DAV
50 DAV is 1,489,400
|
$61.61
-1.46%
|
12/20/2012
|
$60.24
|
PP = $61.21
|
|
MB = $64.27
|
Most Recent Note - 1/4/2013 12:59:32 PM
Y - Up from earlier lows, finding prompt support after a weak start to today's session. This week's streak of 3 consecutive gains with above average volume still left it below its pivot point. Disciplined investors may use a tactic called "pyramiding" to allow market action to dictate their positioning.
>>> The latest Featured Stock Update with an annotated graph appeared on 12/20/2012. Click here.
View all notes |
Alert me of new notes |
CANSLIM.net Company Profile |
SEC |
Zacks Reports |
StockTalk |
News |
Chart |
Request a new note
C
A N
S L
I M
|
VSI
-
NYSE
Vitamin Shoppe Inc
SPECIALTY RETAIL - Specialty Retail, Other
|
$56.40
|
-0.12
-0.21% |
$56.89
|
355,139
133.66% of 50 DAV
50 DAV is 265,700
|
$61.89
-8.87%
|
12/3/2012
|
$59.06
|
PP = $61.99
|
|
MB = $65.09
|
Most Recent Note - 1/2/2013 4:25:58 PM
G - Reversed into the red for worrisome loss on higher volume after starting in positive territory today. Prior lows and its 200 DMA line define important near-term support to watch in the $53 area. It faces resistance due to overhead supply up through the $61 level which has been a stubborn resistance level in recent months.
>>> The latest Featured Stock Update with an annotated graph appeared on 12/24/2012. Click here.
View all notes |
Alert me of new notes |
CANSLIM.net Company Profile |
SEC |
Zacks Reports |
StockTalk |
News |
Chart |
Request a new note
C
A N
S L
I M
|
WPI
-
NYSE
Watson Pharmaceuticals
DRUGS - Drugs - Generic
|
$85.30
|
-0.62
-0.72% |
$86.24
|
1,414,375
154.44% of 50 DAV
50 DAV is 915,800
|
$91.47
-6.75%
|
12/17/2012
|
$87.99
|
PP = $90.49
|
|
MB = $95.01
|
Most Recent Note - 1/3/2013 12:32:28 PM
G - Halting its 6-session losing streak with today's gain. Its 50 DMA line may now act as resistance following damaging volume-driven losses this week that triggered a technical sell signal.
>>> The latest Featured Stock Update with an annotated graph appeared on 12/17/2012. Click here.
View all notes |
Alert me of new notes |
CANSLIM.net Company Profile |
SEC |
Zacks Reports |
StockTalk |
News |
Chart |
Request a new note
C
A N
S L
I M
|
|
|
|
THESE ARE NOT BUY RECOMMENDATIONS!
Comments contained in the body of this report are technical
opinions only. The material herein has been obtained
from sources believed to be reliable and accurate, however,
its accuracy and completeness cannot be guaranteed.
This site is not an investment advisor, hence it does
not endorse or recommend any securities or other investments.
Any recommendation contained in this report may not
be suitable for all investors and it is not to be deemed
an offer or solicitation on our part with respect to
the purchase or sale of any securities. All trademarks,
service marks and trade names appearing in this report
are the property of their respective owners, and are
likewise used for identification purposes only.
This report is a service available
only to active Paid Premium Members.
You may opt-out of receiving report notifications
at any time. Questions or comments may be submitted
by writing to Premium Membership Services 665 S.E. 10 Street, Suite 201 Deerfield Beach, FL 33441-5634 or by calling 1-800-965-8307
or 954-785-1121.
|
|
|

