You are not logged in.
This means you
CAN ONLY VIEW reports that were published prior to Monday, April 14, 2025.
You
MUST UPGRADE YOUR MEMBERSHIP if you want to see any current reports.
AFTER MARKET UPDATE - THURSDAY, JANUARY 7TH, 2010
Previous After Market Report Next After Market Report >>>
|
|
|
|
DOW |
+33.18 |
10,606.86 |
+0.31% |
|
Volume |
1,192,893,910 |
+7% |
|
Volume |
2,401,602,830 |
+4% |
|
NASDAQ |
-1.04 |
2,300.05 |
-0.05% |
|
Advancers |
1,872 |
60% |
|
Advancers |
1,602 |
56% |
|
S&P 500 |
+4.55 |
1,141.69 |
+0.40% |
|
Decliners |
1,183 |
38% |
|
Decliners |
1,141 |
40% |
|
Russell 2000 |
+4.02 |
641.97 |
+0.63% |
|
52 Wk Highs |
342 |
|
|
52 Wk Highs |
118 |
|
|
S&P 600 |
+2.24 |
340.39 |
+0.66% |
|
52 Wk Lows |
3 |
|
|
52 Wk Lows |
4 |
|
|
 |
Mixed Action Continues For Major Indices
Adam Sarhan, Contributing Writer,
The major averages ended mixed for a third consecutive session after positive retail sales and weekly jobless claims were released. Volume, an important indicator of institutional sponsorship, was reported slightly higher than Wednesday's totals which indicated large institutions were not aggressively dumping stocks. Advancers led decliners by a 3-to-2 ratio on the NYSE and by a 4-to-3 ratio on the Nasdaq exchange. There were 32 high-ranked companies from the CANSLIM.net Leaders List that made a new 52-week high and appeared on the CANSLIM.net BreakOuts Page, lower than the total of 57 issues that appeared on the prior session. New 52-week highs solidly outnumbered new 52-week lows on the NYSE and on the Nasdaq exchange, and new lows were again in the single digits.
At 8:30AM EST, the Labor Department said new claims for unemployment benefits rose less than forecast to +434,000 in the week ending January 2, 2010. Every Thursday, the Labor Department releases the report which compiles data showing the number of individuals who filed for unemployment insurance for the first time. Remember, the report is counter intuitive because an increasing number means more people are filing for unemployment claims and suggests the labor market is waning. The converse is also true, lower readings is a sign of strength. Investors tend to look at the four-week moving average because it smooths out weekly volatility. Investors are now focused on December's employment report which is slated to be released before Friday's opening bell. Analysts believe that last month's reading will be unchanged which bodes well for the ailing jobs market. So far, since the recession began, US employers slashed over 7 million jobs as the unemployment rate hit a two decade high of 10.2% last quarter.
Before Thursday's open, chain stores across the country released retail sales figures for December. On average, retail sales were reported higher at many chain stores last month which helped send their share prices higher today. The stronger than expected data also bodes well for last quarter's GDP. High-end jeweler Tiffany & Co. (TIF +4.29%) surged to a new 52-week high on heavy volume after reporting solid results and raising guidance. Even low-end retailers rallied, TJX Cos (TJX +5.11%) which operates TJ MAXX and Marshalls, gapped above its 50 day moving average line on monstrous trade. Sears Holdings (SHLD +11.60%) gapped to its highest price since September 2008 after the largest US department-store chain’s fourth-quarter profit topped analysts’ estimates as its Kmart division sold more toys, clothing and home goods during the holiday season. Even Bed Bath & Beyond (BBBY +6.91%) gapped higher, hitting its highest price since February 2007, after the country's largest home-furnishings retailer raised guidance for 2010 and reported stronger than expected third-quarter earnings.
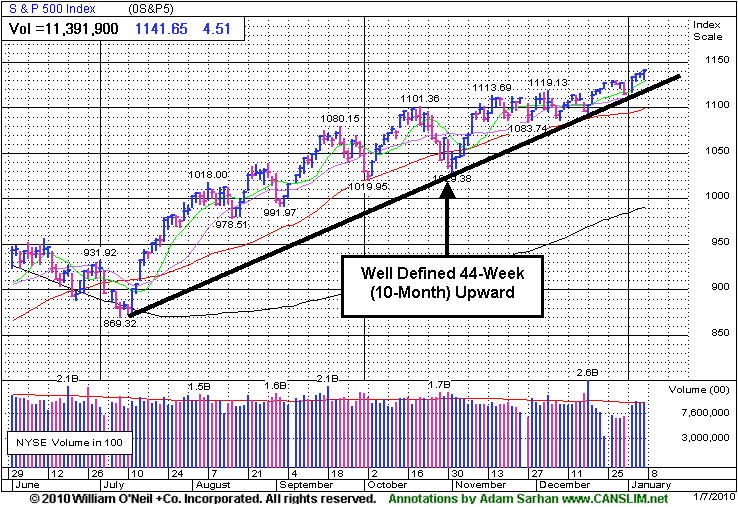
Stocks remain strong as investors digested the latest round of economic data. The benchmark S&P 500, Dow Jones Industrial Average, NYSE composite, mid-cap S&P 400, small-cap Russell 2000 and small-cap S&P 600 indices all enjoyed fresh recovery closing highs! The current rally is ending its 44th week (since the March 12, 2009 follow-through day) and on all accounts still looks very strong. In addition, most bull markets last for approximately 36 months, so the fact that we are beginning our 10th month suggests we have more room to go. December's jobs report will likely set the stage for the next near term move for the major averages. Until support is broken (50 DMA lines for the major averages) this rally deserves the bullish benefit of the doubt.
PICTURED: For the new year, the S&P 500 Index is up +2.3%. Getting off to a good start generally bodes well for the market, however investors should continue to monitor the major averages and the action in the market's leading stocks for the best read on the M criteria. Stay tuned to the daily CANSLIM.net reports to keep yourself well informed throughout 2010. We invite your feedback and any suggestions you may have on how CANSLIM.net can make your day-to-day application of the proven investment system easier. Please take time to use the inquiry form if there is anything you think we should know. Thank you!
|
|
|
 |
Oil Services Index Perched Near Prior Chart Highs
Kenneth J. Gruneisen - Passed the CAN SLIM® Master's Exam
The Bank Index ($BKX +4.11%) was a standout gainer on Thursday, and the Healthcare Index ($HMO +2.99%) also posted a hearty gain. Modest gains from the Broker/Dealer Index ($XBD +0.80%) and Retail Index ($RLX +0.79%) were also a positive influence on the major averages. Small gains from the Biotechnology Index ($BTK +0.59%) and Networking Index ($NWX +0.84%) were offset by losses in the Semiconductor Index ($SOX -1.10%) and Internet Index ($IIX -0.37%). The tech-heavy Nasdaq Composite Index lagged its peers due to the sluggishness of the tech sector. Elsewhere, the Gold & Silver Index ($XAU -0.86%) fell slightly, ending a 4-day rally which helped it climb above its 50-day moving average line, and energy shares treaded water as the Integrated Oil Index ($XOI -0.08%) and Oil Services Index ($OSX +0.01%) finished virtually unchanged.
Charts courtesy www.stockcharts.com
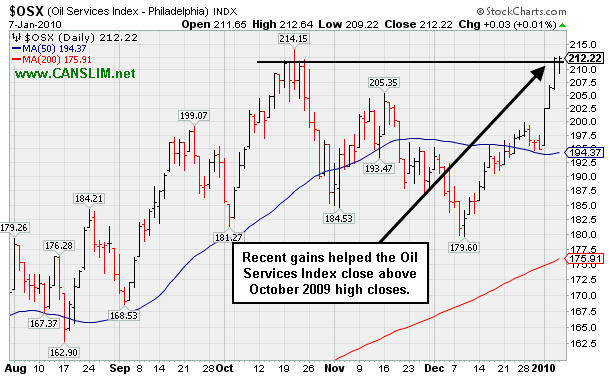
PICTURED 1: The Oil Services Index's ($OSX +0.01%) recent sprint higher helped it close above its October 2009 high closes, which could signal further upside in the group.
Charts courtesy www.stockcharts.com
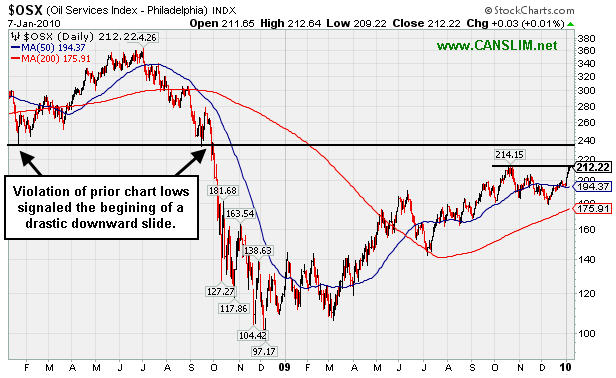
PICTURED 2: The 2-year chart illustrates the significance of a violation of prior chart lows that occurred in late-September 2008. Now, gains above the 214 level in the near term could put the OSX on course to potentially challenge its old "support" level, or rally even further toward historic highs.
| Oil Services |
$OSX |
212.22 |
+0.03 |
+0.01% |
+8.88% |
| Healthcare |
$HMO |
1,577.56 |
+45.82 |
+2.99% |
+7.10% |
| Integrated Oil |
$XOI |
1,112.53 |
-0.90 |
-0.08% |
+4.15% |
| Semiconductor |
$SOX |
362.30 |
-4.04 |
-1.10% |
+0.66% |
| Networking |
$NWX |
238.37 |
+1.98 |
+0.84% |
+3.16% |
| Internet |
$IIX |
234.48 |
-0.86 |
-0.37% |
+0.27% |
| Broker/Dealer |
$XBD |
120.26 |
+0.95 |
+0.80% |
+4.53% |
| Retail |
$RLX |
417.25 |
+3.29 |
+0.79% |
+1.49% |
| Gold & Silver |
$XAU |
179.21 |
-1.55 |
-0.86% |
+6.51% |
| Bank |
$BKX |
47.09 |
+1.86 |
+4.11% |
+10.26% |
| Biotech |
$BTK |
970.63 |
+5.66 |
+0.59% |
+3.03% |
|
|
|
 |
50 Day Moving Average Line Acted As Resistance
Kenneth J. Gruneisen - Passed the CAN SLIM® Master's Exam
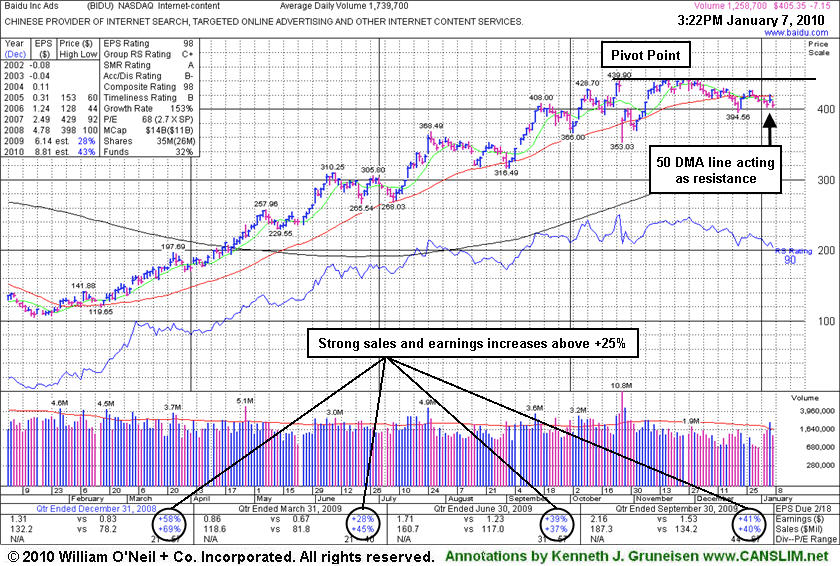
Baidu.com, Inc. (BIDU -$7.87 or -1.91% to $404.63) fell today on lighter than average volume. The prior session's gain was marked by higher volume than any up session since 11/09/09, but it ended near the session low after encountering resistance at its 50-day moving average (DMA) line. Gains back above its 50 DMA line are needed for its outlook to improve. Since quietly rallying to new highs in November it has stalled. The longer it struggles below its 50 DMA line, the worse its outlook becomes. This Chinese provider of Internet search and content services could continue basing for a longer period. Patience is important, because without convincing gains leading to a fresh breakout there is little assurance it is capable of sustaining a meaningful rally higher.
Technically, it has built a sloppy base over the past 11 weeks, and gains above its previously cited pivot point with at least +50% above average volume could trigger a new buy signal. BIDU proved resilient near its 50 DMA line after its 10/27/09 gap down, which was a sign of great institutional support. It is reassuring that the number of top-rated funds owning BIDU's shares rose from 103 in Dec '08 to 171 in Sep '09, solid evidence its shares were being accumulated by the institutional (I criteria) crowd.
|
|
|
Color Codes Explained :
Y - Better candidates highlighted by our
staff of experts.
G - Previously featured
in past reports as yellow but may no longer be buyable under the
guidelines.
***Last / Change / Volume quote data in this table corresponds with the timestamp on the note***
Symbol/Exchange
Company Name
Industry Group |
Last |
Chg. |
Vol
% DAV |
Date Featured |
Price Featured |
Latest Pivot Point
Featured |
Status |
| Latest Max Buy Price |
ARST
-
|
$28.22
|
+0.07
|
347,152
69% DAV
501,300
|
9/1/2009
(Date
Featured) |
$19.91
(Price
Featured) |
PP = $27.20 |
Y |
| MB = $28.56 |
Most Recent Note - 1/7/2010 4:42:38 PM
Y - Small gain today on light volume, consolidating just under its "max buy" level. A considerable gain on 1/04/10 triggered a technical buy signal as it blasted above its pivot point with volume more than 3 times average. ARST was first featured in yellow at $19.91 in the 9/01/09 mid-day report with an annotated daily graph (read here).
>>> The latest Featured Stock Update with an annotated graph appeared on 1/4/2010. click here.
|
|
C
A
S
I |
News |
Chart |
SEC
View all notes Alert
me of new notes
Company
Profile
|
ASIA
-
|
$27.92
|
-0.76
|
1,218,003
93% DAV
1,307,200
|
12/24/2009
(Date
Featured) |
$31.05
(Price
Featured) |
PP = $32.40 |
G |
| MB = $34.02 |
Most Recent Note - 1/7/2010 4:53:24 PM
G - Loss on average volume today was its 3rd consecutive decline since its damaging 1/05/10 gap down and loss on heavy volume violated recent chart lows and raised concerns. Its 50 DMA line (now $26.81) is the next important support level to watch. A technical buy signal did not occur since its advanced "3 weeks tight" pattern was recently noted. Traded up as much as +68.13% since first featured in the August 2009 CANSLIM.net News (read here).
>>> The latest Featured Stock Update with an annotated graph appeared on 12/23/2009. click here.
|
|
C
A
S
I |
News |
Chart |
SEC
View all notes Alert
me of new notes
Company
Profile
|
BIDU
- NASDAQ
Baidu Inc Ads
INTERNET - Internet Information Providers
|
$404.63
|
-7.87
|
1,431,423
82% DAV
1,739,700
|
9/8/2009
(Date
Featured) |
$351.80
(Price
Featured) |
PP = $440.00 |
G |
| MB = $462.00 |
Most Recent Note - 1/7/2010 4:56:11 PM
G - Gapped down today after encountering resistance at its 50 DMA line on the prior session. Gains back above its 50 DMA line are needed for its outlook to improve. Technically, it has built a sloppy base over the past 11 weeks, and gains above its previously cited pivot point with at least +50% above average volume could trigger a new buy signal. BIDU traded up as much as +23% from its price when featured in yellow in the 9/08/09 Mid-Day BreakOuts Report (read here).
>>> The latest Featured Stock Update with an annotated graph appeared on 1/7/2010. click here.
|
|
C
A
S
I |
News |
Chart |
SEC
View all notes Alert
me of new notes
Company
Profile
|
CAAS
- NASDAQ
China Automotive Systems
AUTOMOTIVE - Auto Parts
|
$22.85
|
-0.19
|
852,701
96% DAV
886,000
|
11/30/2009
(Date
Featured) |
$18.84
(Price
Featured) |
PP = $17.62 |
G |
| MB = $18.50 |
Most Recent Note - 1/7/2010 5:00:46 PM
G - Small loss today on average volume after a negative reversal on the prior session. Volume was more than 4 times average behind its considerable 1/05/10 gain for a new high. The choppy consolidation over the prior 5 weeks involved a -28% pullback, so this was not a sound "flat base" of the minimum length. However, no overhead supply remains and it could go on to produce a "climax run", especially considering its small float of only 4.86 million shares (S criteria). It found prompt support following a sharp pullback to its short-term average line. The Chinese maker of power steering systems had negated most of its bullish action since featured in the 11/30/09 mid-day report (read here).
>>> The latest Featured Stock Update with an annotated graph appeared on 12/29/2009. click here.
|
|
C
A
S
I |
News |
Chart |
SEC
View all notes Alert
me of new notes
Company
Profile
|
CACC
- NASDAQ
Credit Acceptance Corp
FINANCIAL SERVICES - Credit Services
|
$43.98
|
+0.08
|
30,575
71% DAV
42,900
|
9/29/2009
(Date
Featured) |
$33.48
(Price
Featured) |
PP = $37.10 |
G |
| MB = $38.96 |
Most Recent Note - 1/7/2010 5:03:10 PM
G - Small gain today for a new high close. Holding its ground perched at all-time highs, extended from its prior base. Previous chart highs near $35-37 are an important support level to watch. The Finance - Consumer/Commercial Loans firm has maintained a great track record of annual and quarterly sales revenues and earnings increases. It was featured on 9/29/09 in yellow in the mid-day report (read here).
>>> The latest Featured Stock Update with an annotated graph appeared on 12/22/2009. click here.
|
|
C
A
S
I |
News |
Chart |
SEC
View all notes Alert
me of new notes
Company
Profile
|
CRM
- NYSE
Salesforce.com Inc
INTERNET - Internet Software & Services
|
$74.04
|
-0.33
|
1,209,903
70% DAV
1,739,100
|
12/18/2009
(Date
Featured) |
$67.32
(Price
Featured) |
PP = $67.82 |
G |
| MB = $71.21 |
Most Recent Note - 1/7/2010 5:18:06 PM
G - Hovering near its $75 all-time high, extended from its prior base. Prior chart highs in the $67 area are an important support level to watch on pullbacks.
>>> The latest Featured Stock Update with an annotated graph appeared on 1/6/2010. click here.
|
|
C
A
S
I |
News |
Chart |
SEC
View all notes Alert
me of new notes
Company
Profile
|
CTRP
- NASDAQ
Ctrip.com Intl Ltd Adr
LEISURE - Resorts & Casinos
|
$73.11
|
-1.82
|
812,547
75% DAV
1,089,800
|
12/1/2009
(Date
Featured) |
$75.38
(Price
Featured) |
PP = $73.91 |
Y |
| MB = $77.61 |
Most Recent Note - 1/7/2010 5:21:21 PM
Y - Consolidating in a tight range above its 50 DMA line for about 5 weeks. A new pivot point was cited and its color code was changed to yellow. Gains above the pivot with at least +50% above average volume are needed to trigger a fresh technical buy signal. Featured on 12/01/09 in yellow in the mid-day report (read here). Fundamentally, its sales revenues and earnings increases have shown acceleration in the 3 most recent quarterly comparisons and rose above the +25% guideline. Based on weak technical action it was dropped from the Featured Stocks list on 6/10/08, when it closed at $49.84, yet it has rebounded very impressively from subsequent lows in the $16 area.
>>> The latest Featured Stock Update with an annotated graph appeared on 12/30/2009. click here.
|
|
C
A
S
I |
News |
Chart |
SEC
View all notes Alert
me of new notes
Company
Profile
|
GMCR
- NASDAQ
Green Mtn Coffee Roastrs
FOOD & BEVERAGE - Processed & Packaged Goods
|
$81.58
|
-1.36
|
1,141,040
72% DAV
1,579,800
|
12/28/2009
(Date
Featured) |
$77.49
(Price
Featured) |
PP = $76.50 |
G |
| MB = $80.33 |
Most Recent Note - 1/7/2010 5:25:46 PM
G - Loss today on light volume, pulling back toward its "max buy" level. Prior chart highs in the $76-77 area are important support levels to watch now.
>>> The latest Featured Stock Update with an annotated graph appeared on 12/28/2009. click here.
|
|
C
A
S
I |
News |
Chart |
SEC
View all notes Alert
me of new notes
Company
Profile
|
HEAT
-
|
$16.69
|
-0.40
|
1,555,059
146% DAV
1,064,200
|
1/6/2010
(Date
Featured) |
$17.19
(Price
Featured) |
PP = $17.27 |
Y |
| MB = $18.13 |
Most Recent Note - 1/7/2010 5:27:38 PM
Y - Pulled back today after hitting a new all-time high on 1/06/10 with a considerable gain on more than twice average volume. It was a new high close, but finished just under its pivot point. Color code was changed to yellow and a new pivot point was cited after it formed a short "ascending base" type pattern. A gain above its new pivot point with heavy volume could confirm a new technical buy signal. Recent chart lows near $14 define an important support level now. HEAT traded as much as +45.9% higher since first featured in yellow in the 11/17/09 mid-day report (read here) when technically rising from a "double bottom" base, reaching a new all-time high.
>>> The latest Featured Stock Update with an annotated graph appeared on 12/31/2009. click here.
|
|
C
A
S
I |
News |
Chart |
SEC
View all notes Alert
me of new notes
Company
Profile
|
LFT
-
|
$38.96
|
-0.14
|
222,835
54% DAV
410,000
|
11/17/2009
(Date
Featured) |
$31.77
(Price
Featured) |
PP = $33.04 |
G |
| MB = $34.69 |
Most Recent Note - 1/7/2010 5:29:25 PM
G - Holding its ground near all-time highs, extended from a sound buy point after recently rising from a choppy 14-week base. Its 50 DMA line is an initial support level to watch. A proposed offering of additional shares on 11/16/09 seems well received by the market. Its fundamentals remain strong.
>>> The latest Featured Stock Update with an annotated graph appeared on 1/5/2010. click here.
|
|
C
A
S
I |
News |
Chart |
SEC
View all notes Alert
me of new notes
Company
Profile
|
PEGA
- NASDAQ
Pegasystems Inc
COMPUTER SOFTWARE & SERVICES - Business Software & Services
|
$33.42
|
-0.76
|
160,479
64% DAV
250,500
|
1/4/2010
(Date
Featured) |
$34.00
(Price
Featured) |
PP = $36.19 |
Y |
| MB = $38.00 |
Most Recent Note - 1/7/2010 6:17:49 PM
Y - Small loss today on light volume was its 6th loss in 7 sessions. It is consolidating in close striking distance of all-time highs with no overhead supply remaining to act as resistance. Returned to the Featured Stocks page again with its fresh appearance in the January 2010 issue of CANSLIM.net News (read here).
>>> The latest Featured Stock Update with an annotated graph appeared on 1/3/2010. click here.
|
|
C
A
S
I |
News |
Chart |
SEC
View all notes Alert
me of new notes
Company
Profile
|
VIT
-
|
$20.07
|
-0.79
|
1,449,067
267% DAV
542,200
|
12/24/2009
(Date
Featured) |
$20.07
(Price
Featured) |
PP = $21.17 |
Y |
| MB = $22.23 |
Most Recent Note - 1/7/2010 6:34:38 PM
Y - Gapped up today and hit a new all-time high, but it abruptly reversed and closed the session with a loss, which was a sign of distributional pressure as it tries to rally from a choppy 11-week base. Featured in yellow in the 12/24/09 mid-day report (read here). No overhead supply exists to act as resistance. Fundamentally, this high-ranked Computer - Tech Services firm's earnings and sales revenues increases have been above or at the +25% minimum guideline.
>>> The latest Featured Stock Update with an annotated graph appeared on 12/24/2009. click here.
|
|
C
A
S
I |
News |
Chart |
SEC
View all notes Alert
me of new notes
Company
Profile
|
|
|
|
THESE ARE NOT BUY RECOMMENDATIONS!
Comments contained in the body of this report are technical
opinions only. The material herein has been obtained
from sources believed to be reliable and accurate, however,
its accuracy and completeness cannot be guaranteed.
This site is not an investment advisor, hence it does
not endorse or recommend any securities or other investments.
Any recommendation contained in this report may not
be suitable for all investors and it is not to be deemed
an offer or solicitation on our part with respect to
the purchase or sale of any securities. All trademarks,
service marks and trade names appearing in this report
are the property of their respective owners, and are
likewise used for identification purposes only.
This report is a service available
only to active Paid Premium Members.
You may opt-out of receiving report notifications
at any time. Questions or comments may be submitted
by writing to Premium Membership Services 665 S.E. 10 Street, Suite 201 Deerfield Beach, FL 33441-5634 or by calling 1-800-965-8307
or 954-785-1121.
|
|
|


