You are not logged in.
This means you
CAN ONLY VIEW reports that were published prior to Sunday, March 30, 2025.
You
MUST UPGRADE YOUR MEMBERSHIP if you want to see any current reports.
AFTER MARKET UPDATE - THURSDAY, JANUARY 3RD, 2013
Previous After Market Report Next After Market Report >>>
|
|
|
|
DOW |
-21.19 |
13,391.36 |
-0.16% |
|
Volume |
706,979,800 |
-18% |
|
Volume |
1,687,591,750 |
-18% |
|
NASDAQ |
-11.69 |
3,100.57 |
-0.38% |
|
Advancers |
1,709 |
54% |
|
Advancers |
1,187 |
46% |
|
S&P 500 |
-3.05 |
1,459.37 |
-0.21% |
|
Decliners |
1,344 |
43% |
|
Decliners |
1,290 |
50% |
|
Russell 2000 |
-0.82 |
872.60 |
-0.09% |
|
52 Wk Highs |
289 |
|
|
52 Wk Highs |
138 |
|
|
S&P 600 |
-0.11 |
489.17 |
-0.02% |
|
52 Wk Lows |
5 |
|
|
52 Wk Lows |
12 |
|
|
 |
Major Averages Edged Lower With Lighter Volume Totals
Kenneth J. Gruneisen - Passed the CAN SLIM® Master's Exam
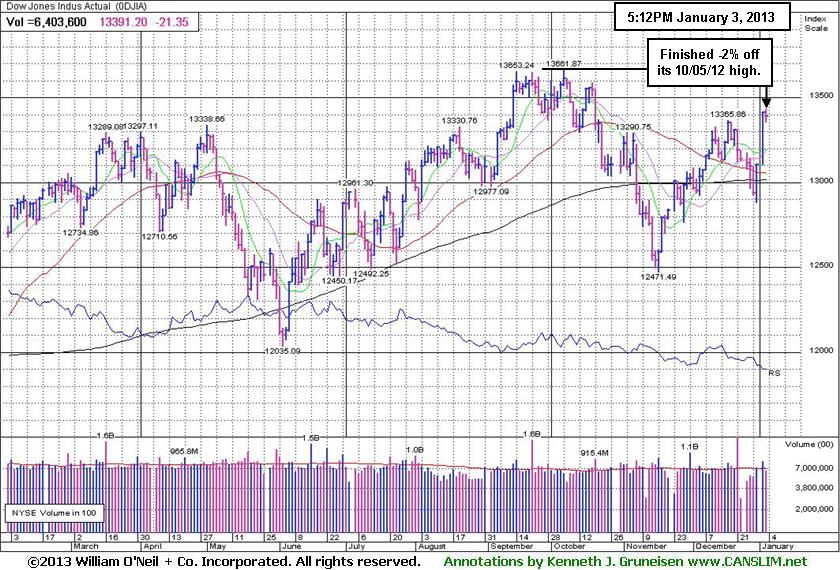
On Thursday the markets finished lower as profit taking made the scene. The volume totals were reported lighter on both the NYSE and the Nasdaq exchange, a reassuring sign that institutional selling was not picking up. Advancers led decliners by narrow margin on the NYSE while decliners outnumbered advancers by a narrower margin on the Nasdaq exchange. The total number of stocks hitting new 52-week highs easily outnumbered new 52-week lows on the NYSE and on the Nasdaq exchange, and new lows were in the single digits on the NYSE. There were 107 high-ranked companies from the CANSLIM.net Leaders List making new 52-week highs and appearing on the CANSLIM.net BreakOuts Page, down from the prior session total of 166 stocks. Any sustainable rally requires a healthy crop of companies hitting new 52-week highs, so it was encouraging to see a great expansion in new leadership. There were gains for 7 of the 13 high-ranked companies currently included on the Featured Stocks Page.
Stocks lost ground as the Washington induced advance faded. Lingering automatic spending cuts and fears that lawmakers may fail to reach a compromise to raise the debt ceiling lowered budget deal enthusiasm. The December FOMC minutes added to the fray which revealed the Fed sees its bond-buying program coming to a close sometime this year.
On the economic front, the ADP report showed the best private payroll hiring since last February as companies added 215,000 workers in December. Meanwhile, initial jobless claims increased more than anticipated to 372,000, the highest level since late November. Now focus turns to Friday's all-important employment update. Non-farm payrolls are expected to climb to 153,000 in December and the unemployment rate is anticipated to hold at 7.7%.
Encouraging monthly retail sales results and a better-than-expected employment tally are in focus. December same-store-sales rose +4.8%, topping the estimate for a gain of +3.4%. As a result, The TJX Companies Inc (TJX +3.27%), Nordstrom Inc (JWN +3.06%) and Target Corp (TGT +2.28%) rose. Autos also were in the spotlight. The new General Motors Company (GM +2.37%) and Ford Motor Co (F +1.97%) rose after both companies posted vehicle sales above street expectations.
In fixed-income, Treasury prices fell for a third day as the 10-year note lost 18/32 to reach a seven-month high yield of 1.90%.
Technically, the market (M criteria) narrowly avoided the label of a full blown "correction" while the uptrend came under recent pressure, and with Monday's solid gains the benchmark S&P 500 Index promptly rebounded above its 50-day moving average (DMA) line, and Nasdaq Composite Index and Dow Jones Industrial Average both promptly rebounded above their respective 50 DMA and 200 DMA lines. investors may consider new buying efforts only in stocks meeting all key criteria.
Watch for an announcement via email concerning the next WEBCAST. The webcast will also be available via an updated link highlighted at the top of the Premium Member Homepage.
PICTURED: The Dow Jones Industrial Average finished -2% off its 10/05/12 high.
|
 Kenneth J. Gruneisen started out as a licensed stockbroker in August 1987, a couple of months prior to the historic stock market crash that took the Dow Jones Industrial Average down -22.6% in a single day. He has published daily fact-based fundamental and technical analysis on high-ranked stocks online for two decades. Through FACTBASEDINVESTING.COM, Kenneth provides educational articles, news, market commentary, and other information regarding proven investment systems that work in good times and bad.
Comments contained in the body of this report are technical opinions only and are not necessarily those of Gruneisen Growth Corp. The material herein has been obtained from sources believed to be reliable and accurate, however, its accuracy and completeness cannot be guaranteed. Our firm, employees, and customers may effect transactions, including transactions contrary to any recommendation herein, or have positions in the securities mentioned herein or options with respect thereto. Any recommendation contained in this report may not be suitable for all investors and it is not to be deemed an offer or solicitation on our part with respect to the purchase or sale of any securities. |
|
 |
Defensive Groups Led Decliners
Kenneth J. Gruneisen - Passed the CAN SLIM® Master's Exam
The Retail Index ($RLX +0.42%) was a positive influence on the major averages but failed to offset weakness in other groups. The Bank Index ($BKX -0.17%) and Broker/Dealer Index ($XBD +0.10%) were mixed and very little changed on Thursday. Defensive groups fared poorly as the Healthcare Index ($HMO -2.22%) and Gold & Silver Index ($XAU -3.75%) were clearly laggards. The Networking Index ($NWX -0.55%), Semiconductor Index ($SOX -0.55%), and the Internet Index ($IIX -0.52%) suffered modest setbacks while the Biotechnology Index ($BTK +0.46%) posted a small gain. Energy-related shares were mixed as the Oil Services Index ($OSX +0.62%) posted a small gain and the Integrated Oil Index ($XOI -0.24%) edged lower.
Charts courtesy www.stockcharts.com
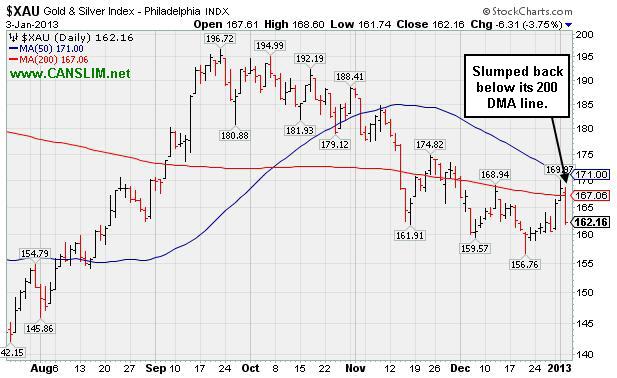
PICTURED: The Gold & Silver Index ($XAU -3.75%) slumped back below its 200-day moving average line with a big loss.
| Oil Services |
$OSX |
227.32 |
+1.41 |
+0.62% |
+3.25% |
| Healthcare |
$HMO |
2,471.40 |
-56.01 |
-2.22% |
-1.70% |
| Integrated Oil |
$XOI |
1,264.90 |
-3.10 |
-0.24% |
+1.86% |
| Semiconductor |
$SOX |
397.54 |
-2.19 |
-0.55% |
+3.51% |
| Networking |
$NWX |
232.91 |
-1.28 |
-0.55% |
+2.81% |
| Internet |
$IIX |
335.15 |
-1.75 |
-0.52% |
+2.49% |
| Broker/Dealer |
$XBD |
97.29 |
+0.09 |
+0.10% |
+3.14% |
| Retail |
$RLX |
665.18 |
+2.79 |
+0.42% |
+1.86% |
| Gold & Silver |
$XAU |
162.16 |
-6.31 |
-3.75% |
-2.08% |
| Bank |
$BKX |
52.84 |
-0.09 |
-0.17% |
+3.04% |
| Biotech |
$BTK |
1,611.06 |
+7.31 |
+0.46% |
+4.14% |
|
|
|
 |
RS Rating Waning While Perched Near High
Kenneth J. Gruneisen - Passed the CAN SLIM® Master's Exam
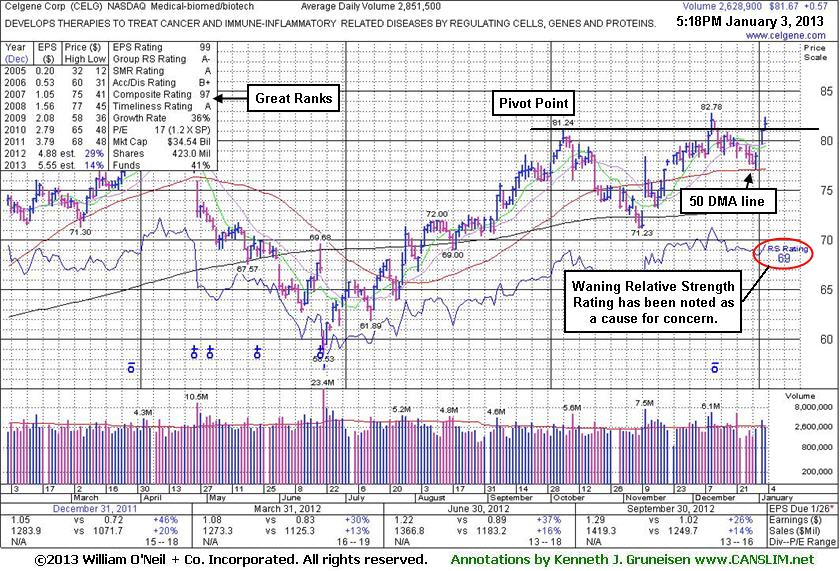
Celgene Corp (CELG +$0.57 or +0.70% to $81.67) posted a gain today on near average volume. On the prior session it gapped up and tallied a solid gain with slightly above average volume, rallying back near its pivot point. Its 50-day moving average (DMA) line acted as support during the recent consolidation following its earlier breakout. However, its waning Relative Strength Rating (see red circle) has been noted as cause for some concern. The graph below shows that its RS line was plotted higher a couple of weeks ago, and it was plotted even higher still back in April. Based on historic studies it is preferred that the RS line provide confirmation, so it is usually best to see a stock's RS line lead the way by moving into new high territory prior to the share price also rising into new high territory. Buy candidates should have a RS rank of 80+, so the sub par rank actually argues against new buying efforts.
Its last appearance in this FSU section was on 12/12/12 with an annotated graph under the headline, "Pulled Back Following Technical Breakout". On the prior session it had been highlighted in yellow with pivot point cited based on its 10/05/12 high plus 10 cents in the mid-day report (read here). It finished that session above its pivot point with a gain backed by +128% above average volume as it rallied for a new 52-week high and clinched a technical buy signal. As always, disciplined investors limit losses if any stock ever falls more that -7% from their buy point. Healthy stocks do not normally retreat more than -7% below their pivot point, and during its consolidation that sell rule would not have been triggered because it avoided a deeper pullback.
The number of top-rated funds owning its shares rose from 1,623 in Dec '11 to 1,654 in Sep '12, a somewhat reassuring trend concerning the I criteria. However, the company is already well-known by the institutional crowd. CELG maintained a strong earnings history (C and A criteria).
|
|
|
Color Codes Explained :
Y - Better candidates highlighted by our
staff of experts.
G - Previously featured
in past reports as yellow but may no longer be buyable under the
guidelines.
***Last / Change / Volume data in this table is the closing quote data***
Symbol/Exchange
Company Name
Industry Group |
PRICE |
CHANGE
(%Change) |
Day High |
Volume
(% DAV)
(% 50 day avg vol) |
52 Wk Hi
% From Hi |
Featured
Date |
Price
Featured |
Pivot Featured |
|
Max Buy |
CELG
-
NASDAQ
Celgene Corp
DRUGS - Drug Manufacturers - Major
|
$81.67
|
+0.57
0.70% |
$82.39
|
2,674,524
93.79% of 50 DAV
50 DAV is 2,851,500
|
$82.78
-1.34%
|
12/11/2012
|
$82.24
|
PP = $81.34
|
|
MB = $85.41
|
 Most Recent Note - 1/3/2013 5:54:30 PM
Y - Its 50 DMA acted as support during the recent consolidation, but waning RS Rating is cause for concern. See latest FSU analysis for more details and a new annotated graph.
>>> The latest Featured Stock Update with an annotated graph appeared on 1/3/2013. Click here.
View all notes |
Alert me of new notes |
CANSLIM.net Company Profile |
SEC |
Zacks Reports |
StockTalk |
News |
Chart |
Request a new note
C
A N
S L
I M


|
CFNL
-
NASDAQ
Cardinal Financial Corp
BANKING - Regional - Southeast Banks
|
$16.46
|
-0.22
-1.32% |
$16.75
|
110,007
50.55% of 50 DAV
50 DAV is 217,600
|
$16.90
-2.60%
|
12/3/2012
|
$15.20
|
PP = $16.31
|
|
MB = $17.13
|
Most Recent Note - 1/2/2013 4:07:21 PM
Y - Today's gain for a new 52-week high cleared its pivot point with sufficient volume to trigger a proper new (or add-on) technical buy signal.
>>> The latest Featured Stock Update with an annotated graph appeared on 12/31/2012. Click here.
View all notes |
Alert me of new notes |
CANSLIM.net Company Profile |
SEC |
Zacks Reports |
StockTalk |
News |
Chart |
Request a new note
C
A N
S L
I M
|
CMCSA
-
NASDAQ
Comcast Corp Cl A
MEDIA - CATV Systems
|
$38.09
|
-0.43
-1.12% |
$38.58
|
11,403,725
94.27% of 50 DAV
50 DAV is 12,097,100
|
$38.57
-1.24%
|
12/3/2012
|
$37.08
|
PP = $38.06
|
|
MB = $39.96
|
Most Recent Note - 1/2/2013 4:08:50 PM
Y - Today's gain above its pivot point had sufficient volume to trigger a technical buy signal. No resistance remains due to overhead supply.
>>> The latest Featured Stock Update with an annotated graph appeared on 12/27/2012. Click here.
View all notes |
Alert me of new notes |
CANSLIM.net Company Profile |
SEC |
Zacks Reports |
StockTalk |
News |
Chart |
Request a new note
C
A N
S L
I M
|
LULU
-
NASDAQ
Lululemon Athletica
MANUFACTURING - Textile Manufacturing
|
$75.09
|
+1.07
1.45% |
$76.05
|
1,801,801
92.01% of 50 DAV
50 DAV is 1,958,300
|
$81.09
-7.40%
|
12/26/2012
|
$73.81
|
PP = $77.95
|
|
MB = $81.85
|
Most Recent Note - 1/2/2013 4:10:10 PM
Y - Negative reversal for a loss with average volume today raises concerns. Subsequent volume-driven gains above its pivot point are still needed to trigger a new technical buy signal.
>>> The latest Featured Stock Update with an annotated graph appeared on 12/28/2012. Click here.
View all notes |
Alert me of new notes |
CANSLIM.net Company Profile |
SEC |
Zacks Reports |
StockTalk |
News |
Chart |
Request a new note
C
A N
S L
I M
|
MIDD
-
NASDAQ
Middleby Corp
MANUFACTURING - Diversified Machinery
|
$130.15
|
-1.24
-0.94% |
$132.27
|
83,516
95.01% of 50 DAV
50 DAV is 87,900
|
$134.51
-3.24%
|
10/8/2012
|
$118.46
|
PP = $122.67
|
|
MB = $128.80
|
Most Recent Note - 1/2/2013 4:11:05 PM
G - Gapped up today and challenged its 52-week and all-time high with a volume-driven gain. Earnings +23% on +18% sales for the Sep '12 quarter, below the +25% minimum earnings guideline (C criteria), raised concerns.
>>> The latest Featured Stock Update with an annotated graph appeared on 12/26/2012. Click here.
View all notes |
Alert me of new notes |
CANSLIM.net Company Profile |
SEC |
Zacks Reports |
StockTalk |
News |
Chart |
Request a new note
C
A N
S L
I M
|
Symbol/Exchange
Company Name
Industry Group |
PRICE |
CHANGE
(%Change) |
Day High |
Volume
(% DAV)
(% 50 day avg vol) |
52 Wk Hi
% From Hi |
Featured
Date |
Price
Featured |
Pivot Featured |
|
Max Buy |
N
-
NYSE
Netsuite Inc
DIVERSIFIED SERVICES - Business/Management Services
|
$67.04
|
-1.96
-2.84% |
$68.98
|
264,713
58.98% of 50 DAV
50 DAV is 448,800
|
$70.06
-4.31%
|
12/12/2012
|
$64.75
|
PP = $67.12
|
|
MB = $70.48
|
Most Recent Note - 1/3/2013 3:50:48 PM
Y - Slumping back below its pivot point today, and the prior gain above its pivot point was marked by light volume. Disciplined investors know that volume must be at least +40% above average behind gains above the pivot point to trigger a proper technical buy signal.
>>> The latest Featured Stock Update with an annotated graph appeared on 12/13/2012. Click here.
View all notes |
Alert me of new notes |
CANSLIM.net Company Profile |
SEC |
Zacks Reports |
StockTalk |
News |
Chart |
Request a new note
C
A N
S L
I M
|
NSR
-
NYSE
Neustar Inc
TELECOMMUNICATIONS - Diversified Communication Serv
|
$43.18
|
-0.50
-1.14% |
$43.90
|
303,959
76.62% of 50 DAV
50 DAV is 396,700
|
$43.85
-1.53%
|
12/11/2012
|
$41.85
|
PP = $41.41
|
|
MB = $43.48
|
Most Recent Note - 1/2/2013 4:14:55 PM
G - Gapped up and rallied above its "max buy" level with a volume-driven gain and its color code is changed to green. Subsequent deterioration below its old high close ($41.05 on 10/05/12) could negate its recent breakout, a worrisome sign.
>>> The latest Featured Stock Update with an annotated graph appeared on 1/2/2013. Click here.
View all notes |
Alert me of new notes |
CANSLIM.net Company Profile |
SEC |
Zacks Reports |
StockTalk |
News |
Chart |
Request a new note
C
A N
S L
I M
|
RAX
-
NYSE
Rackspace Hosting Inc
INTERNET - Internet Software and; Services
|
$75.38
|
-1.68
-2.18% |
$77.13
|
1,011,117
69.30% of 50 DAV
50 DAV is 1,459,100
|
$77.09
-2.22%
|
12/18/2012
|
$71.88
|
PP = $70.10
|
|
MB = $73.61
|
Most Recent Note - 1/2/2013 4:17:04 PM
G - Wedged to a new all-time high above its "max buy" level with today's gain lacking great volume conviction and its color code is changed to green. Prior highs in the $70 area define initial support to watch following its recent breakout.
>>> The latest Featured Stock Update with an annotated graph appeared on 12/18/2012. Click here.
View all notes |
Alert me of new notes |
CANSLIM.net Company Profile |
SEC |
Zacks Reports |
StockTalk |
News |
Chart |
Request a new note
C
A N
S L
I M
|
RNF
-
NYSE
Rentech Nitrogen Ptnr Lp
CHEMICALS - Agricultural Chemicals
|
$39.65
|
+0.71
1.82% |
$39.85
|
334,279
114.71% of 50 DAV
50 DAV is 291,400
|
$41.15
-3.65%
|
11/1/2012
|
$39.11
|
PP = $40.15
|
|
MB = $42.16
|
Most Recent Note - 1/2/2013 12:09:40 PM
Y - Off earlier highs following a gap up today that had it trading near its pivot point and challenging previously stubborn resistance in the $40 area. While patient investors may still be watching for a technical buy signal, a violation of its recent low ($36.06 on 12/18/12) would raise more serious concerns and could trigger a technical sell signal.
>>> The latest Featured Stock Update with an annotated graph appeared on 12/19/2012. Click here.
View all notes |
Alert me of new notes |
CANSLIM.net Company Profile |
SEC |
Zacks Reports |
StockTalk |
News |
Chart |
Request a new note
C
A N
S L
I M
|
ULTA
-
NASDAQ
Ulta Salon Cosm & Frag
SPECIALTY RETAIL - Specialty Retail, Other
|
$101.99
|
+0.46
0.45% |
$102.56
|
787,813
101.76% of 50 DAV
50 DAV is 774,200
|
$103.52
-1.48%
|
12/4/2012
|
$100.29
|
PP = $103.62
|
|
MB = $108.80
|
Most Recent Note - 1/2/2013 4:21:30 PM
Y - Challenging its 52-week high and previously stubborn resistance with a volume-driven gain today. Its 50 DMA line recently acted as support. Its Relative Strength line did not recently lead the way and confirm a move into new high territory.
>>> The latest Featured Stock Update with an annotated graph appeared on 12/21/2012. Click here.
View all notes |
Alert me of new notes |
CANSLIM.net Company Profile |
SEC |
Zacks Reports |
StockTalk |
News |
Chart |
Request a new note
C
A N
S L
I M
|
Symbol/Exchange
Company Name
Industry Group |
PRICE |
CHANGE
(%Change) |
Day High |
Volume
(% DAV)
(% 50 day avg vol) |
52 Wk Hi
% From Hi |
Featured
Date |
Price
Featured |
Pivot Featured |
|
Max Buy |
VRX
-
NYSE
Valeant Pharmaceuticals
DRUGS - Drug Manufacturers - Other
|
$61.07
|
+0.32
0.53% |
$61.60
|
2,613,482
179.24% of 50 DAV
50 DAV is 1,458,100
|
$61.61
-0.88%
|
12/20/2012
|
$60.24
|
PP = $61.21
|
|
MB = $64.27
|
Most Recent Note - 1/3/2013 4:13:02 PM
Y - A 3rd consecutive gain today with above average volume still leaves it trading just below its pivot point. Disciplined investors may use a tactic called
"pyramiding" to allow market action to dictate their positioning.
>>> The latest Featured Stock Update with an annotated graph appeared on 12/20/2012. Click here.
View all notes |
Alert me of new notes |
CANSLIM.net Company Profile |
SEC |
Zacks Reports |
StockTalk |
News |
Chart |
Request a new note
C
A N
S L
I M
|
VSI
-
NYSE
Vitamin Shoppe Inc
SPECIALTY RETAIL - Specialty Retail, Other
|
$56.52
|
+0.44
0.78% |
$57.23
|
332,817
127.13% of 50 DAV
50 DAV is 261,800
|
$61.89
-8.68%
|
12/3/2012
|
$59.06
|
PP = $61.99
|
|
MB = $65.09
|
Most Recent Note - 1/2/2013 4:25:58 PM
G - Reversed into the red for worrisome loss on higher volume after starting in positive territory today. Prior lows and its 200 DMA line define important near-term support to watch in the $53 area. It faces resistance due to overhead supply up through the $61 level which has been a stubborn resistance level in recent months.
>>> The latest Featured Stock Update with an annotated graph appeared on 12/24/2012. Click here.
View all notes |
Alert me of new notes |
CANSLIM.net Company Profile |
SEC |
Zacks Reports |
StockTalk |
News |
Chart |
Request a new note
C
A N
S L
I M
|
WPI
-
NYSE
Watson Pharmaceuticals
DRUGS - Drugs - Generic
|
$85.92
|
+1.71
2.03% |
$86.70
|
2,738,180
314.77% of 50 DAV
50 DAV is 869,900
|
$91.47
-6.07%
|
12/17/2012
|
$87.99
|
PP = $90.49
|
|
MB = $95.01
|
Most Recent Note - 1/3/2013 12:32:28 PM
G - Halting its 6-session losing streak with today's gain. Its 50 DMA line may now act as resistance following damaging volume-driven losses this week that triggered a technical sell signal.
>>> The latest Featured Stock Update with an annotated graph appeared on 12/17/2012. Click here.
View all notes |
Alert me of new notes |
CANSLIM.net Company Profile |
SEC |
Zacks Reports |
StockTalk |
News |
Chart |
Request a new note
C
A N
S L
I M
|
|
|
|
THESE ARE NOT BUY RECOMMENDATIONS!
Comments contained in the body of this report are technical
opinions only. The material herein has been obtained
from sources believed to be reliable and accurate, however,
its accuracy and completeness cannot be guaranteed.
This site is not an investment advisor, hence it does
not endorse or recommend any securities or other investments.
Any recommendation contained in this report may not
be suitable for all investors and it is not to be deemed
an offer or solicitation on our part with respect to
the purchase or sale of any securities. All trademarks,
service marks and trade names appearing in this report
are the property of their respective owners, and are
likewise used for identification purposes only.
This report is a service available
only to active Paid Premium Members.
You may opt-out of receiving report notifications
at any time. Questions or comments may be submitted
by writing to Premium Membership Services 665 S.E. 10 Street, Suite 201 Deerfield Beach, FL 33441-5634 or by calling 1-800-965-8307
or 954-785-1121.
|
|
|

