You are not logged in.
This means you
CAN ONLY VIEW reports that were published prior to Tuesday, April 8, 2025.
You
MUST UPGRADE YOUR MEMBERSHIP if you want to see any current reports.
AFTER MARKET UPDATE - THURSDAY, DECEMBER 18TH, 2014
Previous After Market Report Next After Market Report >>>
|
|
|
|
DOW |
+421.28 |
17,778.15 |
+2.43% |
|
Volume |
953,031,750 |
-7% |
|
Volume |
2,046,348,080 |
-7% |
|
NASDAQ |
+104.09 |
4,748.40 |
+2.24% |
|
Advancers |
2,546 |
79% |
|
Advancers |
2,238 |
75% |
|
S&P 500 |
+48.34 |
2,061.23 |
+2.40% |
|
Decliners |
585 |
18% |
|
Decliners |
660 |
22% |
|
Russell 2000 |
+17.33 |
1,192.16 |
+1.47% |
|
52 Wk Highs |
187 |
|
|
52 Wk Highs |
128 |
|
|
S&P 600 |
+12.54 |
684.88 |
+1.87% |
|
52 Wk Lows |
20 |
|
|
52 Wk Lows |
43 |
|
|
 |
Major Averages Posted Big Gains for a Second Consecutive Session
Kenneth J. Gruneisen - Passed the CAN SLIM® Master's Exam
Stocks rallied for a second day with each of the major averages gaining at least +2.2%. The Dow rose 421 points to 17,778. The S&P 500 gained 48 points to 2,061. The NASDAQ Composite increased 104 points to 4748. However, behind Thursday's big gains the volume was reported lighter on the NYSE and on the Nasdaq exchange, a sign of less buying conviction from the institutional crowd. Breadth was positive as advancers led decliners by almost a 5-1 margin on the NYSE and 3-1 on the Nasdaq exchange. There were 71 high-ranked companies from the CANSLIM.net Leaders List that made new 52-week highs and appeared on the CANSLIM.net BreakOuts Page, up meaningfully from the prior session total of 15 stocks. New 52-week highs expanded and outnumbered new 52-week lows on the NYSE and on the Nasdaq exchange. There gains for 8 of the 10 high-ranked companies currently on the Featured Stocks Page, a list that has recently been getting trimmed.
Weakness was noted as the uptrend came under pressure and the market (M criteria) earned the label of a correction. Investors should still be watchful for technical sell signals in individual issues. Despite two consecutive gains and the major indices' impressive rebound above their respective 50-day moving average (DMA) lines, a substantial follow-through-day between Day 4-7 of a new rally attempt is what the fact-based investment system suggests is the best signal for investors to shift their bias again toward buying.
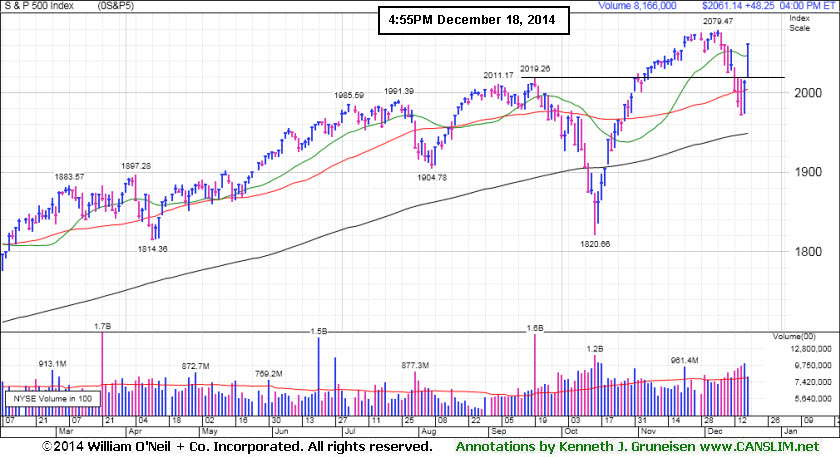
PICTURED: The S&P 500 index quickly rebounded toward its 52-week high, rallying back above prior highs after recovering from below its 50-day moving average (DMA) line on the prior session.
Equities jumped thanks to reassurance from the Fed that it is in no rush to raise interest rates. Wednesday's FOMC statement said the central bank will be "patient" in its timing of rate hikes and policy makers also delivered an upbeat assessment of the economy. Economic data was also encouraging. Jobless claims unexpectedly fell last week to a six-week low of 289,000 and the leading indicators index rose for the third straight month.
Every sector in the S&P 500 advanced amid the renewed appeal for risk assets. Technology and healthcare were the best performing groups. Oracle (ORCL +10.18%) posted its biggest gain since June 2009 after the company topped earnings expectations for the first time in a year. Biotech stocks jumped, led by Biogen's (BIIB +6.25%) gain. The energy sector finished higher, but oil refiners Tesoro (TSO -4.6%) and Valero (VLO -1.7%) lagged behind as WTI crude fell -3.2% to $54.66.
Treasuries experienced a selloff. The 10-year note fell 20/32 to yield 2.21%. The 30-year bond lost nearly two full points to yield 2.82%.
Disciplined investors know that new buying efforts should only be made in stocks when all fundamental and technical guidelines are met. This should be done as the stock is breaking out of a sound base pattern. Historic studies have shown that odds are not as favorable for investors when buying stocks on pullbacks.
The Featured Stocks Page shows recent notes and Headline Links directing members to detailed analysis with data-packed graphs annotated by a Certified expert. See the Premium Member Homepage for archives to all prior pay reports published.
|
 Kenneth J. Gruneisen started out as a licensed stockbroker in August 1987, a couple of months prior to the historic stock market crash that took the Dow Jones Industrial Average down -22.6% in a single day. He has published daily fact-based fundamental and technical analysis on high-ranked stocks online for two decades. Through FACTBASEDINVESTING.COM, Kenneth provides educational articles, news, market commentary, and other information regarding proven investment systems that work in good times and bad.
Comments contained in the body of this report are technical opinions only and are not necessarily those of Gruneisen Growth Corp. The material herein has been obtained from sources believed to be reliable and accurate, however, its accuracy and completeness cannot be guaranteed. Our firm, employees, and customers may effect transactions, including transactions contrary to any recommendation herein, or have positions in the securities mentioned herein or options with respect thereto. Any recommendation contained in this report may not be suitable for all investors and it is not to be deemed an offer or solicitation on our part with respect to the purchase or sale of any securities. |
|
 |
Tech, Financial, Retail, and Commodity-Linked Groups Rose
Kenneth J. Gruneisen - Passed the CAN SLIM® Master's Exam
Financial shares helped underpin the market's big rebound as the Bank Index ($BKX +2.57%) outpaced the Broker/Dealer Index ($XBD +1.96%). The Retail Index ($RLX +1.34%) posted a smaller gain, meanwhile the tech sector saw unanimous gains from the Semiconductor Index ($SOX +1.86%), Networking Index ($NWX +3.04%), and the Biotechnology Index ($BTK +3.34%). The Gold & Silver Index ($XAU +4.45%) was a standout gainer. Energy-related shares also rose, however the Oil Services Index ($OSX +0.97%) and the Integrated Oil Index ($XOI +1.72%) lagged behind most other groups.
Charts courtesy www.stockcharts.com
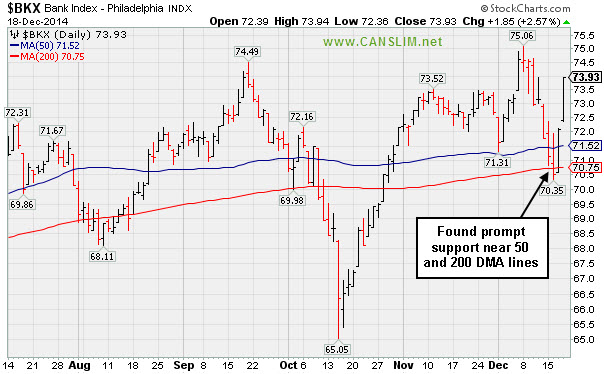
PICTURED: The Bank Index ($BKX +2.57%) found prompt support this week near its 50-day and 200-day moving average (DMA) lines.
| Oil Services |
$OSX |
208.33 |
+2.00 |
+0.97% |
-25.87% |
| Integrated Oil |
$XOI |
1,325.28 |
+22.36 |
+1.72% |
-11.83% |
| Semiconductor |
$SOX |
688.12 |
+12.54 |
+1.86% |
+28.61% |
| Networking |
$NWX |
357.04 |
+10.55 |
+3.04% |
+10.22% |
| Broker/Dealer |
$XBD |
184.04 |
+3.53 |
+1.96% |
+14.62% |
| Retail |
$RLX |
1,004.41 |
+13.24 |
+1.34% |
+6.87% |
| Gold & Silver |
$XAU |
69.47 |
+2.96 |
+4.45% |
-17.45% |
| Bank |
$BKX |
73.93 |
+1.85 |
+2.57% |
+6.74% |
| Biotech |
$BTK |
3,512.10 |
+113.44 |
+3.34% |
+50.71% |
|
|
|
 |
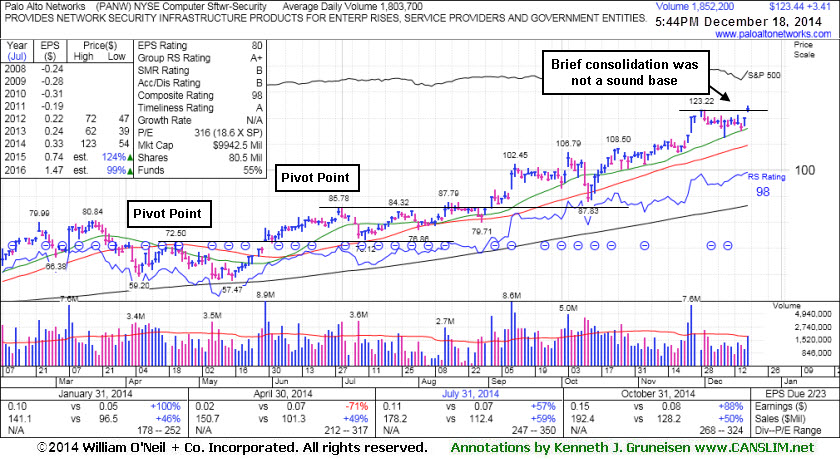
Latest Consolidation Was Not a Base of Sufficient Length
Kenneth J. Gruneisen - Passed the CAN SLIM® Master's Exam
Palo Alto Networks (PANW -$3.29 or -2.67% to $119.71) gapped up and hit new all-time highs with average volume behind today's gain. It has not formed any sound base of sufficient length. The 50-day moving average (DMA) line defines near-term support to watch below recent lows. It recently reported earnings +88% on +50% sales revenues for the Oct '14 quarter. PANW was last shown in this FSU section with annotated graphs on 12/01/14 under the headline, "Under Accumulation But Extended From Sound Base". Disciplined investors avoid chasing extended stocks more the +5% above prior highs and they always limit losses by selling any stock that falls more than -7% from their purchase price.
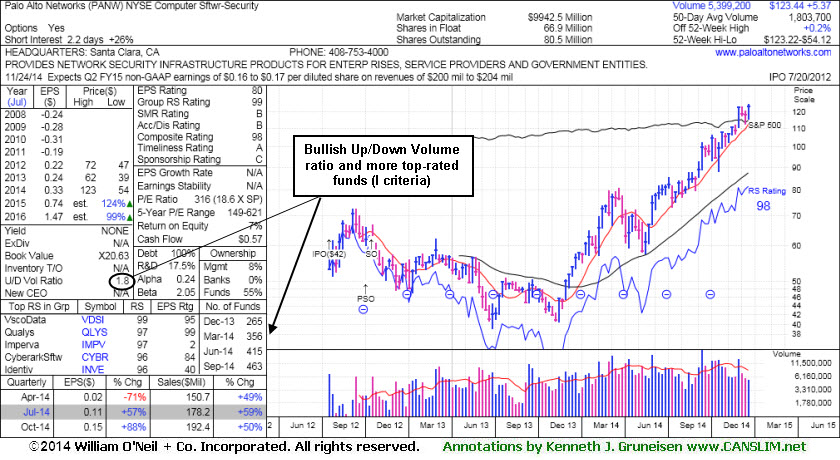
The number of top-rated funds owning its shares rose from 246 in Jun '13 to 463 in Sep '14, a reassuring sign concerning the I criteria. Its small supply (S criteria) of 66.9 million shares in the public float is another favorable characteristic. Its current Up/Down Volume Ratio of 1.8 is an unbiased indication its shares have been under accumulation over the past 50 days.
The Computer Software - Security firm has an Earnings Per Share (EPS) Rating of 80. Reviewing prior reports with annotated graphs carefully, it appears that the Apr '14 quarter now shows a -71% earnings comparison versus the year ago period. Previous annotated graphs published showed a more favorable comparison with strong sales revenues increases and earnings above the +25% minimum guideline satisfying the C criteria. It is unclear what prompted the apparent adjustment in the numbers as reported by the graph provider. Members are reminded that the fact-based investment system suggests waiting for the right time to buy, and only buying stocks showing strong quarterly and annual earnings (A criteria) increases.
|
|
|
Color Codes Explained :
Y - Better candidates highlighted by our
staff of experts.
G - Previously featured
in past reports as yellow but may no longer be buyable under the
guidelines.
***Last / Change / Volume data in this table is the closing quote data***
Symbol/Exchange
Company Name
Industry Group |
PRICE |
CHANGE
(%Change) |
Day High |
Volume
(% DAV)
(% 50 day avg vol) |
52 Wk Hi
% From Hi |
Featured
Date |
Price
Featured |
Pivot Featured |
|
Max Buy |
ACT
-
NYSE
Actavis plc
Medical-Generic Drugs
|
$263.75
|
+2.85
1.09% |
$268.37
|
3,313,878
103.53% of 50 DAV
50 DAV is 3,201,000
|
$272.75
-3.30%
|
6/20/2014
|
$216.53
|
PP = $230.87
|
|
MB = $242.41
|
Most Recent Note - 12/16/2014 5:54:54 PM
G - Consolidating following recent volume-driven gains on news it plans to acquire Allergan (AGN) for $66 Billion. Extended from prior highs in the $249 area defining near-term support.
>>> FEATURED STOCK ARTICLE : Consolidating After Rally on Acquisition Plans - 12/12/2014
View all notes |
Set NEW NOTE alert |
CANSLIM.net Company Profile |
SEC
News |
Chart |
Request a new note
C
A N
S L
I M


|
AFSI
-
NASDAQ
Amtrust Financial Svcs
INSURANCE - Property and; Casualty Insurance
|
$57.61
|
-0.13
-0.22% |
$59.08
|
748,441
69.75% of 50 DAV
50 DAV is 1,073,000
|
$59.31
-2.87%
|
10/17/2014
|
$45.24
|
PP = $46.02
|
|
MB = $48.32
|
 Most Recent Note - 12/18/2014 6:13:00 PM
G - Hovering near its 52-week high, stubbornly holding its ground with volume totals cooling. Recently rose from a brief consolidation, not a sound base. Prior highs in the $53 area define initial support above its 50 DMA line.
>>> FEATURED STOCK ARTICLE : Extended From Sound Base Pattern Identified Earlier - 12/10/2014
View all notes |
Set NEW NOTE alert |
CANSLIM.net Company Profile |
SEC
News |
Chart |
Request a new note
C
A N
S L
I M
|
ALXN
-
NASDAQ
Alexion Pharmaceuticals
DRUGS - Drug Manufacturers - Other
|
$188.96
|
+6.88
3.78% |
$189.01
|
1,290,285
115.31% of 50 DAV
50 DAV is 1,119,000
|
$203.30
-7.05%
|
10/23/2014
|
$184.01
|
PP = $185.53
|
|
MB = $194.81
|
Most Recent Note - 12/18/2014 6:15:58 PM
G - Prompt rebound above its 50 DMA line helped its outlook improve after damaging losses, but it faces resistance due to overhead supply up through $203. See the latest FSU analysis for more details with annotated graphs.
>>> FEATURED STOCK ARTICLE : Recent 50-Day Moving Average Violation Triggered Sell Signal - 12/17/2014
View all notes |
Set NEW NOTE alert |
CANSLIM.net Company Profile |
SEC
News |
Chart |
Request a new note
C
A N
S L
I M
|
BIDU
-
NASDAQ
Baidu Inc Ads
INTERNET - Internet Information Providers
|
$231.88
|
+8.03
3.59% |
$233.25
|
2,753,022
74.73% of 50 DAV
50 DAV is 3,684,000
|
$251.99
-7.98%
|
10/30/2014
|
$234.08
|
PP = $231.51
|
|
MB = $243.09
|
Most Recent Note - 12/18/2014 6:17:08 PM
G - Rebound above its 50 DMA line helped its technical stance, but recent gains came with light volume after losses on higher volume. Previously noted - "Additional damaging losses would trigger more worrisome technical sell signals."
>>> FEATURED STOCK ARTICLE : Consolidating Near Prior Highs and Above 50-Day Average - 12/3/2014
View all notes |
Set NEW NOTE alert |
CANSLIM.net Company Profile |
SEC
News |
Chart |
Request a new note
C
A N
S L
I M
|
EPAM
-
NYSE
Epam Systems Inc
COMPUTER SOFTWARE and SERVICES - Information Technology Service
|
$48.29
|
-0.08
-0.17% |
$49.39
|
405,102
93.34% of 50 DAV
50 DAV is 434,000
|
$52.89
-8.70%
|
10/23/2014
|
$45.21
|
PP = $46.09
|
|
MB = $48.39
|
Most Recent Note - 12/16/2014 5:50:40 PM
G - Violated its 50 DMA line with today's volume-driven loss triggering a technical sell signal. Testing prior highs in the $45-46 area defining the next important near-term support to watch. See the latest FSU analysis for more details and new annotated graphs.
>>> FEATURED STOCK ARTICLE : Violated 50-Day Moving Average Triggering Technical Sell Signal - 12/16/2014
View all notes |
Set NEW NOTE alert |
CANSLIM.net Company Profile |
SEC
News |
Chart |
Request a new note
C
A N
S L
I M
|
Symbol/Exchange
Company Name
Industry Group |
PRICE |
CHANGE
(%Change) |
Day High |
Volume
(% DAV)
(% 50 day avg vol) |
52 Wk Hi
% From Hi |
Featured
Date |
Price
Featured |
Pivot Featured |
|
Max Buy |
FB
-
NASDAQ
Facebook Inc Cl A
INTERNET
|
$78.40
|
+2.29
3.01% |
$78.40
|
34,154,004
97.93% of 50 DAV
50 DAV is 34,876,000
|
$81.16
-3.40%
|
9/9/2014
|
$76.67
|
PP = $76.84
|
|
MB = $80.68
|
Most Recent Note - 12/16/2014 2:56:03 PM
Y - Quietly consolidating near its 50 DMA line ($75.80). Recent lows in the $72 area define the next chart support level above its 200 DMA line.
>>> FEATURED STOCK ARTICLE : Gains Above 50-Day Moving Average Needed for Outlook to Improve - 12/4/2014
View all notes |
Set NEW NOTE alert |
CANSLIM.net Company Profile |
SEC
News |
Chart |
Request a new note
C
A N
S L
I M
|
ILMN
-
NASDAQ
Illumina Inc
DRUGS - Biotechnology
|
$187.29
|
+6.08
3.36% |
$187.46
|
1,404,285
113.25% of 50 DAV
50 DAV is 1,240,000
|
$197.37
-5.11%
|
10/22/2014
|
$188.77
|
PP = $182.27
|
|
MB = $191.38
|
Most Recent Note - 12/18/2014 6:19:09 PM
G - Prompt rebound above the 50 DMA line with today's volume-driven gain helped its outlook improve, but it faces some resistance due to overhead supply up through $197.
>>> FEATURED STOCK ARTICLE : Violation of 50-Day Average Triggered Technical Sell Signal - 12/15/2014
View all notes |
Set NEW NOTE alert |
CANSLIM.net Company Profile |
SEC
News |
Chart |
Request a new note
C
A N
S L
I M
|
PANW
-
NYSE
Palo Alto Networks
Computer Sftwr-Security
|
$123.44
|
+3.41
2.84% |
$124.95
|
1,855,373
101.83% of 50 DAV
50 DAV is 1,822,000
|
$123.22
0.18%
|
7/30/2014
|
$84.21
|
PP = $85.88
|
|
MB = $90.17
|
Most Recent Note - 12/18/2014 6:07:26 PM
G - Gapped up today and hit a new all-time high, but it has not formed a sound base. The 50 DMA line defines near-term support to watch below recent lows. See the latest FSU analysis for more details and new annotated graphs.
>>> FEATURED STOCK ARTICLE : Latest Consolidation Was Not a Base of Sufficient Length - 12/18/2014
View all notes |
Set NEW NOTE alert |
CANSLIM.net Company Profile |
SEC
News |
Chart |
Request a new note
C
A N
S L
I M
|
RH
-
NYSE
Restoration Hardware Hld
RETAIL - Home Furnishing Stores
|
$99.07
|
+2.50
2.59% |
$100.66
|
1,500,612
158.46% of 50 DAV
50 DAV is 947,000
|
$99.44
-0.37%
|
12/11/2014
|
$98.66
|
PP = $94.60
|
|
MB = $99.33
|
Most Recent Note - 12/18/2014 6:09:36 PM
G - Color code was changed to green after trading above its "max buy" level. Disciplined investors avoid chasing stocks more than +5% above prior highs. Subsequent losses leading to a close below its old high close ($93.05 on 6/30/14) would completely negate the recent breakout and raise concerns.
>>> FEATURED STOCK ARTICLE : Close in Lower Third of Intra-day Range Indicates Disributional Pressure - 12/11/2014
View all notes |
Set NEW NOTE alert |
CANSLIM.net Company Profile |
SEC
News |
Chart |
Request a new note
C
A N
S L
I M
|
UIHC
-
NASDAQ
United Insurance Holding
Insurance-Prop/Cas/Titl
|
$21.14
|
+0.36
1.73% |
$21.73
|
197,340
82.23% of 50 DAV
50 DAV is 240,000
|
$22.32
-5.29%
|
12/5/2014
|
$20.64
|
PP = $20.31
|
|
MB = $21.33
|
Most Recent Note - 12/16/2014 1:34:33 PM
Y - Color code is changed to yellow while consolidating above prior highs near $20 defining initial support to watch on pullbacks. Disciplined investors avoid chasing stocks more than +5% above prior highs and always limit losses by selling any stock that falls more than -7% from its purchase price. Keep in mind that deterioration in the broader market (M criteria) has raised a caution flag.
>>> FEATURED STOCK ARTICLE : Technical Breakout Indicative of Institutional Demand - 12/5/2014
View all notes |
Set NEW NOTE alert |
CANSLIM.net Company Profile |
SEC
News |
Chart |
Request a new note
C
A N
S L
I M
|
Symbol/Exchange
Company Name
Industry Group |
PRICE |
CHANGE
(%Change) |
Day High |
Volume
(% DAV)
(% 50 day avg vol) |
52 Wk Hi
% From Hi |
Featured
Date |
Price
Featured |
Pivot Featured |
|
Max Buy |
|
|
|
THESE ARE NOT BUY RECOMMENDATIONS!
Comments contained in the body of this report are technical
opinions only. The material herein has been obtained
from sources believed to be reliable and accurate, however,
its accuracy and completeness cannot be guaranteed.
This site is not an investment advisor, hence it does
not endorse or recommend any securities or other investments.
Any recommendation contained in this report may not
be suitable for all investors and it is not to be deemed
an offer or solicitation on our part with respect to
the purchase or sale of any securities. All trademarks,
service marks and trade names appearing in this report
are the property of their respective owners, and are
likewise used for identification purposes only.
This report is a service available
only to active Paid Premium Members.
You may opt-out of receiving report notifications
at any time. Questions or comments may be submitted
by writing to Premium Membership Services 665 S.E. 10 Street, Suite 201 Deerfield Beach, FL 33441-5634 or by calling 1-800-965-8307
or 954-785-1121.
|
|
|

