You are not logged in.
This means you
CAN ONLY VIEW reports that were published prior to Monday, April 7, 2025.
You
MUST UPGRADE YOUR MEMBERSHIP if you want to see any current reports.
AFTER MARKET UPDATE - TUESDAY, DECEMBER 17TH, 2024
Previous After Market Report Next After Market Report >>>
|
|
|
|
DOW |
-267.58 |
43,449.90 |
-0.61% |
|
Volume |
1,165,582,875 |
+6% |
|
Volume |
9,585,325,700 |
+9% |
|
NASDAQ |
-64.83 |
20,109.06 |
-0.32% |
|
Advancers |
752 |
28% |
|
Advancers |
1,547 |
36% |
|
S&P 500 |
-23.45 |
6,050.63 |
-0.39% |
|
Decliners |
1,965 |
72% |
|
Decliners |
2,773 |
64% |
|
Russell 2000 |
-27.91 |
2,334.08 |
-1.18% |
|
52 Wk Highs |
43 |
|
|
52 Wk Highs |
121 |
|
|
S&P 600 |
-20.82 |
1,473.23 |
-1.39% |
|
52 Wk Lows |
160 |
|
|
52 Wk Lows |
230 |
|
|
 |
Major Indices Ended Lower With Less Leadership
Kenneth J. Gruneisen - Passed the CAN SLIM® Master's Exam
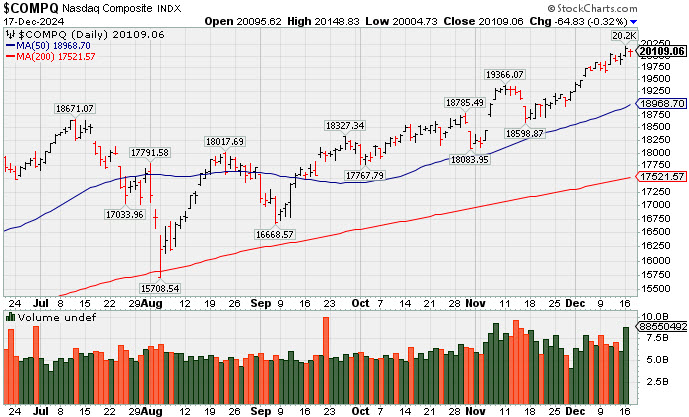
The S&P 500 Index (-0.4%), Nasdaq Composite (-0.3%), and Dow Jones Industrial Average (-0.6%) each suffered modest losses while the Russell 2000 Index underperformed, dropping -1.2%. Volume was higher than the prior session totals on the NYSE and on the Nasdaq exchange. Decliners led advancers by almost a 5-2 margin at the NYSE and by nearly 2-1 at the Nasdaq exchange. There were 22 high-ranked companies from the Leaders List that hit new 52-week highs and were listed on the BreakOuts Page, versus the total of 34 on the prior session. New 52-week lows outnumbered new 52-week highs on the NYSE and on the Nasdaq exchange. The major indices are in a confirmed uptrend (M criteria). Disciplined investors know that new buying efforts are only to be made in stocks meeting all key criteria of the fact-based investment system.
PICTURED: The Nasdaq Composite Index pulled back from its all-time high.
UnitedHealth (UNH -2.60%) was a laggard, along with managed care stocks with pharmacy benefit manager divisions like CVS (CVS -5.49%). The selling followed comments from President-elect Trump that he wants to "knock out the drug industry middle man" contributing to higher drug prices. NVIDIA (NVDA -1.22%) underperformed along with other chipmakers including Broadcom (AVGO -3.91%). Meanwhile, Tesla (TSLA +3.6%) posted a solid gain which provided some offsetting support to the broader market.
A fresh $13 billion 20-yr bond sale was met with relatively weak demand.The 10-yr note yield settled two basis points lower at 4.38%. The 2-yr yield settled unchanged at 4.24%. This price action followed the November retail sales report, which showed a soft 0.2% increase in sales, excluding autos.
|
 Kenneth J. Gruneisen started out as a licensed stockbroker in August 1987, a couple of months prior to the historic stock market crash that took the Dow Jones Industrial Average down -22.6% in a single day. He has published daily fact-based fundamental and technical analysis on high-ranked stocks online for two decades. Through FACTBASEDINVESTING.COM, Kenneth provides educational articles, news, market commentary, and other information regarding proven investment systems that work in good times and bad.
Comments contained in the body of this report are technical opinions only and are not necessarily those of Gruneisen Growth Corp. The material herein has been obtained from sources believed to be reliable and accurate, however, its accuracy and completeness cannot be guaranteed. Our firm, employees, and customers may effect transactions, including transactions contrary to any recommendation herein, or have positions in the securities mentioned herein or options with respect thereto. Any recommendation contained in this report may not be suitable for all investors and it is not to be deemed an offer or solicitation on our part with respect to the purchase or sale of any securities. |
|
 |
Financial, Retail, Tech, and Commodity-Linked Groups Fell
Kenneth J. Gruneisen - Passed the CAN SLIM® Master's Exam
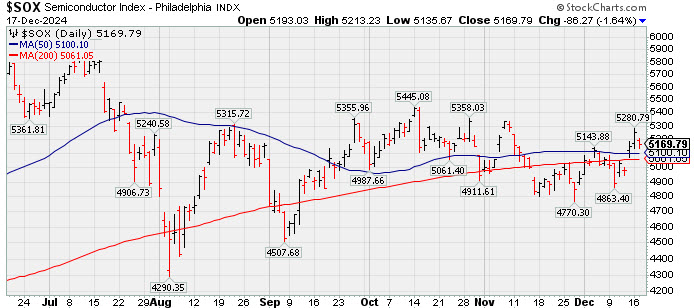
The Broker/Dealer Index ($XBD -1.54%) and the Bank Index ($BKX -1.48%) both lost ground and outpaced the Retail Index ($RLX -0.73%) to the downside on Tuesday. The tech sector had a negative bias as the Semiconductor Index ($SOX -1.64%) and the Networking Index ($NWX -2.16%) both lost ground while the Biotech Index ($BTK +0.25%) eked out a small gain. Commodity-linked groups also had a negative bias as the Gold & Silver Index ($XAU -0.81%), Oil Services Index ($OSX -1.07%), and the Integrated Oil Index ($XOI -0.42%) each finished the session lower.
PICTURED: The Semiconductor Index ($SOX -1.64%) ended with a loss, consolidating after recently rebounding above its 50-day and 200-day moving average lines.
| Oil Services |
$OSX |
72.56 |
-0.79 |
-1.07% |
-13.49% |
| Integrated Oil |
$XOI |
1,760.96 |
-7.44 |
-0.42% |
-5.45% |
| Semiconductor |
$SOX |
5,169.79 |
-86.27 |
-1.64% |
+23.81% |
| Networking |
$NWX |
1,286.22 |
-28.34 |
-2.16% |
+54.44% |
| Broker/Dealer |
$XBD |
821.17 |
-12.81 |
-1.54% |
+47.35% |
| Retail Index |
$RLX |
5,392.83 |
-39.56 |
-0.73% |
+38.68% |
| Gold & Silver |
$XAU |
145.26 |
-1.18 |
-0.81% |
+15.57% |
| Bank |
$BKX |
130.32 |
-1.96 |
-1.48% |
+35.72% |
| Biotech |
$BTK |
5,932.62 |
+14.69 |
+0.25% |
+9.48% |
|
|
|
 |
Volume-Driven Gain for New High Triggered Technical Buy Signal
Kenneth J. Gruneisen - Passed the CAN SLIM® Master's Exam
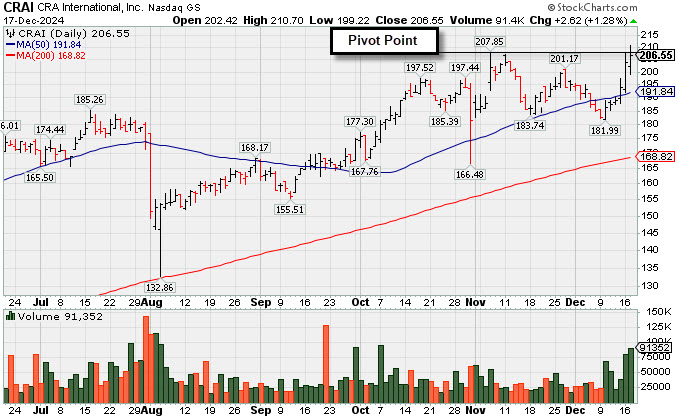
CRA International (CRAI +$3.11or +1.53% to $207.04) was highlighted in yellow in the earlier mid-day report (read here) with pivot point cited based on its 11/06/24 high plus 10 cents after a 6-week base. The thinly-traded Commercial Services - Consulting firm hit a new all-time high with today's 6th consecutive gain backed by +159% above average volume and it closed above the pivot point triggering a technical buy signal.
CRAI reported Sep '24 quarterly earnings +57% on +14% sales revenues versus the year-ago period, its 3rd strong quarter above the +25% minimum earnings guideline (C criteria). Annual earnings (A criteria) growth has been strong and steady. It has a 97 Earnings Per Share Rating, well above the 80+ minimum guideline for buy candidates.
The company has a small supply of only 6.8 million shares outstanding (S criteria) which can contribute to greater price volatility in the event of institutional buying or selling. The number of top-rated funds owning its shares rose from 283 in Mar '24 to 306 in Sep '24, a reassuring sign concerning the I criteria. Its current Up/Down Volume Ratio of 2.1 is an unbiased indication its shares have been under accumulation over the past 50 days. It has an A Accumulation/Distribution Rating and an A Timeliness Rating.
Chart courtesy of www.stockcharts.com
 Symbol/Exchange
Company Name
Industry Group | PRICE | CHANGE
(%Change) | Day High | Volume
(% DAV)
(% 50 day avg vol) | 52 Wk Hi
% From Hi | Featured
Date | Price
Featured | Pivot Featured | | Max Buy |  USLM - NASDAQ USLM - NASDAQ
U.S. Lime & Minerals
Bldg-Cement/Concrt/Ag | $141.40 | -2.78
-1.93% | $143.00 | 119,237
124.21% of 50 DAV
50 DAV is 96,000 | $159.53
-11.36%
| 9/17/2024 | $71.26 | PP = $87.23 | | MB = $91.59 | Most Recent Note - 12/16/2024 12:46:21 PM
G - Consolidating in an orderly fashion near its all-time high. Its 50 DMA line ($128) defines important near-term support to watch on pullbacks. It has been noted repeatedly as - "Very extended from any sound base".
>>> FEATURED STOCK ARTICLE : Extended From Any Sound Base After Impressive Rally - 11/12/2024 | View all notes | Set NEW NOTE alert | Company Profile | SEC News | Chart | Request a new note C A S I | GVA - NYSE
Granite Construction
Bldg-Heavy Construction | $91.78 | -1.48
-1.59% | $92.81 | 595,747
89.59% of 50 DAV
50 DAV is 665,000 | $105.20
-12.76%
| 6/11/2024 | $59.76 | PP = $64.33 | | MB = $67.55 |  Most Recent Note - 12/17/2024 2:02:05 PM Most Recent Note - 12/17/2024 2:02:05 PM
G - Testing its 50 DMA line ($91.17) today wit its 8th loss in the span of 9 sessions after a "negative reversal" at its all-time high. More damaging losses may trigger a technical sell signal. Reported Sep ''24 quarterly earnings +19% on +14% sales revenues versus the year-ago period, repeatedly noted as "below the +25% minimum guideline (C criteria) of the fact-based investment system."
>>> FEATURED STOCK ARTICLE : Negative Reversal After Hitting New All-Time High - 12/6/2024 | View all notes | Set NEW NOTE alert | Company Profile | SEC News | Chart | Request a new note C A S I | TXRH - NASDAQ
Texas Roadhouse
Retail-Restaurants | $186.92 | -0.61
-0.33% | $188.12 | 536,581
76.87% of 50 DAV
50 DAV is 698,000 | $206.04
-9.28%
| 7/26/2024 | $173.08 | PP = $175.82 | | MB = $184.61 | Most Recent Note - 12/17/2024 3:08:24 PM
G - Quietly slumped below its 50 DMA line ($190) raising concerns with recent losses backed by light volume. A prompt rebound above the 50 DMA line is needed for its outlook to improve.
>>> FEATURED STOCK ARTICLE : Hovering Near High After Recent Volume-driven Gains - 11/15/2024 | View all notes | Set NEW NOTE alert | Company Profile | SEC News | Chart | Request a new note C A S I | HWM - NYSE
Howmet Aerospace
Aerospace/Defense | $111.93 | -1.35
-1.19% | $112.58 | 2,638,228
114.51% of 50 DAV
50 DAV is 2,304,000 | $120.71
-7.27%
| 7/30/2024 | $93.95 | PP = $85.52 | | MB = $89.80 | Most Recent Note - 12/17/2024 1:57:05 PM
G - Pulling back today for a 4th consecutive loss with lighter volume. Its 50 DMA line ($110.14) and prior high ($106.93 on 10/21/24) define near-term support levels to watch. Fundamentals remain strong.
>>> FEATURED STOCK ARTICLE : Extended From Prior Base and Perched at High - 12/5/2024 | View all notes | Set NEW NOTE alert | Company Profile | SEC News | Chart | Request a new note C A S I | NGVC - NYSE
Natural Grocers
Retail-Super/Mini Mkts | $40.74 | -0.79
-1.90% | $41.86 | 125,891
122.22% of 50 DAV
50 DAV is 103,000 | $47.57
-14.36%
| 11/5/2024 | $30.57 | PP = $30.42 | | MB = $31.94 | Most Recent Note - 12/16/2024 4:18:47 PM
G - Pulled back for a 3rd consecutive loss, retreating from its all-time high after getting very extended from any sound base. Reported Sep '24 quarterly earnings +50% on +9% sales revenues versus the year-ago period. Its 50 DMA line ($34.23) defines near-term support above prior highs in the $30 area. See the latest FSU analysis for more details and a new annotated graph..
>>> FEATURED STOCK ARTICLE : Consolidating After Considerable Rally to New Highs - 12/16/2024 | View all notes | Set NEW NOTE alert | Company Profile | SEC News | Chart | Request a new note C A S I | Symbol/Exchange
Company Name
Industry Group | PRICE | CHANGE
(%Change) | Day High | Volume
(% DAV)
(% 50 day avg vol) | 52 Wk Hi
% From Hi | Featured
Date | Price
Featured | Pivot Featured | | Max Buy | CLS - NYSE
Celestica
Elec-Contract Mfg | $97.79 | -1.22
-1.23% | $100.44 | 1,462,274
57.93% of 50 DAV
50 DAV is 2,524,000 | $100.51
-2.71%
| 10/11/2024 | $57.62 | PP = $63.59 | | MB = $66.77 | Most Recent Note - 12/17/2024 3:09:50 PM
G - Stubbornly holding its ground with volume totals cooling after rallying with above-average volume to a new all-time high. It is very extended from any sound base. Its 50 DMA line ($76) defines initial support to watch on pullbacks.
>>> FEATURED STOCK ARTICLE : Pulling Back After Considerable Rally - 11/13/2024 | View all notes | Set NEW NOTE alert | Company Profile | SEC News | Chart | Request a new note C A S I | PAY - NYSE
Paymentus Holdings
Finance-CrdtCard/PmtPr | $35.71 | -0.04
-0.11% | $35.98 | 462,158
112.17% of 50 DAV
50 DAV is 412,000 | $38.94
-8.29%
| 10/17/2024 | $26.15 | PP = $25.31 | | MB = $26.58 | Most Recent Note - 12/16/2024 12:49:32 PM
G - Consolidating well above its 50 DMA line ($29.68) which defines important near-term support to watch. It is extended from any sound base.
>>> FEATURED STOCK ARTICLE : Extended From Prior Base After Considerable Spike Higher - 11/14/2024 | View all notes | Set NEW NOTE alert | Company Profile | SEC News | Chart | Request a new note C A S I | RMD - NYSE
Resmed Inc
HEALTH SERVICES - Medical Appliances and Equipment | $242.62 | +1.60
0.66% | $245.19 | 710,028
78.33% of 50 DAV
50 DAV is 906,500 | $260.49
-6.86%
| 10/25/2024 | $256.64 | PP = $255.28 | | MB = $268.04 | Most Recent Note - 12/17/2024 1:59:06 PM
G - Rebounding near its 50 DMA line ($242.78) with today''s gain following a "positive reversal" on the prior session after undercutting the prior low ($231.17). Its Relative Strength Rating has slumped to 75, below the 80+ minimum guideline for buy candidates, raising concerns.
>>> FEATURED STOCK ARTICLE : Recent Slump Below 50-Day Moving Average Raised Concerns - 11/18/2024 | View all notes | Set NEW NOTE alert | Company Profile | SEC News | Chart | Request a new note C A S I | ATGE - NYSE
Adtalem Global Education
Consumer Svcs-Education | $90.24 | -1.23
-1.34% | $91.99 | 343,281
97.80% of 50 DAV
50 DAV is 351,000 | $92.93
-2.89%
| 10/30/2024 | $83.34 | PP = $80.28 | | MB = $84.29 | Most Recent Note - 12/16/2024 12:44:56 PM
G - Consolidating in an orderly fashion near its all-time high. Its 50 DMA line ($83.20) defines initial support above prior highs in the $80 area. Fundamentals remain strong.
>>> FEATURED STOCK ARTICLE : Hovering Near High With Volume Totals Cooling - 12/4/2024 | View all notes | Set NEW NOTE alert | Company Profile | SEC News | Chart | Request a new note C A S I | TW - NASDAQ
Tradeweb Markets
Financial Svcs-Specialty | $133.25 | -0.29
-0.22% | $134.20 | 580,481
65.81% of 50 DAV
50 DAV is 882,000 | $141.69
-5.96%
| 11/19/2024 | $134.41 | PP = $136.23 | | MB = $143.04 | Most Recent Note - 12/17/2024 3:07:38 PM
Y - Consolidating above its 50 DMA line ($132) after encountering distributional pressure. Since recently featured it has not produced a volume-driven gain above the pivot point to trigger a proper technical buy signal. It was highlighted in yellow with pivot point cited based on its 10/15/24 high plus 10 cents.
>>> FEATURED STOCK ARTICLE : Tradeweb Markets Perched Near High - 11/19/2024 | View all notes | Set NEW NOTE alert | Company Profile | SEC News | Chart | Request a new note C A S I | Symbol/Exchange
Company Name
Industry Group | PRICE | CHANGE
(%Change) | Day High | Volume
(% DAV)
(% 50 day avg vol) | 52 Wk Hi
% From Hi | Featured
Date | Price
Featured | Pivot Featured | | Max Buy | ATAT - NASDAQ
Atour Lifestyle Hldgs ADR
Leisure-Lodging | $28.23 | +1.26
4.67% | $28.66 | 1,269,950
97.61% of 50 DAV
50 DAV is 1,301,000 | $29.90
-5.59%
| 12/9/2024 | $29.34 | PP = $29.25 | | MB = $30.71 | Most Recent Note - 12/17/2024 12:11:57 PM
Y - Rallying near prior highs with today's big gain backed by higher volume. Found support near its 50 DMA line ($26.66). A violation would trigger a technical sell signal.
>>> FEATURED STOCK ARTICLE : Volume Above Average Behind Breakout Gain - 12/9/2024 | View all notes | Set NEW NOTE alert | Company Profile | SEC News | Chart | Request a new note C A S I | VEEV - NYSE
Veeva Systems Inc Cl A
Computer Sftwr-Medical | $226.41 | +1.72
0.77% | $227.13 | 1,339,739
123.12% of 50 DAV
50 DAV is 1,088,200 | $258.93
-12.56%
| 12/9/2024 | $250.70 | PP = $240.68 | | MB = $252.71 | Most Recent Note - 12/16/2024 12:48:00 PM
Y - It has slumped back well into the prior base raising concerns following a noted 12/06/24 "breakaway gap". Reported Oct '24 quarterly earnings +31% on +13% sales revenues versus the year-ago period, its 3rd consecutive quarterly comparison above the +25% minimum earnings guideline (C criteria). Annual earnings growth has been strong.
>>> FEATURED STOCK ARTICLE : Veeva Systems Consolidating After "Breakaway Gap" - 12/10/2024 | View all notes | Set NEW NOTE alert | Company Profile | SEC News | Chart | Request a new note C A S I | CRAI - NASDAQ
CRA International
Comml Svcs-Consulting | $207.04 | +3.11
1.53% | $210.70 | 78,601
218.34% of 50 DAV
50 DAV is 36,000 | $208.38
-0.64%
| 12/17/2024 | $208.34 | PP = $208.48 | | MB = $218.90 | Most Recent Note - 12/17/2024 5:01:30 PM
Y - Color code was changed to yellow in the earlier mid-day report with pivot point cited based on its 11/06/24 high plus 10 cents after a 6-week base. Hit a new all-time high with today's 6th consecutive gain backed by +159% above average volume triggering a technical buy signal. Reported Sep '24 quarterly earnings +57% on +14% sales revenues versus the year-ago period, its 3rd strong quarter above the +25% minimum earnings guideline (C criteria). Annual earnings (A criteria) growth has been strong and steady. See the latest FSU analysis for more details and a new annotated graph.
>>> FEATURED STOCK ARTICLE : Volume-Driven Gain for New High Triggered Technical Buy Signal - 12/17/2024 | View all notes | Set NEW NOTE alert | Company Profile | SEC News | Chart | Request a new note C A S I |
|
|
|
Color Codes Explained :
Y - Better candidates highlighted by our
staff of experts.
G - Previously featured
in past reports as yellow but may no longer be buyable under the
guidelines.
***Last / Change / Volume data in this table is the closing quote data***
|
|
|
THESE ARE NOT BUY RECOMMENDATIONS!
Comments contained in the body of this report are technical
opinions only. The material herein has been obtained
from sources believed to be reliable and accurate, however,
its accuracy and completeness cannot be guaranteed.
This site is not an investment advisor, hence it does
not endorse or recommend any securities or other investments.
Any recommendation contained in this report may not
be suitable for all investors and it is not to be deemed
an offer or solicitation on our part with respect to
the purchase or sale of any securities. All trademarks,
service marks and trade names appearing in this report
are the property of their respective owners, and are
likewise used for identification purposes only.
This report is a service available
only to active Paid Premium Members.
You may opt-out of receiving report notifications
at any time. Questions or comments may be submitted
by writing to Premium Membership Services 665 S.E. 10 Street, Suite 201 Deerfield Beach, FL 33441-5634 or by calling 1-800-965-8307
or 954-785-1121.
|
|
|