You are not logged in.
This means you
CAN ONLY VIEW reports that were published prior to Monday, April 7, 2025.
You
MUST UPGRADE YOUR MEMBERSHIP if you want to see any current reports.
AFTER MARKET UPDATE - FRIDAY, DECEMBER 13TH, 2024
Previous After Market Report Next After Market Report >>>
|
|
|
|
DOW |
-86.06 |
43,828.06 |
-0.20% |
|
Volume |
882,913,603 |
-1% |
|
Volume |
6,243,690,900 |
-14% |
|
NASDAQ |
+23.88 |
19,926.72 |
+0.12% |
|
Advancers |
881 |
32% |
|
Advancers |
1,515 |
35% |
|
S&P 500 |
-0.16 |
6,051.09 |
-0.00% |
|
Decliners |
1,854 |
68% |
|
Decliners |
2,767 |
65% |
|
Russell 2000 |
-14.19 |
2,346.90 |
-0.60% |
|
52 Wk Highs |
43 |
|
|
52 Wk Highs |
120 |
|
|
S&P 600 |
-9.60 |
1,488.63 |
-0.64% |
|
52 Wk Lows |
115 |
|
|
52 Wk Lows |
222 |
|
|
 |
Indices Little Changed With Negative Breadth and Fewer New Highs
Kenneth J. Gruneisen - Passed the CAN SLIM® Master's Exam
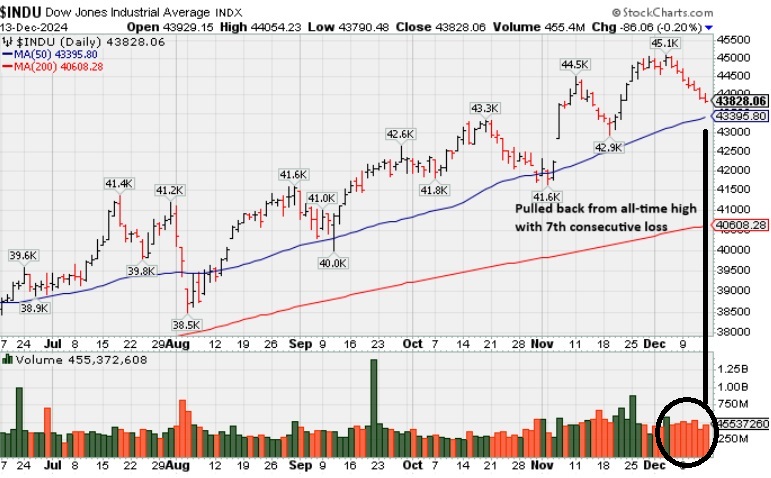
The Nasdaq Composite (+0.1%), and Dow Jones Industrial Average (-0.2%) closed within 0.2% of their prior closing levels. The Russell 2000 underperformed, dropping -0.6%. Volume was lighter than the prior session totals on the NYSE and on the Nasdaq exchange. Breadth was negative as decliners led advancers by more than a 2-1 margin at the NYSE and by nearly a 2-1 margin at the Nasdaq exchange. There were 18 high-ranked companies from the Leaders List that hit new 52-week highs and were listed on the BreakOuts Page, half the total of 39 on the prior session. New 52-week lows outnumbered new 52-week highs on the NYSE and on the Nasdaq exchange. The major indices are in a confirmed uptrend (M criteria). Disciplined investors know that new buying efforts are only to be made in stocks meeting all key criteria of the fact-based investment system.
PICTURED: The Dow Jones Industrial Average pulled back for a 7th consecutive loss while retreating from its all-time high.
Strong earnings and guidance from Broadcom (AVGO +24.4%) buoyed sentiment in the semiconductor sector. However, NVIDIA (NVDA -2.8%) reversed early gains after shares initially rallied +1.6%.
The 10-yr yield jumped eight basis points to 4.40% and the 2-yr yield settled five basis points higher at 4.24%. The recent movement followed disappointing inflation data, including weaker-than-expected November CPI and PPI reports, along with signs of softening in the labor market.
In the energy sector, WTI crude oil futures rose +1.7% to $71.29 per barrel. The International Energy Agency (IEA) forecasted an acceleration in global oil demand growth, from 840,000 barrels per day in 2024 to 1.1 million barrels per day in 2025. Oil prices have struggled to maintain levels above $70 per barrel since September. |
 Kenneth J. Gruneisen started out as a licensed stockbroker in August 1987, a couple of months prior to the historic stock market crash that took the Dow Jones Industrial Average down -22.6% in a single day. He has published daily fact-based fundamental and technical analysis on high-ranked stocks online for two decades. Through FACTBASEDINVESTING.COM, Kenneth provides educational articles, news, market commentary, and other information regarding proven investment systems that work in good times and bad.
Comments contained in the body of this report are technical opinions only and are not necessarily those of Gruneisen Growth Corp. The material herein has been obtained from sources believed to be reliable and accurate, however, its accuracy and completeness cannot be guaranteed. Our firm, employees, and customers may effect transactions, including transactions contrary to any recommendation herein, or have positions in the securities mentioned herein or options with respect thereto. Any recommendation contained in this report may not be suitable for all investors and it is not to be deemed an offer or solicitation on our part with respect to the purchase or sale of any securities. |
|
 |
Semiconductor and Networking Indexes Rose
Kenneth J. Gruneisen - Passed the CAN SLIM® Master's Exam
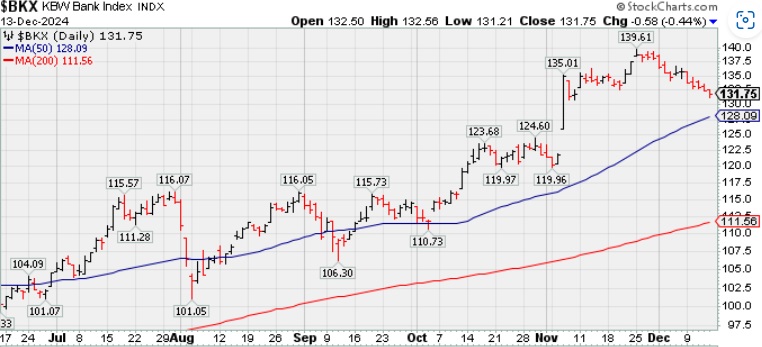
The Retail Index ($RLX -0.45%), Broker/Dealer Index ($XBD -0.44%), and the Bank Index ($BKX -0.44%) each ended lower with a modest loss. The tech sector was mixed as the Semiconductor Index ($SOX +3.36%) and the Networking Index ($NWX +2.19%) both posted solid gains but the Biotech Index ($BTK -0.73%) fell. Commodity-linked groups had a negative bias as the Gold & Silver Index ($XAU -2.39%) and Oil Services Index ($OSX -1.15%) both outpaced the Integrated Oil Index ($XOI -0.43%) to the downside.
PICTURED: The Bank Index ($BKX -0.44%) ended lower for a 5th consecutive session, slumping toward its 50-day moving average line.
| Oil Services |
$OSX |
74.71 |
-0.87 |
-1.15% |
-10.93% |
| Integrated Oil |
$XOI |
1,821.55 |
-7.85 |
-0.43% |
-2.20% |
| Semiconductor |
$SOX |
5,149.78 |
+167.59 |
+3.36% |
+23.33% |
| Networking |
$NWX |
1,288.58 |
+27.56 |
+2.19% |
+54.73% |
| Broker/Dealer |
$XBD |
829.69 |
-3.68 |
-0.44% |
+48.88% |
| Retail Index |
$RLX |
5,366.02 |
-24.08 |
-0.45% |
+37.99% |
| Gold & Silver |
$XAU |
147.92 |
-3.63 |
-2.39% |
+17.68% |
| Bank |
$BKX |
131.75 |
-0.58 |
-0.44% |
+37.21% |
| Biotech |
$BTK |
5,875.88 |
-43.14 |
-0.73% |
+8.44% |
|
|
|
 |
Featured Stocks
Kenneth J. Gruneisen - Passed the CAN SLIM® Master's Exam
|
|
|
Color Codes Explained :
Y - Better candidates highlighted by our
staff of experts.
G - Previously featured
in past reports as yellow but may no longer be buyable under the
guidelines.
***Last / Change / Volume data in this table is the closing quote data***
Symbol/Exchange
Company Name
Industry Group |
PRICE |
CHANGE
(%Change) |
Day High |
Volume
(% DAV)
(% 50 day avg vol) |
52 Wk Hi
% From Hi |
Featured
Date |
Price
Featured |
Pivot Featured |
|
Max Buy |
 USLM
-
NASDAQ
USLM
-
NASDAQ
U.S. Lime & Minerals
Bldg-Cement/Concrt/Ag
|
$145.94
|
-3.19
-2.14% |
$149.80
|
75,585
79.56% of 50 DAV
50 DAV is 95,000
|
$159.53
-8.52%
|
9/17/2024
|
$71.26
|
PP = $87.23
|
|
MB = $91.59
|
Most Recent Note - 12/9/2024 1:16:07 PM
G - Pulling back from its all-time high with today's 4th loss in the span of 5 sessions backed by above-average volume. Its 50 DMA line ($122.62) defines important near-term support to watch on pullbacks. It has been noted repeatedly as - "Very extended from any sound base".
>>> FEATURED STOCK ARTICLE : Extended From Any Sound Base After Impressive Rally - 11/12/2024 |
View all notes |
Set NEW NOTE alert |
Company Profile |
SEC
News |
Chart |
Request a new note
C
A
S
I |
GVA
-
NYSE
Granite Construction
Bldg-Heavy Construction
|
$93.44
|
-2.08
-2.18% |
$95.84
|
687,618
109.67% of 50 DAV
50 DAV is 627,000
|
$105.20
-11.18%
|
6/11/2024
|
$59.76
|
PP = $64.33
|
|
MB = $67.55
|
 Most Recent Note - 12/13/2024 6:58:17 PM
G - Pulled back today for its 6th loss in the span of 8 sessions, slumping from its all-time high toward its 50 DMA line ($90.72). Reported Sep '24 quarterly earnings +19% on +14% sales revenues versus the year-ago period, repeatedly noted as "below the +25% minimum guideline (C criteria) of the fact-based investment system."
>>> FEATURED STOCK ARTICLE : Negative Reversal After Hitting New All-Time High - 12/6/2024 |
View all notes |
Set NEW NOTE alert |
Company Profile |
SEC
News |
Chart |
Request a new note
C
A
S
I |
TXRH
-
NASDAQ
Texas Roadhouse
Retail-Restaurants
|
$186.86
|
-2.89
-1.52% |
$190.78
|
434,878
62.66% of 50 DAV
50 DAV is 694,000
|
$206.04
-9.31%
|
7/26/2024
|
$173.08
|
PP = $175.82
|
|
MB = $184.61
|
Most Recent Note - 12/13/2024 7:01:43 PM
G - Quietly slumped below its 50 DMA line ($190) raising concerns with its 3rd consecutive loss backed by light volume. A prompt rebound above the 50 DMA line is needed for its outlook to improve.
>>> FEATURED STOCK ARTICLE : Hovering Near High After Recent Volume-driven Gains - 11/15/2024 |
View all notes |
Set NEW NOTE alert |
Company Profile |
SEC
News |
Chart |
Request a new note
C
A
S
I |
HWM
-
NYSE
Howmet Aerospace
Aerospace/Defense
|
$113.43
|
-0.27
-0.24% |
$114.80
|
1,564,931
67.34% of 50 DAV
50 DAV is 2,324,000
|
$120.71
-6.03%
|
7/30/2024
|
$93.95
|
PP = $85.52
|
|
MB = $89.80
|
Most Recent Note - 12/12/2024 9:05:36 PM
G - Pulled back today with lighter volume. Retreating from its all-time high after getting extended from any sound base. Its prior high ($106.93 on 10/21/24) and 50 DMA line ($109.47) define near-term support levels to watch on pullbacks. Fundamentals remain strong.
>>> FEATURED STOCK ARTICLE : Extended From Prior Base and Perched at High - 12/5/2024 |
View all notes |
Set NEW NOTE alert |
Company Profile |
SEC
News |
Chart |
Request a new note
C
A
S
I |
NGVC
-
NYSE
Natural Grocers
Retail-Super/Mini Mkts
|
$42.00
|
-1.38
-3.18% |
$43.63
|
107,761
104.62% of 50 DAV
50 DAV is 103,000
|
$47.57
-11.71%
|
11/5/2024
|
$30.57
|
PP = $30.42
|
|
MB = $31.94
|
Most Recent Note - 12/12/2024 9:06:46 PM
G - Consolidating near its all-time high, extended from any sound base. Reported Sep '24 quarterly earnings +50% on +9% sales revenues versus the year-ago period. Prior high in the $30 area defines initial support to watch above its 50 DMA line.
>>> FEATURED STOCK ARTICLE : New High After 6th Consecutive Gain - 11/11/2024 |
View all notes |
Set NEW NOTE alert |
Company Profile |
SEC
News |
Chart |
Request a new note
C
A
S
I |
Symbol/Exchange
Company Name
Industry Group |
PRICE |
CHANGE
(%Change) |
Day High |
Volume
(% DAV)
(% 50 day avg vol) |
52 Wk Hi
% From Hi |
Featured
Date |
Price
Featured |
Pivot Featured |
|
Max Buy |
CLS
-
NYSE
Celestica
Elec-Contract Mfg
|
$99.20
|
+8.19
9.00% |
$99.34
|
4,116,049
166.84% of 50 DAV
50 DAV is 2,467,000
|
$96.00
3.33%
|
10/11/2024
|
$57.62
|
PP = $63.59
|
|
MB = $66.77
|
Most Recent Note - 12/13/2024 6:56:00 PM
G - Gapped up today and rallied with above-average volume to a new all-time high with its 3rd consecutive gain. It is very extended from any sound base. Its 50 DMA line ($76) defines initial support to watch on pullbacks.
>>> FEATURED STOCK ARTICLE : Pulling Back After Considerable Rally - 11/13/2024 |
View all notes |
Set NEW NOTE alert |
Company Profile |
SEC
News |
Chart |
Request a new note
C
A
S
I |
PAY
-
NYSE
Paymentus Holdings
Finance-CrdtCard/PmtPr
|
$34.35
|
-0.61
-1.74% |
$35.11
|
317,066
78.10% of 50 DAV
50 DAV is 406,000
|
$38.94
-11.79%
|
10/17/2024
|
$26.15
|
PP = $25.31
|
|
MB = $26.58
|
Most Recent Note - 12/10/2024 4:54:51 PM
G - Pulled back with higher volume today for a big 6th consecutive loss. Its 50 DMA line ($28.54) defines important near-term support to watch. It has been repeatedly noted as "extended from any sound base." Bullish action came after it reported Sep '24 quarterly earnings +67% on +52% sales revenues versus the year-ago period.
>>> FEATURED STOCK ARTICLE : Extended From Prior Base After Considerable Spike Higher - 11/14/2024 |
View all notes |
Set NEW NOTE alert |
Company Profile |
SEC
News |
Chart |
Request a new note
C
A
S
I |
RMD
-
NYSE
Resmed Inc
HEALTH SERVICES - Medical Appliances and Equipment
|
$238.52
|
-3.99
-1.65% |
$241.50
|
580,457
64.19% of 50 DAV
50 DAV is 904,300
|
$260.49
-8.43%
|
10/25/2024
|
$256.64
|
PP = $255.28
|
|
MB = $268.04
|
Most Recent Note - 12/12/2024 9:08:38 PM
G - Pulled back today with higher (near average) volume, sputtering near its 50 DMA line ($242). Its Relative Strength Rating has slumped to 73, below the 80+ minimum guideline for buy candidates, raisingb concerns.
>>> FEATURED STOCK ARTICLE : Recent Slump Below 50-Day Moving Average Raised Concerns - 11/18/2024 |
View all notes |
Set NEW NOTE alert |
Company Profile |
SEC
News |
Chart |
Request a new note
C
A
S
I |
ATGE
-
NYSE
Adtalem Global Education
Consumer Svcs-Education
|
$88.75
|
-0.65
-0.73% |
$90.32
|
228,978
65.80% of 50 DAV
50 DAV is 348,000
|
$92.93
-4.50%
|
10/30/2024
|
$83.34
|
PP = $80.28
|
|
MB = $84.29
|
Most Recent Note - 12/9/2024 2:09:21 PM
G - Pulling back from its all-time high with light volume behind today's loss and on most down sessions in recent weeks. Its 50 DMA line ($81.70) defines initial support above prior highs in the $80 area. Fundamentals remain strong.
>>> FEATURED STOCK ARTICLE : Hovering Near High With Volume Totals Cooling - 12/4/2024 |
View all notes |
Set NEW NOTE alert |
Company Profile |
SEC
News |
Chart |
Request a new note
C
A
S
I |
TW
-
NASDAQ
Tradeweb Markets
Financial Svcs-Specialty
|
$131.50
|
-0.98
-0.74% |
$133.97
|
971,304
110.25% of 50 DAV
50 DAV is 881,000
|
$141.69
-7.19%
|
11/19/2024
|
$134.41
|
PP = $136.23
|
|
MB = $143.04
|
Most Recent Note - 12/13/2024 7:00:08 PM
Y - Consolidating near its 50 DMA line ($132) after encountering distributional pressure. Since recently featured it has not produced a volume-driven gain above the pivot point to trigger a proper technical buy signal. It was highlighted in yellow with pivot point cited based on its 10/15/24 high plus 10 cents.
>>> FEATURED STOCK ARTICLE : Tradeweb Markets Perched Near High - 11/19/2024 |
View all notes |
Set NEW NOTE alert |
Company Profile |
SEC
News |
Chart |
Request a new note
C
A
S
I |
Symbol/Exchange
Company Name
Industry Group |
PRICE |
CHANGE
(%Change) |
Day High |
Volume
(% DAV)
(% 50 day avg vol) |
52 Wk Hi
% From Hi |
Featured
Date |
Price
Featured |
Pivot Featured |
|
Max Buy |
ATAT
-
NASDAQ
Atour Lifestyle Hldgs ADR
Leisure-Lodging
|
$27.01
|
-0.98
-3.48% |
$28.00
|
1,743,203
133.99% of 50 DAV
50 DAV is 1,301,000
|
$29.90
-9.67%
|
12/9/2024
|
$29.34
|
PP = $29.25
|
|
MB = $30.71
|
Most Recent Note - 12/13/2024 7:04:12 PM
Y - Suffered a loss today with higher volume, raising concerns while slumping near its 50 DMA line ($26.69). A violation would trigger a technical sell signal.
>>> FEATURED STOCK ARTICLE : Volume Above Average Behind Breakout Gain - 12/9/2024 |
View all notes |
Set NEW NOTE alert |
Company Profile |
SEC
News |
Chart |
Request a new note
C
A
S
I |
VEEV
-
NYSE
Veeva Systems Inc Cl A
Computer Sftwr-Medical
|
$228.78
|
-3.70
-1.59% |
$232.68
|
814,087
77.58% of 50 DAV
50 DAV is 1,049,300
|
$258.93
-11.64%
|
12/9/2024
|
$250.70
|
PP = $240.68
|
|
MB = $252.71
|
Most Recent Note - 12/9/2024 1:24:01 PM
Y - Color code is changed to yellow with pivot point cited based on its 11/08/24 high Consolidating today following a "breakaway gap" up on the prior session for a new 52-week high as it triggered a technical buy signal. Reported Oct '24 quarterly earnings +31% on +13% sales revenues versus the year-ago period, its 3rd consecutive quarterly comparison above the +25% minimum earnings guideline (C criteria). Annual earnings growth has been strong. It was dropped from the Featured Stocks list on 12/09/20.
>>> FEATURED STOCK ARTICLE : Veeva Systems Consolidating After "Breakaway Gap" - 12/10/2024 |
View all notes |
Set NEW NOTE alert |
Company Profile |
SEC
News |
Chart |
Request a new note
C
A
S
I |
|
|
|
THESE ARE NOT BUY RECOMMENDATIONS!
Comments contained in the body of this report are technical
opinions only. The material herein has been obtained
from sources believed to be reliable and accurate, however,
its accuracy and completeness cannot be guaranteed.
This site is not an investment advisor, hence it does
not endorse or recommend any securities or other investments.
Any recommendation contained in this report may not
be suitable for all investors and it is not to be deemed
an offer or solicitation on our part with respect to
the purchase or sale of any securities. All trademarks,
service marks and trade names appearing in this report
are the property of their respective owners, and are
likewise used for identification purposes only.
This report is a service available
only to active Paid Premium Members.
You may opt-out of receiving report notifications
at any time. Questions or comments may be submitted
by writing to Premium Membership Services 665 S.E. 10 Street, Suite 201 Deerfield Beach, FL 33441-5634 or by calling 1-800-965-8307
or 954-785-1121.
|
|
|