Help Lines 954-785-1121


You are not logged in. Upgrade Here
 <<<Previous Mid Day Report     Next Mid Day Report >>> 
 <<<Previous After Market Report Next After Market Report >>> 
You are not logged in.
This means you CAN ONLY VIEW reports that were published prior to Wednesday, February 28, 2024.
You MUST UPGRADE YOUR MEMBERSHIP if you want to see any current reports.

AFTER MARKET UPDATE - TUESDAY, DECEMBER 10TH, 2019
Previous After Market Report Next After Market Report >>>
Indices NYSE Nasdaq
DOW  -27.88 27,881.72 -0.10% Volume 779,946,490 -9% Volume 2,034,183,470 -2%
NASDAQ -5.65 8,616.18 -0.07% Advancers 1,471 51% Advancers 1,612 52%
S&P 500 -3.44 3,132.52 -0.11% Decliners 1,406 49% Decliners 1,473 48%
Russell 2000 +2.10 1,631.71 +0.13% 52 Wk Highs 98   52 Wk Highs 86  
S&P 600 -3.07 999.06 -0.31% 52 Wk Lows 21   52 Wk Lows 61  

Lighter Volume and Less Leadership as Major Indices Edged Lower

The Dow lost 27 points, while the S&P 500 and Nasdaq Composite each dipped 0.1%. Advancers led decliners by a narrow margin on the NYSE and on the Nasdaq exchange. The volume totals were lighter than the prior session on the NYSE and on the Nasdaq exchange. Leadership thinned as there were 25 high-ranked companies from the Leaders List that hit a new 52-week high and were listed on the BreakOuts Page, versus the total of 40 on the prior session. New 52-week highs totals contracted yet still outnumbered new 52-week lows totals on the NYSE and on the Nasdaq exchange. The major indices (M criteria) are in a "confirmed uptrend" after enduring distributional pressure in recent weeks. The Featured Stocks Page provides the most timely analysis on high-ranked leaders.

Charts used courtesy of www.stockcharts.com

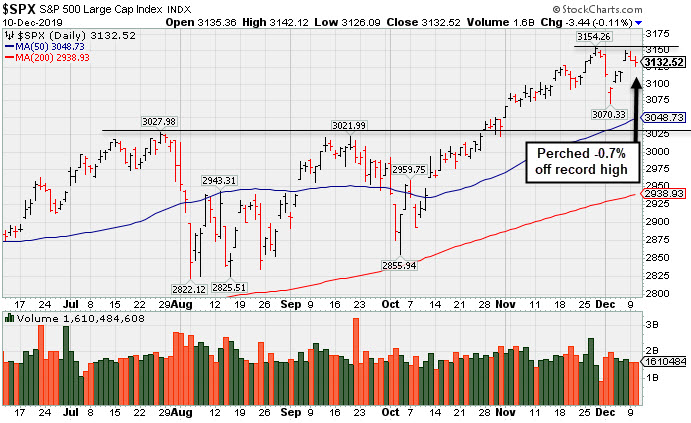
PICTURED: The S&P 500 Index is consolidating -0.7% off its record high. It recently found support well above prior highs and above its 50-day moving average (DMA) line. 

Stocks finished lower on Tuesday as investors monitored mixed trade headlines. A report indicated that a preliminary U.S.-China trade accord was unlikely to be solidified this week, but that Washington was expected to delay additional tariffs set to take effect on Sunday. However, White House officials pushed back, noting that the outcome remained uncertain and depended on how negotiations progress. Meanwhile, U.S. lawmakers came to a consensus for a trade pact with their North American partners, as widely anticipated. 

Treasuries were little changed, with the yield on the benchmark 10-year note up one basis point to 1.84%. On the data front, an update from the NFIB revealed small business optimism increased by more than expected in November, with the index notching its best month-over-month gain since 2018. In commodities, WTI crude gained 0.4% to $59.24/barrel, while COMEX gold added 0.3% to $1,463.50/ounce.

Seven of 11 S&P 500 sectors closed in negative territory, with Real Estate and Materials leading decliners. Energy and Health Care shares bucked the downtrend, while Tech and Financials ended unchanged. In earnings, Toll Brothers (TOL -4.88%) fell after the luxury home builder offered first-quarter margin forecasts that fell short of Wall Street expectations. AutoZone (AZO +6.93%) gapped up for a new all-time high after topping consensus profit, revenue, and same-store sales forecasts. Stitch Fix (SFIX +4.84%) rose after the online clothing styling service exceeded Wall Street sales expectations. In other corporate news, Netflix (NFLX -3.10%) fell on the heels of an analyst downgrade.

Kenneth J. Gruneisen started out as a licensed stockbroker in August 1987, a couple of months prior to the historic stock market crash that took the Dow Jones Industrial Average down -22.6% in a single day. He has published daily fact-based fundamental and technical analysis on high-ranked stocks online for two decades. Through FACTBASEDINVESTING.COM, Kenneth provides educational articles, news, market commentary, and other information regarding proven investment systems that work in good times and bad.

Comments contained in the body of this report are technical opinions only and are not necessarily those of Gruneisen Growth Corp. The material herein has been obtained from sources believed to be reliable and accurate, however, its accuracy and completeness cannot be guaranteed. Our firm, employees, and customers may effect transactions, including transactions contrary to any recommendation herein, or have positions in the securities mentioned herein or options with respect thereto. Any recommendation contained in this report may not be suitable for all investors and it is not to be deemed an offer or solicitation on our part with respect to the purchase or sale of any securities.


Gold & Silver, Biotech, Semiconductor, and Bank Indexes Rose

The Bank Index ($BKX +0.22%) posted a small gain while the Broker/Dealer Index ($XBD -0.03%) finished flat and the Retail Index ($RLX -0.25%) edged lower. The tech sector had a positive bias as the Semiconductor Index ($SOX +0.34%) and Biotech Index ($BTK +0.96%) posted gains while the Networking Index ($NWX +0.01%) finished flat.  Commodity-linked groups also had a positive bias as the Gold & Silver Index ($XAU +0.98%) posted a solid gain as the Oil Services Index ($OSX +0.09%) and Integrated Oil Index ($XOI +0.15%) both inched higher
Charts courtesy of www.stockcharts.com

PICTURED: The Bank Index ($BKX +0.22%) is now -5.2% off its January 2018 high, rebounding after a very weak finish in 2018 and a choppy 2019.

Industry Index Symbol Close Change % Change YTD % Change
Oil Services $OSX  71.53 +0.06 +0.08% -11.25%
Integrated Oil $XOI  1,212.65 +1.81 +0.15% +4.62%
Semiconductor $SOX  1,720.90 +5.92 +0.35% +48.97%
Networking $NWX  559.38 +0.06 +0.01% +14.47%
Broker/Dealer $XBD  286.88 +0.08 +0.03% +20.87%
Retail $RLX  2,360.23 -5.99 -0.25% +20.95%
Gold & Silver $XAU  998.87 -0.19 -0.02% +1,313.63%
Bank $BKX  111.08 +0.24 +0.22% +29.48%
Biotech $BTK  5,089.81 +48.50 +0.96% +20.59%


Found Support at 50-Day Moving Average

Capital City Bk Gp (CCBG +$0.38 or +1.31% to $29.43) found support as it tested its 50-day moving average (DMA) line ($28.45). Below that important near-term average the prior highs which define important support to watch. More damaging losses would raise concerns and trigger a technical sell signal.

CCBG was highlighted in yellow with pivot point cited based on its 12/03/18 high plus 10 cents in the 9/13/19 mid-day report (read here). It rallied for new 52-week highs with 3 consecutive solid volume-driven gains after it was last shown in this FSU section on 11/19/19 with an annotated graph under the headline, "Consolidating After Volume-Driven Gains for New Highs".

Earnings increases in the 4 latest quarterly comparisons through Sep '19 were above the +25% minimum guideline (C criteria) as its sales revenues growth rate was in the 9-13% range versus the year ago periods. It has a Timeliness Rating of A, but a Sponsorship Rating of D.

Its small supply of only 16.7 million shares outstanding (S criteria) can contribute to greater price volatility in the event of institutional buying or selling. The number of top-rated funds owning its shares rose from 159 on Sep '18 to 185 in Sep '19,  a reassuring sign concerning the I criteria. Its current Up/Down Volume Ratio of 1.1 is an unbiased indication its shares have been under slight accumulation over the past 50 days.

Charts courtesy of www.stockcharts.com


Color Codes Explained :
Y - Better candidates highlighted by our staff of experts.
G - Previously featured in past reports as yellow but may no longer be buyable under the guidelines.

***Last / Change / Volume data in this table is the closing quote data***
Symbol/Exchange
Company Name
Industry Group
PRICE CHANGE
(%Change)
Day High Volume
(% DAV)
(% 50 day avg vol)
52 Wk Hi
% From Hi
Featured
Date
Price
Featured
Pivot Featured
Max Buy
StockCharts.com Latest Chart for MLR MLR - NYSE
Miller Industries Inc
AUTOMOTIVE - Auto Parts  
$36.38 +0.31
0.86%

$36.51

28,094
61.07% of 50 DAV
50 DAV is 46,000
$37.70
-3.50%
9/24/2019 $34.00 PP = $35.36
MB = $37.13
Most Recent Note - 12/10/2019 5:48:45 PM
Y - Showing resilience after recently reporting earnings which were below the fundamental guidelines of the fact-based investment system. Remains perched near its 52-week high. Prior highs in the $35 area define initial support above its 50 DMA line ($34.59).
>>> FEATURED STOCK ARTICLE : Miller Still Quietly Hovering Above Prior Highs - 12/4/2019
 |  View all notes | Set NEW NOTE alert | Company Profile | SEC News | Chart | Request a new note C A  S  I 
StockCharts.com Latest Chart for CCBG CCBG - NASDAQ
Capital City Bk Gp
BANKING - Regional - Mid-Atlantic Banks  
$29.43 +0.38
1.31%

$29.43

15,448
39.61% of 50 DAV
50 DAV is 39,000
$30.85
-4.60%
9/13/2019 $27.03 PP = $27.05
MB = $28.40
Most Recent Note - 12/10/2019 5:44:04 PM
G - Posted a 3rd consecutive gain today with light volume after it found support at its 50 DMA line ($28.45). Prior highs which define the next important support to watch. More damaging losses would raise concerns and trigger a technical sell signal. See the latest FSU analysis for more details and a new annotated graph.
>>> FEATURED STOCK ARTICLE : Found Support at 50-Day Moving Averqge - 12/10/2019
 |  View all notes | Set NEW NOTE alert | Company Profile | SEC News | Chart | Request a new note C A  S  I 
StockCharts.com Latest Chart for FTNT FTNT - NASDAQ
Fortinet Inc
Computer Sftwr-Security  
$103.55 -0.30
-0.29%

$104.74

625,648
45.57% of 50 DAV
50 DAV is 1,373,000
$106.00
-2.31%
12/9/2019 $103.85 PP = $106.10
MB = $111.41
Most Recent Note - 12/9/2019 5:34:56 PM
Y - Color code is changed to yellow with new pivot point cited based on its 11/20/19 high plus 10 cents after forming an advanced 3-weeks tight base pattern. Volume totals have been cooling while still stubbornly holding its ground. Prior high in the $97 area defines initial support to watch on pullbacks.
>>> FEATURED STOCK ARTICLE : Extended From Prior Base Perched Near Record HIgh - 12/2/2019
 |  View all notes | Set NEW NOTE alert | Company Profile | SEC News | Chart | Request a new note C A  S  I 
StockCharts.com Latest Chart for SPSC SPSC - NASDAQ
S P S Commerce Inc
COMPUTER SOFTWARE and SERVICES - Application Software  
$55.78 +0.12
0.22%

$55.95

131,873
64.33% of 50 DAV
50 DAV is 205,000
$59.14
-5.68%
11/29/2019 $56.59 PP = $59.24
MB = $62.20
Most Recent Note - 12/10/2019 5:53:34 PM
Y - Endured distributional pressure in recent weeks near its all-time high. Subsequent gains above its pivot point backed by at least +40% above average volume are needed to trigger a new technical buy signal. Fundamentals remain strong.
>>> FEATURED STOCK ARTICLE : Rebound Leaves Supply Chain Management Software Firm Near High - 11/29/2019
 |  View all notes | Set NEW NOTE alert | Company Profile | SEC News | Chart | Request a new note C A  S  I 
StockCharts.com Latest Chart for AUDC AUDC - NASDAQ
Audiocodes Ltd
ELECTRONICS - Scientific and Technical Instrum  
$23.80 +0.33
1.41%

$24.21

215,116
79.09% of 50 DAV
50 DAV is 272,000
$25.04
-4.95%
9/13/2019 $19.68 PP = $19.84
MB = $20.83
Most Recent Note - 12/10/2019 5:46:57 PM
G - Volume totals have cooled while perched near its all-time high, extended from the previously noted base. Prior highs in the $22 area define initial support above its 50 DMA line ($20.95). Fundamentals remain strong.
>>> FEATURED STOCK ARTICLE : Volume Totals Cooling After Gains for New Highs - 11/22/2019
 |  View all notes | Set NEW NOTE alert | Company Profile | SEC News | Chart | Request a new note C A  S  I 
Symbol/Exchange
Company Name
Industry Group
PRICE CHANGE
(%Change)
Day High Volume
(% DAV)
(% 50 day avg vol)
52 Wk Hi
% From Hi
Featured
Date
Price
Featured
Pivot Featured
Max Buy
StockCharts.com Latest Chart for CHDN CHDN - NASDAQ
Churchill Downs Inc
LEISURE - Gaming Activities  
$131.89 +0.76
0.58%

$131.91

124,311
42.57% of 50 DAV
50 DAV is 292,000
$135.32
-2.53%
10/8/2019 $129.77 PP = $132.83
MB = $139.47
Most Recent Note - 12/9/2019 5:31:50 PM
G - Quietly perched within close striking distance of its 52-week high. Its 50 DMA line ($128.77) defines near-term support above the prior low ($121.81 on 11/07/19) The Jun and Sep '19 quarterly earnings versus the year ago periods were both below the +25% minimum guideline (C criteria) and raised fundamental concerns. See the latest FSU analysis for more details and a new annotated graph.
>>> FEATURED STOCK ARTICLE : Met Resistance After Rebounding Near Prior High - 12/9/2019
 |  View all notes | Set NEW NOTE alert | Company Profile | SEC News | Chart | Request a new note C A  S  I 
StockCharts.com Latest Chart for LULU LULU - NASDAQ
Lululemon Athletica
MANUFACTURING - Textile Manufacturing  
$229.65 -1.23
-0.53%

$231.70

2,913,833
182.91% of 50 DAV
50 DAV is 1,593,000
$233.53
-1.66%
9/6/2019 $201.25 PP = $194.35
MB = $204.07
Most Recent Note - 12/10/2019 1:03:25 PM
G - Earnings news is due. Volume and volatility often increase near earnings news. It is very extended from any sound base and quietly inching into new all-time high territory with recent gains lacking great volume conviction. Its 50 DMA line ($209) defines important near-term support to watch along with prior highs.

>>> FEATURED STOCK ARTICLE : New High Close Stretches Already Extended Leader - 11/26/2019
 |  View all notes | Set NEW NOTE alert | Company Profile | SEC News | Chart | Request a new note C A  S  I 
StockCharts.com Latest Chart for CPRT CPRT - NASDAQ
Copart Inc
SPECIALTY RETAIL - Auto Dealerships  
$88.38 +0.18
0.20%

$88.71

1,411,222
83.60% of 50 DAV
50 DAV is 1,688,000
$92.41
-4.37%
9/5/2019 $79.13 PP = $79.84
MB = $83.83
Most Recent Note - 12/9/2019 12:11:56 PM
G - Consolidating after getting extended from any sound base. The 50 DMA line ($83.92) defines near-term support above the prior low ($80.71 on 11/06/19). Fundamentals remain strong.
>>> FEATURED STOCK ARTICLE : Gapped Up Following Another Strong Earnings Report - 11/21/2019
 |  View all notes | Set NEW NOTE alert | Company Profile | SEC News | Chart | Request a new note C A  S  I 
StockCharts.com Latest Chart for NMIH NMIH - NASDAQ
N M I Holdings Inc Cl A
Finance-MrtgandRel Svc  
$33.98 +0.37
1.10%

$34.11

319,598
72.47% of 50 DAV
50 DAV is 441,000
$34.50
-1.51%
11/8/2019 $32.89 PP = $31.44
MB = $33.01
Most Recent Note - 12/10/2019 5:51:13 PM
G - Perched within close striking distance of its all-time high. Prior highs in the $30-31 area coincide with its 50 DMA line ($30.53) defining important near-term support..
>>> FEATURED STOCK ARTICLE : Holding Ground Stubbornly Near All-Time High - 11/27/2019
 |  View all notes | Set NEW NOTE alert | Company Profile | SEC News | Chart | Request a new note C A  S  I 
StockCharts.com Latest Chart for SPLK SPLK - NASDAQ
Splunk Inc
Computer Sftwr-Database  
$149.08 -0.67
-0.45%

$150.30

1,265,670
68.19% of 50 DAV
50 DAV is 1,856,000
$152.68
-2.36%
11/25/2019 $147.79 PP = $142.16
MB = $149.27
Most Recent Note - 12/10/2019 5:52:36 PM
Y - Volume totals have been cooling while stubbornly holding its ground and consolidating near its "max buy" level. Prior highs in the $142-143 area define initial support to watch on pullbacks.

>>> FEATURED STOCK ARTICLE : Spurt of Volume-Driven Gains Reaches New All-Time High - 11/25/2019
 |  View all notes | Set NEW NOTE alert | Company Profile | SEC News | Chart | Request a new note C A  S  I 
Symbol/Exchange
Company Name
Industry Group
PRICE CHANGE
(%Change)
Day High Volume
(% DAV)
(% 50 day avg vol)
52 Wk Hi
% From Hi
Featured
Date
Price
Featured
Pivot Featured
Max Buy
StockCharts.com Latest Chart for PAYC PAYC - NYSE
Paycom Software Inc
COMPUTER SOFTWARE and SERVICES - Application Software  
$265.50 -3.30
-1.23%

$271.26

355,957
62.01% of 50 DAV
50 DAV is 574,000
$279.95
-5.16%
11/20/2019 $252.97 PP = $259.81
MB = $272.80
Most Recent Note - 12/9/2019 5:37:04 PM
Y - Color code is changed to yellow while quietly consolidating just below its "max buy" level. Prior high ($259) defines initial support to watch on pullbacks. Fundamentals remain strong.
>>> FEATURED STOCK ARTICLE : Powerful Gain for New High Backed by Heavy Volume - 11/20/2019
 |  View all notes | Set NEW NOTE alert | Company Profile | SEC News | Chart | Request a new note C A  S  I 
StockCharts.com Latest Chart for BLD BLD - NYSE
Topbuild Corp
Bldg-Constr Prds/Misc  
$108.20 -1.51
-1.38%

$109.80

216,892
80.93% of 50 DAV
50 DAV is 268,000
$113.74
-4.87%
5/17/2019 $82.19 PP = $87.31
MB = $91.68
Most Recent Note - 12/9/2019 5:41:10 PM
Y - Color code is changed to yellow after a tight consolidation, with new pivot point cited based on its 11/27/19 high plus 10 cents. Subsequent gains for new highs back by at least +40% above average volume are needed to trigger a new (or add-on) technical buy signal. Reported earnings +24% on +5% sales revenues for the Sep '19 quarter versus the year ago period, just below the +25% minimum guideline (C criteria). Its 50 DMA line ($103.82) acted as support during its ongoing ascent.
>>> FEATURED STOCK ARTICLE : Consolidating After Getting Extended From Any Sound Base - 12/3/2019
 |  View all notes | Set NEW NOTE alert | Company Profile | SEC News | Chart | Request a new note C A  S  I 
StockCharts.com Latest Chart for GLOB GLOB - NYSE
Globant SA
Computer-Tech Services  
$100.51 -1.33
-1.31%

$102.58

172,863
64.50% of 50 DAV
50 DAV is 268,000
$112.33
-10.52%
11/14/2019 $106.87 PP = $112.43
MB = $118.05
Most Recent Note - 12/10/2019 5:57:56 PM
G - Disciplined investors will watch for noted improvement and subsequent volume-driven gains for new highs which are still needed to trigger a technical buy signal. Found support near its 50 DMA line ($98) after volume-driven losses. Prior lows and its 200 DMA line define the next important support to watch. Fundamentals remain strong.
>>> FEATURED STOCK ARTICLE : Found Support at 50-Day Average During Choppy Consolidation - 12/5/2019
 |  View all notes | Set NEW NOTE alert | Company Profile | SEC News | Chart | Request a new note C A  S  I 

THESE ARE NOT BUY RECOMMENDATIONS!  Comments contained in the body of this report are technical opinions only. The material herein has been obtained from sources believed to be reliable and accurate, however, its accuracy and completeness cannot be guaranteed. This site is not an investment advisor, hence it does not endorse or recommend any securities or other investments. Any recommendation contained in this report may not be suitable for all investors and it is not to be deemed an offer or solicitation on our part with respect to the purchase or sale of any securities. All trademarks, service marks and trade names appearing in this report are the property of their respective owners, and are likewise used for identification purposes only.

This report is a service available only to active Paid Premium Members. You may opt-out of receiving report notifications at any time.  Questions or comments may be submitted by writing to Premium Membership Services 665 S.E. 10 Street, Suite 201 Deerfield Beach, FL 33441-5634 or by calling 1-800-965-8307 or 954-785-1121.

Kenneth J. Gruneisen founded Gruneisen Growth Corp. (2003), which prior to May 11, 2015, operated CANSLIM.net and CANSLIM.com both under license from Data Analysis Inc. / Investor's Business Daily. Kenneth has passed the CAN SLIM® Master's Exam. Gruneisen Growth Corp. now continues over two decades of fact based market analysis via FactBasedInvesting.com.

Copyright © 1996-2024 Gruneisen Growth Corp. All rights reserved. Protected by the copyright laws of the United States and Canada and by international treaties

Privacy Policy | Terms of Use | Contact Us